Effect of Automotive Electrical System Changes on Fuel
Consumption Using an Incremental Efficiency Methodology
by
Christopher William Hardin
Bachelor of Science in Mechanical Engineering University of Pittsburgh, Pittsburgh, PA, April 2002
Submitted to the Engineering Systems Division in Partial Fulfillment of the Requirements for the Degree of
Master of Science in Technology and Policy at the
Massachusetts Institute of Technology September 2004
)2004 Massachusetts Institute of Technology All rights reserved.
OF TECHNOLOGY
MAY 3 1 2006
LIBRARIES
Signature
of Author
...
....
...
Technology and Policy Program, Engineering Systems Division, August 6, 2004
Certified
by.... ... :... ...
Richard Roth, Thesis Supervisor
> ~/.,~~~ ~Director, Materials Systems Lab
Certified
C ertified byby..
~ ....
. ... .... .. . ... e...,,e...e.9
... .... e.. ... ... . o ... .•7
e . .. ..* e ...* . .. . .,.e Thomas A. Keim, Thesis Supervisor Principal Research Engineer and LEES Associate Director C ertified by.. .r ... d ......
Certifiedd~ byy ..
oGary
DesGroseilliers,
Thesis
Supervisor
, o-~ / Automotive Program Consortium Manager
Certified by- 1 ... ... ... Frank R. Field III, Thesis Supervisor ,enior Reseawch Engineer, Center for Technology, Policy, & Industrial Development
A ccepted
by ... ...
(
...
Dava J. Newman, Director, Technology and Policy Program Professor of Aeronautics and Astronautics and Engineering Systems
Effect of Automotive Electrical System Changes on Fuel
Consumption Using an Incremental Efficiency Methodology
by
Christopher William Hardin
Submitted to the Engineering Systems Division
On August 6, 2004 in Partial Fulfillment of the Requirements for the Degree of Master of Science in Technology and Policy
Abstract
There has been a continuous increase in automotive electric power usage. Future projections show no sign of it decreasing. Therefore, the automotive industry has a need to either improve the current 12 Volt automotive electrical system or move to a higher voltage vehicle electric system. Both of these choices are likely to increase cost of the system. Performance improvements will be needed to justify the increased cost to the Original Equipment Manufacturer. This thesis is investigating the potential for fuel economy
improvements and their associated economic advantages for different vehicle electric systems. The objective is to determine the effects on fuel consumption of electrical system choices under a variety of drive and load cycle circumstances. Incremental, or marginal, efficiencies will be used to determine the relationship between loads and fuel consumptions. ADVISOR, a model developed by the National Renewable Energy Lab, has been adapted for use in this application. This included the implementation of industry standard engine performance map and alternator efficiency map data in the ADVISOR model.
Thesis Supervisor: Richard Roth
Thesis Supervisor Title: Director, Materials Systems Laboratory Thesis Supervisor: Thomas A. Keim
Thesis Supervisor Title: Principal Research Engineer and LEES Associate Director Thesis Supervisor: Gary DesGroseilliers
Thesis Supervisor Title: Automotive Consortium Program Manager Thesis Supervisor: Frank R. Field III
Thesis Supervisor Title: Senior Research Engineer, Associate Director of the Technology and Policy Program
Acknowledgements
I think writing the acknowledgements may be harder than the following 80 pages. LOL! I am awed by the talent here at MIT. The professors, students, and research staff are truly one of a kind. What was viewed once as a simple world will now never be viewed the same through my eyes. Who knew that so much in this world could be questioned - and answered?
I would like to first thank my advisors for putting up with me. I don't know how they did it. They have had patience never before seen. Their guidance and knowledge has turned into a wonderful learning experience for me throughout my two years here. To Rich Roth, Gary DesGroseilliers, Tom Keim, and Frank Field, thank you for all of your time, patience, and constructive feedback. I could never express in words how much they are appreciated.
Before I came to MIT, I thought I was going to be alone and surrounded by students who were smarter than me and rubbed it in. I thought I was in for two isolated years. I guess I basically had all of the worst fears one could have before coming to MIT. Well, all of those fears were put to rest once I arrived in the Technology and Policy Program - except the one where everyone was smarter than me. MIT has truly humbled me. I also couldn't believe the patience from the students when explaining their views to a perplexed audience, or the patience they had when trying to understand my own perplexing thoughts. A brotherhood of sorts was formed with my friends in the Technology and Policy Program. We learned a lot from each other and worked through some tough times. I hope that we can remain friends over the years and continue to help each other out through any tough times ahead.
The Material Systems Lab one was I am very proud to have worked in. The students and staff were truly amazing. I loved all of the conversations about the day to day events in the world and I appreciated the humor with which we could disagree. I suppose I will be
remembered as the warmonger of the group but I think that is better than the tree hugger. LOL! Mike Johnson, excuse me, Dr. Johnson, Alex, Colleen, Jennifer, Laetitia, Preston, and Delphine, I wish you the best. And thank you for all of the great conversations and guidance over the years. Joel Clark, thank you for everything you have done for the students. You can be proud of having such a warm and generous heart.
My friends outside of MIT have also been extremely patient and guiding. Jignesh Amin, Victor Anderson, and Kevin Pellerin were very welcoming to me when I first arrived at MIT and Boston. They have been great friends and have gone above the call of friendship duty. I have learned a great deal about friendships through them and I hope to one day be as good and kind-hearted as they were to me through my stay here. I also need to thank Vic for his computer programming advice. A lot of my research results lie in his understanding of what I needed to do but didn't know how to do it.
Last and certainly not least, I need to thank my family. They have been supportive of my decisions and have always been very patient listeners when I had something to complain about. I never could have done it without their support and understanding. I hope you know how
important you are to me.
Table of Contents
Abstract ... 3 Acknowledgements ... .5 Table of Contents ... 6 Table of Figures ...7 Table of Tables ... 7Definritions and Abbreviations ... 8
1. Introduction...9
2. Problem Statement . . ...18
3. Tools & M ethods . . ...23
3.1 Computer Simulation Tool - ADVISOR ... 24
3.1.1 Defining the Vehicle ... 25
3.1.2 Drive Cycle, Initial Conditions, and Electrical Auxiliary Loads ... 27
3.2 Engine Performance M ap ... 31
3.3 Alternator Efficiency Data ... 33
3.4 Methods - Energy Balance and Efficiencies ... 35
3.4.1 Energy Balance ... 35
3.4.2 Gross System Efficiency ... 39
3.4.3 Electrical Generation Efficiency ... 41
3.4.4 Incremental Efficiency ... 44
4. Cases & Results . . .. . . ...49
4.1 Incremental Alternator Efficiency ... 49
4.2 Incremental Engine Efficiency ... 51
4.3 Comparison of Efficiency M etrics ... 53
4.4 Gross System Efficiency ...53
4.5 Electrical Generation Efficiency ... 55
4.6 Incremental Efficiency of the Engine/Alternator System ... 57
5. Policy ... 60
5.1 Policy Measure: Increasing Fuel Economy Standards ... 60
5.2 Why Increase Fuel Economy Standards ... 60
5.3 Fuel Economy Standards ... 62
5.4 Value of FE Improvements to Vehicle Owner ... 64
5.5 Value of FE Improvement to Manufacturers ... 65
5.6 Opposition to Increasing FE Standards ... 68
5.7 Conclusion ... 69
6. Summ ary ... 71
7. Future Applications/W ork . ...74
References ... ... 76
Appendix ... ... 78
ADVISOR VALIDATION ... 78
Basic Test ... 78
Table of Figures
Figure 1-1: Projected Automotive Electric Power Requirements [2] ... 10
Figure 1-2: Energy Balance of entire automobile [8] ... 14
Figure 3-1: First Page in ADVISOR ... 26
Figure 3-2: Second Page of ADVISOR ... 27
Figure 3-3: Additional Electrical Loads Page in ADVISOR ... 29
Figure 3-4: Front Defroster On/Off Profile ... 30
Figure 3-5: Engine Efficiency Map with Contours ... 32
Figure 3-6: Alternator Efficiencies at Alternator Output Loads and Engine Speeds ... 34
Figure 3-7: Engine Alternator System used for Energy Balance ... 36
Figure 3-8: Power Balance at 30mph; 0-1200 Alternator Output ... 38
Figure 3-9: Zooming of Figure 3-8's Power Balance at 30 mph ... 39
Figure 3-10: Gross Efficiency Example Calculation ... 41
Figure 3-11: Electrical Generation Efficiency Control Volume ... 42
Figure 3-12: Demonstration of What is Needed ... 43
Figure 3-13: Electrical Generation Efficiency Calculation ... 44
Figure 3-14: Incremental Efficiency Illustration ... 45
Figure 3-15: Incremental Efficiency Calculation ... 48
Figure 4-1: Incremental Alternator Efficiency vs. Alternator Output Power in Watts ... 50
Figure 4-2: Incremental Engine Efficiency vs. Alternator Output Power in Watts ... 52
Figure 4-3: Gross System Efficiency Metric ... 55
Figure 4-4: Electrical Generation Efficiency Metric ... 56
Figure 4-5: Total Incremental Efficiency vs. Alternator Output Power in Watts ... 57
Figure 5-1: Cost of Regulatory Compliance [11] ... 66
Figure 6-1: Simplification of Calculating the Incremental Efficiency at 30 mph ... 72
Figure A-1: Output Results Page from ADVISOR ... 80
Figure A-2: Engine Brake Torque vs. Time ... 81
Figure A-3: Engine Speed (rad/sec) vs. Time ... 82
Table of Tables
Table 1 -1: Steady State Engine Efficiency for Various Constant Speed Drive Cycles [9] ... 15Table 1-2: Engine Efficiency Changes with Various Electrical Loads Added [9] ... 16
Table 5-1: List of Advanced Vehicle Electric Technologies and Their Estimated Fuel Economy Improvement [10] ... 64
Table 5-2: Hypothetical Fleet Calculation [11, 17] ... 67
Table 5-3: Hypothetical Fleet Calculation with increased fuel economy of 1% [11, 17] ... 68
Table A-1: Comparison of Two bsfc Calculations for Selected Points ... 85
Definitions and Abbreviations:
mf = mass flow rate of fuel
bsfc/BSFC = brake specific fuel consumption ERPM = engine revolutions per minute
Pb = brake power
= efficiency
?gross = gross system efficiency
?/elec.gen. = electrical generation efficiency
nhncrem. = incremental efficiency Walt. = alternator efficiency
rengine = engine efficiency
Tincr. alt. = incremental alternator efficiency
ilincr. engine = incremental engine efficiency
QLHV = lower heating value of the fuel
A = change in co = engine speed
Torqueprop = Torque needed for propulsion of the vehicle
Torquealt = Torque supplied to the alternator from the engine shaft Total Torque = Torqueprop + Torquealt
a = differential change in Palt = alternator output
CAFE = Corporate Average Fuel Economy OEM = Original Equipment Manufacturer
AC = Alternating Current
DC = Direct Current
GM = General Motors
ADVISOR = Advanced Vehicle Simulator
IHP = Indicated Horse Power BHP = Brake Horse Power
NREL = National Renewable Energy Lab WOT = Wide Open Throttle
1. Introduction
The automobile has been repeatedly equipped with more electrical and electronic components since its introduction. The increases have been due to the desirability of electrical functions that facilitate low emissions and high fuel economy, and enhance reliability, occupant safety, comfort and convenience [ 1 ]. As more increases in vehicle electrical technology take place, the maximum power limit of the system is being reached. This puts the system under strain and leads to inefficiencies. Throughout the years, incremental changes to the systems have occurred but no major shift or overhaul has been done to the system since the 1950s.
In the 1950's a change was implemented from the 6V architecture to the 12V
architecture. This transition took place in a three year time period. The need for this transition arose from the high compression spark ignition engine needing a higher voltage ignition system. There were also increases in the growing number of accessories that required more electrical power at that time. Chrysler and GM were the first to introduce the 12V electrical system in their product lines in 1953. More accessories were introduced after Ford developed the AC generator in 1958, replacing the DC generator. During this transition time, the average vehicle's electric load increased from 340 Watts in 1953 to more than 600 Watts in 1963 [1].
The automotive industry is facing a similar situation now as new technologies are
increasingly being introduced (e.g. electric power steering, seat heaters, VCR and DVD players, dash mounted navigation systems),and proposed (e.g. electromechanical valves, drive-by-wire technology, and active suspension.) These new technologies will require more electric output in future vehicles. Figure 1-1 shows two possible representations of future vehicle electric
as the 14V system exceeds its output. Therefore, the automotive industry has a need to either improve the current 14 Volt automotive electrical system or move to a higher voltage vehicle electric system to meet this need. A 42 Volt electrical system has been proposed and accepted as a new automotive electric standard. However, higher costs associated with new electrical
systems pose a challenge. The higher costs may be offset by energy efficiency gains and the resulting fuel savings.
Figure 1-1: Projected Automotive Electric Power Requirements [2]
Only a limited number of vehicles have been introduced to the public, despite a general agreement from the OEMs that a new electrical system is needed. Several vehicles with
advanced electrical systems (e.g., Ford Escape Hybrid, Toyota Crown Sedan, GMC Sierra PHT, Saturn VUE, and the GM Silverado Hybrid) have recently been introduced to the public with limited success. 6 5 4 3 L. CD 0
0
0 1970 1980 1990 2000 2010 2020 2030 Model YearTo move to a higher voltage electrical system there are several challenges. Several technical challenges are controlling electric arcing and the possible need for a dual voltage
system prior to the higher system. One reason for a dual voltage system when considering a 42 Volt system is that light bulb filaments will become very small and too fragile under a 42V
system and may break when the vehicle drives over bumps in the road [3]. Besides some of these technical challenges there are economic challenges as well. There will be a need for a large investment to overhaul the vehicle electric system. The investment comes with high risks because the benefits for new systems do not clearly offset the investment costs. Therefore, no
one auto company wants to move alone.
In 1994, a European automobile manufacturer anticipated a higher voltage requirement to support their electrical system in the future. Realizing the need for industry acceptance of a new voltage system, the Massachusetts Institute of Technology was asked to put together the
MIT Working Group. Consisting of seven automotive OEMs and suppliers, this group
considered issues of safety, reliability, infrastructure and transition costs. The result was a set of recommendations that proposed a 42V system with an engine-off voltage of 36V from an 18-cell
lead-acid battery. After spreading the idea throughout Europe and Japan, the working group transformed into the MIT/Industry Consortium on Advanced Automotive Electrical/Electronic
Systems [4]. There is also a working group of European OEMs and suppliers that is know as the "Forum Bordnetz". Its work is organized and facilitated by sci-worx GmbH, a German
The MIT Consortium, the Forum Bordnetz, the Institute of Electrical and Electronics Engineers (IEEE) and the Society of Automotive Engineers (SAE) work to set standards for new vehicle electric systems to help with any future transition.
Changing to a new electrical system will take an extremely large commitment from the automotive industry costing perhaps millions if not billions of dollars in capital investment [5]. In order to intelligently invest in the new electrical system, the entire life cycle economic cost and benefits must be assessed so that an eventual return on investment, if one exists, can be
known [5].
There are industry reports of increased costs due to the transition to a new voltage electrical system. The increase in cost is due to the complexity, increased functionality, device content, and transition uncertainties [6].
There are various benefits that can be used to characterize changes in the vehicle system due to changes in the electrical system. A principal benefit of a higher voltage electrical system is the reduced current required. The lower current means that electrical conductors in the wire harness can be smaller, lighter, and less expensive [7]. The benefits of reduced wire size will probably not be sufficient to overcome the increased costs of the new system. Other benefits include electrically assisted turbochargers, electric power steering, idle start stop systems and many others. No single item seems likely to be able to "pay" for the new system.
A cumulative benefit of these features that may overcome costs is their reduction of fuel use. Reduction in fuel use can also have the positive side effect of reducing emissions. Changes in fuel economy are often used by the auto-industry when evaluating the implementation of new
technologies. Fuel economy can be physically measured and has a known value. So, if fuel economy improvement can be gained by changes to the vehicle electric system, a question that arises is, how much?
One method that can be used to estimate fuel economy improvements can be changes in an overall energy balance of the vehicle system. Figure 1-2 below shows an overall energy balance across a sample spark-ignition automobile [8]. Starting at the top of the chart with 100% fuel energy, the chart shows the losses that occur. After combustion of the fuel, 62.4% of the total fuel energy is lost to the ideal 2nd law of thermodynamics and the real inefficiencies of the
engine. The remaining 37.6% is called the indicated horsepower (IHP). The IHP is the power that is transmitted to the piston from combustion. Idle friction loss of 17.2% and accessory losses of 2.2% reduce the indicated horsepower to leave the useful work or the brake horsepower (BHP) to 18.2%. Drivetrain, rolling, and aerodynamic losses are further reductions of BHP. The remaining power is then left for acceleration of the vehicle.
Drivetrain los
5.6%
Figure 1-2: Energy Balance of entire automobile [8]
It is generally accepted that the introduction of various electrical technologies will decrease power losses to the engine and drivetrain. Some of the new electrical technologies will replace mechanical components that are presently belt-driven from the crankshaft of the internal combustion engine. Several of the mechanical components that can be decoupled and replaced with electrical components are: electric coolant circulation, electric power steering, and an
electric oil pump. The launching of these new electrical accessories can reduce mechanical friction losses in the engine but will increase accessory energy pulled from the alternator. It will be necessary to know the reduction in friction loss and increase in electric accessory power so
New electrical technologies can also assist in decreasing friction losses due to idling. Cylinder deactivation will shut the engine off while the vehicle is stopped at a red-light or stop sign. This will decrease idle friction loss while the vehicle is stopped.
This high level energy balance is not a sufficient method to determine actual fuel consumption improvements. A high level energy balance misses multiple system interactions that are important when calculating fuel economy benefits. For instance, there will be changes in the engine and alternator system efficiencies that would be missed by the high order energy balance. A high level energy balance method uses average engine efficiency irrespective of engine speed. When in fact at various engine operating conditions the engine efficiency can be quite different. A variation of V-8 engine efficiencies is illustrated in Table 1-1.
Table 1-1: Steady State Engine Efficiency for Various Constant Speed Drive Cycles 91
Constant
Drive Cycle Egn
Speed(m h) Efficiency(%)
Speed(mph)
30 19.8 40 21.3 50 22.75 60 23 70 22.22 80 23.1Another factor that discourages a high order energy balance is the fact that the same load has different effects at various operating conditions. This is because the engine efficiency changes at the different operating conditions when an extra mechanical or electrical load is turned on during a drive cycle.
Table 1-2 shows the effect of various electric loads at different operating speeds on engine efficiency.
Table 1-2: Engine Efficiency Changes with Various Electrical Loads Added [91
Engine Engine Constant Electrical Efficiency Efficiency Drive Cycle Load (W) No Load with
Speed(mph) ( %) Electric Load
(%)
30 502 19.8 19.98 30 999 19.8 20.1 30 1999 19.8 20.53 40 502 21.3 21.5 40 999 21.3 21.57 40 1999 21.3 21.92 50 502 22.75 22.9 50 999 22.75 23 50 1999 22.75 23.25 60 502 23 23 60 999 23 23 60 1999 23 23.2 70 502 22.22 22.35 70 999 22.22 22.5 70 1999 22.22 22.67 80 502 23.1 23.29 80 999 23.1 23.5 80 1999 23.1 23.9There are sources that suggest amounts of possible improvement due to a change in the vehicle electric system. One, the National Research Council (NRC) report on "Effectiveness and Impact of Corporate Average Fuel Economy (CAFE) Standards", suggests that a 1 to 2%
increase in fuel economy can be accomplished with the introduction of the 42V technology [10]. The numbers given by the NRC do not reflect all the changes possible with an increased 42 Volt
system. In fact, their own report goes on to mention additional savings from features such as electromechanical valve trains. This feature has been only demonstrated possible with an
advanced electrical system. Furthermore, the numbers do not actually address the specifics of how the new electrical system will be implemented. This makes the industry skeptical of the accuracy of these numbers.
These tools and methods are insufficient to address changes in fuel consumption for the detail needed when considering changes to the electrical system and their effects on fuel
economy. Another method is necessary to give more detailed and accurate results. A method that will accurately estimate fuel economy improvements that can be obtained with a higher voltage electrical system or a change in the current electrical system, under a wide variety of operating conditions and drive and load cycles is needed. This report will introduce an efficiency metric that will do just that.
2. Problem Statement
Electrical system efficiencies are becoming more important as the automotive industry moves toward the use of more electrical components. With the increase in vehicle functions for safety, fuel economy, and comfort, future vehicles will consume more electrical power. To efficiently meet this demand, higher voltage systems or improving the efficiency of the existing system are being considered. Higher costs associated with these systems might be offset by
energy efficiency gains and the resulting fuel savings.
The overall objective of this project is to determine a value proposition for vehicle electric systems. The focus of the research has been on the development of a metric to help determine a value proposition for changes in vehicle electric systems.
A value proposition for moving to a new vehicle electric system is defined as the benefit
for either using the existing electrical system more efficiently or moving to a higher voltage electric system in comparison to their respective cost. New or advanced technologies require a net benefit. Therefore, there should be a balance between cost and performance. There are two positive value scenarios. One is where the new electrical system is at or below the cost of the existing system. Then there would be no need for performance improvements. The second is when the cost of the new system is greater than the current system. In that case, there should be performance improvements to justify the higher cost. Previous research and industry experience agree that the transition to a 42 Volt system, the new voltage standard, will increase cost [6]. A question that arises from this is: "Are there sufficient performance benefits to justify the cost increase of a new electrical system?" The motivation for this work is that the benefits that can be
gained from moving to a new electrical system are either not correctly measured or not measured at all. This research will help clarify how benefits, or losses, can be measured.
There are several metrics used to define benefits for a new electrical system. Some are: - a more powerful car
- the addition of luxury features - reduction in emissions
- reduction in fuel use
This work will only focus on fuel use, or increased fuel economy, to define electrical system changes or, more desirably, benefits.
Fuel economy is used as the metric to define changes in electrical systems for several reasons. One reason fuel economy is chosen is that the automotive industry evaluates the implementation of new technologies by their effect on fuel economy. This fuel economy effect has a value to automobile manufacturers and purchasers and can therefore be compared with its cost. Another reason is that the fuel economy effect can be easily attributed as benefits or costs to automobile manufacturers and purchasers.
Two important questions arise with regard to influence of the electrical system on fuel economy. The first is, "how much is fuel economy worth?" Several approaches to answering this question have been put forth, such as, lifecycle costing of fuel and cost of meeting
regulations such as CAFE [ 1]. The second question that arises is, "how much fuel economy can be gained by moving to a more advanced vehicle electric system?" The focus of this thesis will be to develop a methodology that can help answer this question. The methodology must be able to measure fuel economy changes caused by moving to a more advanced electrical system.
One way to define the changes in fuel economy due to electrical system changes is to use a traditional engineering metric - efficiency; how much can be gained from what is put in. Some difficulty in measuring changes in engine and alternator arises because these systems are not
linear. Also, fuel economy is not a linear function of load due to the complexity of the relationships between mechanical and electrical loads over various drive and load cycles.
Several efficiency metrics were chosen to evaluate which one will lead to the most informative measure of fuel economy changes resulting from electrical system, or alternator, outputs. These efficiency metrics will measure effects on fuel consumption due to changes in electrical system choices under a variety of drive and load cycle circumstances. The term
efficiency is a difficult and sometimes confusing term to use. Incremental efficiency was chosen as the metric to use when trying to calculate the efficiency of the next electrical watt of power output from the alternator. This thesis will consider other efficiencies that are sometimes used to express changes in the electrical system. These other efficiencies are the gross system efficiency and the electrical generation efficiency. Each will be clearly defined and their differences
pointed out.
A model of engine and alternator performance is needed to identify changes in fuel consumption due to changes in the electrical system. An engine performance map is the
automotive standard used to describe an engine's fuel consumption vs. engine speed and torque. The map is a function that outputs brake specific fuel consumption given the inputs of torque and speed. For this work, an engine performance map was developed from industry supplied data.
Alternator efficiency data is also needed to help identify changes in fuel consumption due to changes in the electrical system. The alternator efficiency data were recreated from the Bosch
handbook [12].
A computer simulation tool that could incorporate the engine performance map and the electrical energy efficiency data is also needed. The National Renewable Energy Laboratory's ADvanced VehIcle SimulatOR (ADVISOR) [13], is used as the primary tool throughout this study to calculate various engine performance parameters with a conventional automotive configuration over chosen drive cycles. A key feature of ADVISOR, relevant to this research, is that it incorporates both engine and alternator efficiencies into its calculations of fuel
consumption. ADVISOR is also an open source code that can be changed to suit this research (i.e. no "black box").
A validation of the integration of the efficiency data with ADVISOR is necessary to verify accuracy of the ADVISOR results using the incorporated data. Several of the tests
consisted of calculating the results using the engine and alternator tables without ADVISOR and then comparing to ADVISOR results. This is demonstrated in the Appendix on page 78.
Incremental, or marginal, efficiencies may be the most informative way to determine the correlation between loads and fuel consumptions at various operating points at various loads. The incremental efficiency is defined as the efficiency of production of an additional electrical Watt at the engine and/or alternator operating point. Electrical device efficiencies, other than the alternator, are not part of this study.
This thesis focuses on developing and using a tool to measure the fuel consumption implications from changes in vehicle electric systems. In order to do this, the work has focused on measuring incremental efficiencies throughout constant speed drive cycles and varying electric load cycles to identify a load's efficiency. Incremental efficiencies will be compared to the total gross efficiency and the electrical generation efficiency to help explain when
incremental efficiency is the correct measure to use when trying to calculate changes in electrical system outputs.
3. Tools
&
Methods
Fuel economy is described using several metrics. In the United States, the figure of merit is almost always miles per gallon. The rest of the world uses liters of fuel per one-hundred kilometers. In addition to using different units, these two measures bear an inverse relationship to one another. Yet another measure is brake specific fuel consumption (BSFC) with units of pounds of fuel per horsepower hour or grams per megajoule, among other choices. BSFC is an explicit measure of the effectiveness of the engine at converting fuel to mechanical work, without reference to whether that mechanical work is efficiently used.
Closely related to these concepts is that of efficiency. There are many definitions of efficiency. All bear the common characteristic that they comprise a dimensionless ratio. The numerator is some desired output, for example, the net power out of the engine into the driveshaft. The denominator is some measure of input, for example, the net chemical power produced inside the engine cylinders. This example would measure the engine's efficiency.
To measure changes in fuel economy due to changes in the electrical system, the incremental efficiency metric will be used. It will be compared to some of the other efficiency metrics to help clarify its importance as a metric.
In order to calculate incremental efficiency, the fine structure of engine and alternator systems is needed. First the computer simulation model will be described. The following sections of this chapter will cover engine and alternator performance. There is a need for a computer simulation software tool that can integrate both engine and alternator performance data. Without the integration of the engine and alternator data, a clear evaluation of the system
cannot be done. ADVISOR, the software tool chosen, will be described. The final section of this chapter will discuss the energy balance scenarios that define the different efficiency performance metrics.
3.1 Computer Simulation Tool- ADVISOR
ADvanced VehIcle SimulatOR (ADVISOR) was created in 1994 by the National Renewable Energy Lab (NREL). It is a set of model, data, and script text files for use with Matlab and Simulink [13]. ADVISOR can be used to calculate fuel economy and emissions data for conventional, hybrid, or electric vehicles.
With this program, fuel economy under different operating conditions can be found for different vehicles through the use of engine performance maps and fairly detailed drivetrain and propulsion resistance models. The electrical system elements of ADVISOR are not well
modeled. However, the model is unencrypted, so Matlab scripts for electrical component models can be added. ADVISOR has various built-in drive and load cycle models that can be applied to the vehicle and its defined components. The drive and load cycles can be changed to explore
changes in fuel economy under a variety of conditions.
ADVISOR version 2002 has both desirable and undesirable attributes when considering its application for evaluating advanced vehicle electric systems and fuel economy. Two
desirable attributes are that it has built-in engine performance models and it is an open-source code. ADVISOR can also be used to estimate fuel economy of vehicles that have not yet been built as well as learn how conventional, hybrid, or electric vehicles use and lose energy
changes in torque, engine speed, engine efficiency, and instantaneous changes in fuel
consumption while the vehicle is going through a chosen drive cycle. ADVISOR lets the user define which vehicle components to study. The major thrust of ADVISOR is comparing different, substantially non-standard, powertrain configurations, in comparisons of significant complexity, for example, in operation over one or more drive cycles.
A disadvantage is that documentation for ADVISOR is limited. Another disadvantage of ADVISOR is that it was not designed or created for this specific project. These disadvantages are not necessarily major. It does mean that ADVISOR has significant capabilities that are not applied to this project. However, it could be a disadvantage if these unused capabilities have been obtained at the expense of reduced accuracy or usefulness in modeling those capabilities which will be used. Efforts were taken to determine that this is not the case.
ADVISOR uses the term 'fuel converter'. This is a generalization. In conventional drivetrains like the ones considered, this term refers to the engine. But in many of the ADVISOR graphics the reader will see the term fuel converter.
3.1.1 Defining the Vehicle
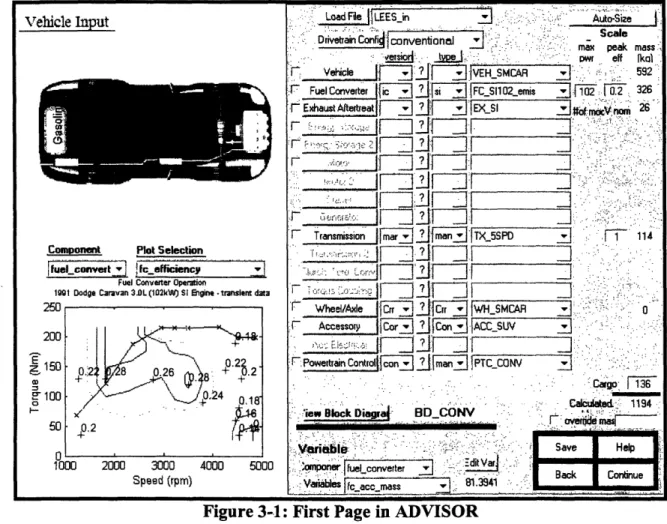
The first step in using ADVISOR in this project is to define the vehicle for which tests will pertain. Figure 3-1 is the first screen that is shown in ADVISOR. There are predefined vehicle load files that incorporate various vehicle components across different drivetrain
configurations. After careful evaluation, it was decided to define a vehicle and components that were not predefined in ADVISOR. Looking at the top center of Figure 3-1, there is a tab named 'Load File'. There, the vehicle name that was created and saved can be seen, 'LEESin'. The Drivetrain configuration is chosen to be conventional. Without going into detail, the rest of the
vehicle's components are defined below the 'Drivetrain Config' tab in Figure 3-1. The tabs are 'Vehicle', 'Fuel Converter', 'Exhaust Aftertreat', etc. The specific choices for the components are then made from the tabs and are shown to the right of the vehicle component in Figure 3-1.
Vehicle Input
Component Plot Selection
i fuel convert.T Ic fefficiency
0) 0
l-Speed (rpm)
oa: iLEESn .::. Auto-Size
-!
1 ~:; -- - - i;; -o;~ ... .. .;~ S~ CaI;:: : :Drivetrain Confifionventional $ -:-.S-ale
- . ..
n - , :-. max peak mass .
- ' -erso. " . .:. ' .. :-;-'." : .' ":-"- -".- DWr eff [kal
f- VeHcle _.. 'I-- :V':,SMCAR j:. -592
I FuelConverter [ ' siFCS 9 emis 102 , 1"0.2 326 .r Exhaust Aftetreat ? !IEX Is "26,I.
r'
'"..&.
:[|--~ I--: ....
_J;'"';:--D':-:r>:.':;:
. . .f , :.:.- .: -. .
--r;e;
-
raisi- I]~
_F
I-
_j.
;?
?m'x
I
. ..
<
; -- - -
SF
.j',
-'l
_'" ::
'.
. -- :"
-' _
....-
=;;to~7,K~
.. {....--:..i;..:.<.
.i..':':-..-
...., ,,:,:,:,.' · t1 ,,~" ' I:.: :-'-:'..'.-:, .'.,,
r:>.o.e,,,..,l:
.owettrain C ~~~oor ~.--l.
1L1V7]V~~~~~~~~~~~~rw 3
2-j . l ... _ .. f-cm, .. : ::-~ :
:
-<i
F nsmisson|- marjv iman TX_5SPD _____.C i 1 114
~~~~~.-'. -. . .,... ... ...-... ..
~~~~~. . . . _ . . .II
.::a llock D i.git. ' -....ID JF7ZiK~~~ IICOINIV ' ~ ~~~~~~~~~~~~I IIII Il I ':
,
l
.7
u_K
__.,,_Accessory IeCorzj; !I;2
ACS----'-- i:,' lisclll'
r
Powetran Control '.' 'ig1 __~~ ;;;n21|ja;;J PTC ONV :!, .i~ ]diVa ,., ... .,] -1''v "' ''''. - . - . ;: " .. -:fl~ -E.m..1a... ' -c.X~~~~~~~~~~~~~~~~~~~~~~~~~~~~~~~~~~~~~~~~~~~~~~~~~~~~~~~~~~~~~~~~~~~~~~~~~~~~~~~~~~~~~~~~~~~~~~~~~~~~~~~~~~~~~~~~~~~~gOL ed 1194 ~~~~~~~~~~~~~~~~~~~
---iw Blok Diagra-- BO CONV :: :o*er
-Var2iable :;--- ;-i ; |Sae
I
elp
tompone- [eFconvrteF] _ --: .--- . |Back ConnueI
Variables fo-mass - 81.3941
Figure 3-1: First Page in ADVISOR
In the bottom left hand corner of Figure 3-1 there is a picture of the engine performance map chosen with this vehicle configuration. The contours are of constant engine efficiency displayed in a torque-speed plane. The engine is identified above the plot as a '1991 Dodge Caravan 3.0L (102kW) SI Engine'.
ADVISOR also has the ability to define specific accessories. One tab to make note of in
Figure 3-1 is the 'Accessory' tab. There are various accessory choices throughout all of the load
Fuel Converter Operation
1991 Dodge Caravan 3.DL (102kW) SI Engine tr nsient data
I
.
files. Since most of the focus of this research will be on the accessories and their loads, it is imperative to understand their definitions and how they interact with the rest of ADVISOR.
3.1.2 Drive Cycle, Initial Conditions, and Electrical Auxiliary Loads
Once the vehicle and its components are chosen, ADVISOR then continues to the second screen. In Figure 3-2, the drive cycle, initial conditions and electrical auxiliary loads can be accessed. 10 20 30 time (sec) I Speed/Elevaton vs. Tahe J Drve bcbe I IC Timne Step 1 l ~,i] :l-i!f~%'. ? ,-i :
F Cotnt Road Grade r Itactiv SirAkc en a, a, 0 a, -1 40 650 C Description r Statistics ;TANT 60
I
50 100 Speed (km/h) 150 time: distance max speed: avg speed max accel: max decet avg accel: avg decet idle time: no. of stops: max up grade: avg up grade: max dn grade: avg dn grade: 50s 1.34 km 96.56 km/h 96.56 km/h 0 m/s"2 0 m/s"2 0 m/s^2 0 m/s^2 Os 0 0% 0% 0% 0%T_LLUN IAN I _bUJ
# of ces
rT
r cyckeF lulhple Cyles II Tet PRocedure [.2 J F Acceleration Test l Gradeability Test Acel Option"l GardecOptirns l Parametdc Study i lj | or:;L|. . '0. iE!,- _| Save I H LoadSi Set 11_1ON' .6ft Cs Bak .RUN
figure 3-2Z: Second Page of ADVISOR
The top left hand corner of Figure 3-2 shows the graph of the drive cycle that the vehicle will be tested over. The speed versus time trace that is shown is selected from a pull down menu. The drive cycle chosen for this graphic is a constant 60 mph, or 96.56 km/h, cycle for 50
ii E 50 a) o nC n I- key '-elvatlbr 100 a) 50 a,. a cyc-co c 0 E ._ inn -I III I IUU. _ _ : 0 I I
seconds with zero elevation above sea level. The x-axis of the elevation grid can be seen within
the figure at 0 meters. The key-on line is set at one, or the on position, and can also be seen in
near the bottom of the graph. Initial temperature conditions can also be set from this screen. The 'Load Hot' conditions were chosen. The engine cylinder, engine interior and exterior, hood temperature, and the exhaust system temperatures have temperature dependent models that are moved to highest initial temperatures in ADVISOR. By choosing the highest temperatures, warm-up effects on fuel consumption and engine efficiency are reduced throughout a drive cycle.
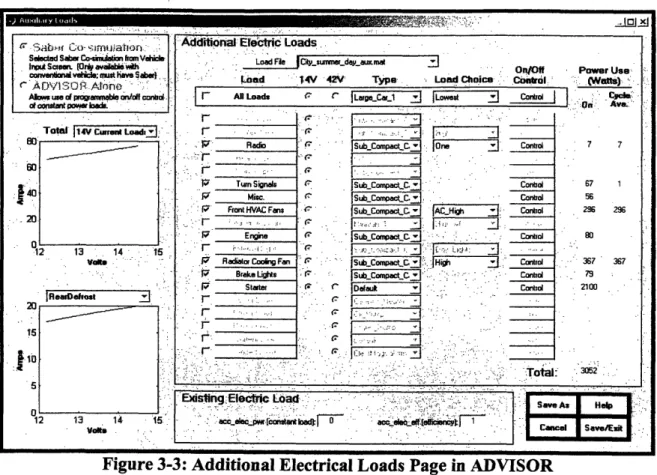
In Figure 3-2 another tab named 'Elec. Aux. Loads' can be seen. Here the user has access to a list of electrical auxiliary loads, as shown in Figure 3-3. By loading a predefined electrical auxiliary file, or creating a special purpose file, different electrical loads can be chosen to be applied during a drive cycle. The example electric auxiliary load shown in Figure 3-3 is one that was predefined by ADVISOR to simulate city summer driving during daytime conditions.
.r 3 ' . ';icq' lCo i- l To..n(:Ja Sected Saber Co.ssAtion Irom Veide
Inp Screen. t[0n vaib"lew ih
convewoenma es: h o have S abe ... .
' A.)VISOR Ane : -
-A m uterd pof a oble olf conird ...
otconstant Powr ' -
-. '. .. Total I1 4V Cuirenid Load
;-40 20 1 3 . 14 t5 20 ~~~~. -~ EO . ... ': .... .,. I1 12 13 14 - 15 ' -~~~~~. ..', 5 ~ ~~~~~ .:
:Additional Ele'ctric Loads .
---. '.. ... . ,,.., ' . -, . .' . . . ...
Loacl
.
~ ....~v~~~-~
---.
~~~~On/Off- - Lod ' 4V 42V Type Load Choice Control
r All Loads a ILaer.C-1 | Lowest Contrd |
. .. ...
.''..
'" ''-:.-"
r
.
-~
r., .. ....~~~~~~~~~~~~~,-
-
:- ---
'.
,'-.,-'.'
.-.
r .' ." -' :; · ..._-_ 1":,' q'' '. Radi o Jsub.CompactC. o j Contol
---"- r .. .. - .
"I- ~ ' TuwnSignals jSub Compact S C, . Contd
: J Misc. ¢ ISub CompacLC , -- Control
. ' ' Front HVAC Fans SubCompaLC. AC High J Control
- Engine P - ISub Compact C .: Contdrol
. Radiator Cooi Fan SbCo actC... i h Control ' Brake Lirgs ' ISub_Compact : : : Control
: r Starter (T. C Dfaul.: - Control
...
r
r
...."'-
F~~~~~
"
/
'
-.
...
'---'
, :
:,
'-::--'1:.
--:
-'
.~-,.
.
Total.-: ~ ' ~" .~ -, . c' ID: u - ": ' " :':: " 1 : ',~'
c'-'- Power . . att . . . 7 67 56 Use ~y-. Ave7. 7 1 ,~ Z96 29 80 -36 367 67 79-. 2100 .3052 :. . ·Eisting Electic Load - :
[-;
I-acceLscpwr lonie dFntr °d , ac'' S tcebt efai*e , :'tF
, . -, --. ., , .
, , ,.... ' .' . '. ... . . '
Figure 3-3: Additional Electrical Loads Page in ADVISOR
One of the benefits of these electrical choices is that the user also has control to turn on or off the electrical load throughout the drive cycle. Figure 3-4 shows a front defroster on/off profile. It shows that the defroster is initially on and then is shut off at 200 seconds, turned back
on at 300 seconds and then turned back off again at 600 seconds. This gives the user the
flexibility to start an electrical load initially off and then turn on the electrical load at any time in the drive cycle to study the loading effects.
MUM* .i11 1 U | _W2., -; -| I : '' 11 -i, , . .. ,,,,, _ , , , 1 = r I I II I III I II II I II I I II I . __F . . .. ....- ,-. .. 1. t...--- ..-. . .. i
Figure 3-4: Front Defroster On/Off Profile
This software tool is used to assist in finding the fuel economy benefits of changes in the vehicle electrical system. ADVISOR uses the engine performance map and the alternator performance data described above. ADVISOR defines the engine, transmission, auxiliary loads, and the exhaust system among others. Initial temperature conditions can be set for the vehicle's engine, cylinder, hood, and several other front end engine parts. The instantaneous vehicle engine outputs of torque, engine speed, and efficiency will be evaluated using ADVISOR's outputs, during a chosen time within a drive cycle. Alternator efficiency, engine energy efficiencies and changes in fuel consumption can and will be evaluated over different constant speed drive cycles. More closely, the incremental changes in engine efficiency as well as
incremental changes in fuel consumption will be studied with the addition of a load to the engine during the drive cycle.
:1''5...-. -~~~.t~~~~~.'~-~~~~ ) ';. : ... so r. 1--':-f~.~2~ '-,. " . ="RPW-~::.," -i-E l fig
~~~~~~~~~~~~~&
p-- 20030605
"S
4
4t*- A0
~~-4Ti~~~t-~~~~yS.4 ~~~~ Sack own
' E~~ ~ f'~'""'t-"E:~ ~ '' ' '~ a -??' e?-: s-'n.... ' ... ... '...i .. -~~"'-:
I NW.Romm H
The primary goal of doing a detailed examination of the combined effects of the engine and electrical system is to understand the incremental improvements in efficiency that can be gained using different electrical systems and loads. The first step in this direction is to understand how energy consumption (or efficiency) changes in response to a single electrical load being placed on the system. The results of the tests, conclusions, and future work will be discussed.
3.2 Engine Performance Map
The true details of the engine's fuel efficiency can be captured with an engine performance map, the automotive standard for describing an engine's fuel consumption vs. engine speed and torque. The map is a function that specifies brake specific fuel consumption or engine efficiency for a given input of torque and speed. The function used throughout the
research is displayed with engine speed (rad/sec) as the horizontal axis, torque (Nm) as the vertical axis, and engine efficiency contours (%) that correspond to a speed and torque. ADVISOR has pre-installed engine performance maps, consisting of tabulated data and interpolation functions for arguments between data points in the form of Matlab files. The ADVISOR table for a typical engine performance map is sparse. It is in the form of a 9 x 15 matrix covering the approximate range of 900 to 5700 rpms. For this work, a new engine performance map, with a matrix of 20 x 25, was developed from industry supplied data. The industry map was used because it covered a wider range of data points. The industry data gave a denser map with more credible data. The matrix, however, was not a complete 20 by 25 matrix. Linear interpolation was used to fill in the blanks. This raised questions about the credibility of
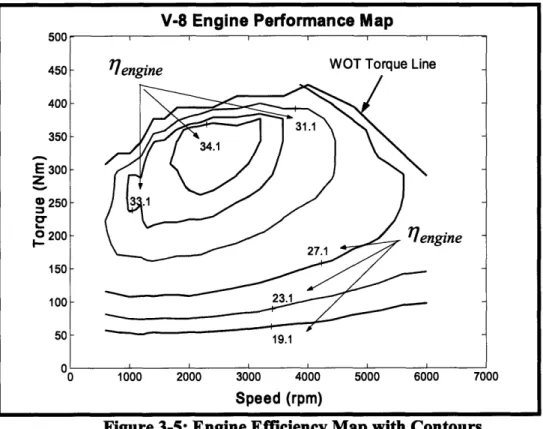
The engine performance map in Figure 3-5, used throughout the study, corresponds to a V-8 engine. Therefore, throughout the test runs in ADVISOR, a sport utility vehicle frame was used to simulate a larger automobile.
Figure 3-5: Engine Efficiency Map with Contours
The brake specific fuel consumption data points for the 20 by 25 engine map matrix have been converted to efficiency points using Equation 3-1.
7=
bsfcQLbsfc *QL~v
Equation 3-1Bsfc is the brake specific fuel consumption and QLHV is the lowering heating value of the fuel, in this case gasoline. The efficiency points thus calculated have been used to generate the constant-efficiency contours shown in Figure 3-5. The numbers written next to the contours are the corresponding efficiencies. The solid black line at the top of the graph is not an
iso-enIine WOT Torque LineI I
17pnoine ~~WOT Torque Line
V-8 Engine Performance Map
OUU 450 400 350 E 300
z
250 I.. i0 200 150 100 50 n )00 0 1000 2000 3000 4000 5000 6000 7( Speed (rpm) I I I I I I-efficiency line, but is the wide open throttle (WOT) torque-speed function. A sample of the tabular data can be found in Table A-2 in the Appendix. The contour plotting utility used to generate Figure 3-5 is an ADVISOR function. Much of the kinkiness of the curves is attributable to the discrete tabular nature of the raw data.
Brake specific fuel consumption numbers were not supplied for all of the engine rpms and torques. A linear interpolation in bsfc was used to fill the grid where the numbers where absent. It is possible, however, that the behavior of bsfc between the end points of interpolation is not linear. Note from Equation 3-1 that efficiency and bsfc are inversely related. As a result, linear interpolation on bsfc followed by conversion to efficiency produce a different result from linear interpolation in efficiency. A more detailed explanation is found in the Appendix on page 84. All torques and engine speeds fell within the range of brake specific fuel consumption data, therefore, no extrapolation was needed.
3.3
Alternator Efficiency Data
An alternator efficiency map is used to determine how much mechanical input power is needed to produce a given electrical output. Alternator efficiencies vary with the operating conditions of the alternator. A graph of an alternator efficiency map is shown in Figure 3-6.
Figure 3-6: Alternator Efficiencies at Alternator Output Loads and Engine Speeds Figure 3-6 is an approximation of a figure from the Bosch handbook [12]. The figure is used to create a matrix that is used within ADVISOR to find mechanical input from the engine to the alternator at the various alternator output loads and engine speeds. This data replaced an
existing alternator file in ADVISOR that was used primarily for large trucks. Figure 3-6
indicates alternator efficiency as a function of engine speed (x-axis) and load (y-axis). The four curves in the graph represent power levels of 25, 50, 75, and 100% of the maximum alternator load. There is also a fifth curve that is not shown on the graph and that is the 0% of maximum load line. This is the x-axis. The two digit number adjacent to each discrete load point is the efficiency at that point. Iso-efficiency contours are not plotted in Figure 3-6. However, the reader can visualize what they may look like from the numbers shown here.
Alternator efficiency is related to mechanical input to the alternator through Equation
3-2:
Alternator Efficiencies at Alternator Output Loads
and Engine Speeds
1.8 1.6 1.2 1 ,0.8
0.6
0.4 0.2 0 0 1000 2000 3000 4000 5000 Engine RPMsAlternator Output
Mechanical Input = Alternator Equation 3-2
Alternator Efficiency
At zero alternator output the efficiency is zero percent, however, it is important to note that there are still losses, and therefore mechanical loads, at these points. This means at zero alternator output the alternator is still pulling a load from the engine shaft. The alternator losses at zero output correspond to mechanical and iron losses of the alternator and are a function of alternator speed. The alternator losses at zero output were found using information from the Bosch Handbook [12]. Total losses were predicted at the 25% maximum output line and were divided into two parts: the losses due to alternator speed and the losses due to electrical load. The losses due to electric load were extrapolated from a trend-line created in an EXCEL spreadsheet. These loads were subtracted from the losses at 25% maximum outputs. The remaining number was used as the power drawn from the engine shaft by the alternator at zero electrical output at each corresponding alternator speed.
3.4 Methods - Energy Balance and Efficiencies
3.4.1 Energy Balance
To see the details of the engine/alternator system, start with the energy balance deduced from Figure 3-7.
control volume
~~~~~Fuel EnginePropulsion in Torque
Engine
@RPM Torque 1 l Alternator
Alternator Output
Engine Losses Alternator Losses
Figure 3-7: Engine Alternator System used for Energy Balance
The control volume above in Figure 3-7 includes the engine and alternator system. For that analysis, assume that losses for any other accessories attached to the engine, except the alternator, are included in engine losses. The engine losses consist of the thermodynamic losses, pumping losses, and the accessory work, other than the alternator, throughout the system.
Alternator losses are due to running the alternator fan and bearings, belt slippage, iron losses, copper losses and diode losses. On the left side of the control volume, the fuel enters the system. The fuel and air enter the engine at a rate consistent with the engine speed and throttle conditions
and air to fuel ratio. The fuel enters the cylinders and is then combusted with the air. This is a
change from chemical to thermal energy. The hot gases push down on the pistons, creating linear mechanical energy. The linear mechanical energy is then converted into rotational mechanical energy via the rods attached on one end to the piston and on the other, the engine shaft. The volume of fuel-air mix influences the downward pressure on the pistons and the corresponding torque. The engine speed and vehicle speed are related by the transmission. In steady driving, the engine torque is just enough to overcome drag and hill climbing loads. If more or less torque is produced, the vehicle accelerates or decelerates. The engine shaft provides torque to the transmission, driveshaft, and ultimately to the drive wheels. The torque out of the
The alternator is connected to the engine shaft via a belt. In this scenario, when an alternator load is needed, some of the engine torque is used in rotating the alternator shaft to produce electrical energy. In summary, the mechanical torque to the alternator is converted to electrical energy via the alternator at some efficiency. The sum of the propulsion torque and alternator torque multiplied by the engine speed is equal to what is called the "brake power". The brake power is the useful work out of the engine.
It was first decided to look at an energy balance at constant vehicle speed. The results from ADVISOR of fuel flow rate, engine torque, and engine speed were first recorded with zero alternator output. Once the data for the base case is recorded, the alternator output was increased by 100 Watt increments while keeping the vehicle speed constant at 30mph. The change in fuel
flow rate and engine torque can then be determined using ADVISOR. The engine speed will stay constant for constant vehicle speed. By multiplying the engine torque and engine speed the brake power can be calculated.
Figure 3-8 shows a representative power balance for an engine/alternator system
operating at constant traction power. The y-axis is the fuel power into the engine. The x-axis is the alternator output from 0 to 1200 Watts. The vehicle stays at constant speed of 30 miles per hour throughout the changing of alternator output. One thing to note here is the large
thermodynamic losses from the engine. From the representation we can measure efficiencies of the system. From this figure, it is not obvious that the influence of small changes in the sub-systems can be easily seen with this representation.
Figure 3-8: Power Balance at 30mph; 0-1200 Alternator Output
Zooming in on Figure 3-8, Figure 3-9 is graphed. It is noted that there is in fact some "fine structure" to the engine performance that suggests that there are some local effects that would influence our perception of how to most efficiently run or design this system. This is most visibly seen at the inflection in alternator losses at 1000 watts in this figure. There are also other local effects that are not easily visible in this graphical representation. The propulsion power is constant by definition. The alternator output is by definition at a 1 to 1 ratio to the corresponding input power. This means that for this graph, for each 100 Watts of power output by the alternator, the corresponding input line is 100 Watts higher. The slope of the alternator output line is constant. The alternator inefficiencies are shown in the alternator losses line, still in mechanical watts. The engine losses line in Figure 3-8 goes up more steeply than any other.
Power In vs. Alternator Output
40
.35
e0 X 30-25
c 20 15 10 5 10 5Srn Ieso IIForidVnc~ r4ti
0
0 100 200 300 400 500 600 700 800 900 1000 1100 1200
Alternator Output (Watts)
A
Since the propulsion power is constant, all the changes in engine losses arise from the alternator load.
Figure 3-9: Zooming of Figure 3-8's Power Balance at 30 mph
3.4.2 Gross System Efficiency
One possible metric that can be used to characterize performance is gross system efficiency- usable power out divided by fuel power in as given by Equation 3-3.
Power Out
7
7gross Power In Equation 3-3
The system consists of the engine/alternator with fuel power into the system. Some of that fuel power is converted into propulsion torque to maintain constant speed at a corresponding
Power In vs. Alternator Output
8
(7
0 ._6
0 100 200 300 400 500 600 700 800 900 1000 1100 1200engine RPM. The rest of the torque goes to the alternator to produce electrical output. The power to the alternator is transferred to alternator output at the alternator efficiency. The power out to power in ratio then reduces to Equation 3-4.
(Torquepop * ) + Torquealt.
* co*
lalt.9rmss
L
Equation 3-4\1 ~ mr*QL.v
The torque for propulsion is seen as the dominant torque. Therefore, the gross system efficiency will be dominated by the torque that goes to propulsion. Equation 3-4 will not help in identifying the effects of small changes in the electrical system designs.
The computer simulation model was first validated as described in the Appendix. It then became possible to run simulations of system performance, and to calculate and compare the different indicators of system performance. Figure 3-10 is a gross efficiency bar chart detailing the evaluation of operation at 400 Watts of electrical output with a constant vehicle speed of 30mph.
35 .i0 30-25 0 ' 20 -L 15 4) L 10 0. 5
0-Gross Efficiency Defined at 400 Watts of Alternator Output
N
Propulsion + Alternator Output
Total Power In
5473 + 400(Watts)
i gross -38063 (Watts)
7tgross
= 15.4%
ulsion + nator Output 400 Watts Alternator OutputFigure 3-10: Gross Efficiency Example Calculation
This is a slice of the graph from Figure 3-8. This slice was taken at the 400 Watt mark of alternator output. The gross efficiency is defined from Equation 3-4, as the propulsion power plus the alternator output power divided by the total power of the fuel into the engine/alternator system. Adding them up and dividing, an efficiency of 15.4% is found for the gross efficiency of the operating state with 400 Watts of electrical power output from the alternator. As mentioned before we can see that the alternator output of 400 Watts is only a small fraction of the
propulsion power. Therefore, this is not a good indicator of the efficiency of the next Watt of electrical output. Figure 3-10 is used as an illustration of this efficiency and why it is described as not useful in determining the efficiencies from changes in the electrical system.
3.4.3
Electrical Generation Efficiency
Using the same system as before, another focus might be upon the efficiency with which electrical energy is generated. The electrical power generated per unit of fuel consumption
devoted to electricity generation might be defined by the Equation 3-5. Figure 3-11 and
Equation 3-5 describe this efficiency metric. Implicit in this definition is the assumption that the engine produces propulsion power and alternator drive power with exactly the same efficiency. Equivalently, the equation assumes that engine fuel flow can be divided between the propulsion and alternator drive functions in proportion to their respective torques.
I I
Fuel in , Propulsion Torque
.TorqueA Electric Power
Tirquez lternator Out
Figure 3-11: Electrical Generation Efficiency Control Volume
Figure 3-1 1: Electrical Generation Efficiency Control Volume
=
17
engine * '7 alt. Equation 3-5The electrical generation efficiency is defined by the multiplication of the engine and alternator efficiencies. After substitution the Equation 3-5 breaks down to:
(Torquepop. + Torquealt) * *
rAlternator
Output/7elec.gen. = '
nx mf*QL-ImfQLHV Torquealt *co
11. Equation 3-6 Rearranging,
Alternator Output
'1
elec'gen'
-e
oqeat.Euto
m fQLHVTotal Torque
The ratio of the torques in the denominator provides the same problem as with the gross system efficiency. The torque to the alternator is very, very small compared to the total torque.
-7 7 elec.gen.
efficiency metric. Neither the engine nor the alternator act linearly. This means that the ratio of torques in the denominator does not accurately describe the engine/alternator system. Other
factors such as engine speed and alternator speed will have an effect on the torque ratio even at the same alternator output. The complexities of the engine/alternator power system could mean that this metric is a poor indicator of the consequences of incremental changes in the vehicle power conversion system as well as over a typical drive cycle. When looking at changes to the
system, this equation falls apart. We only know the efficiency of the entire engine, not the part that goes to the alternator, which is the part needed to clearly state the efficiency. Figure 3-12 is a demonstration of this issue.
Fuel in
for
Prop.
Engine
_
Propulsion
|-_ _lR21 _ _ .
Torque
_ _ _
l
Alternator
Alternator
Fuel in IOutput
for Alt.
L
- - - IOutput
Figure 3-12: Demonstration of What is Needed
The fuel in is thought of as two streams, even though it is only one. The first stream is the amount of fuel used for propulsion while the other stream is fuel input used for alternator output only. In this thought experiment, there are two unknown quantities. There are only arbitrary means of allocating the fuel between these two uses.
Figure 3-13 presents the same bar chart as Figure 3-10. In Figure 3-13, the quantities used to evaluate efficiency from Equation 3-5 are explicitly illustrated. The same slice is used to demonstrate the electrical generation efficiency, seen in Figure 3-13. The electrical generation
efficiency is a poor indicator of changes in the electrical system because: 1) the huge heat losses are included in this calculation dominating any changes in electrical output and, 2) the arbitrary assignment of fuel flow into the system is linear.
en
r.
3 0L
Electrical Generation Efficiency Defined at 400
Watts of Alternator Output
. 1I~ 7elec.gen. = l7engine 1 alt.
-. .
...- Propulsion+ Alternator Output + Alternator Losses
~
-Total
7
~lengine
Power
In
... AlternatorOutput
ait. = AltemrnatorOutput+ AlternatorLosses
i
7elec.gen
.3%
'-tts Alternator Output
Figure 3-13: Electrical Generation Efficiency Calculation
Therefore, there is a formal need to consider marginal or incremental changes in the system. The desire is to define what the consequences of small changes in engine and alternator loads are. Do local effects have any domination on the system?
3.4.4 Incremental Efficiency
Using the same control volume as before, the incremental efficiency is illustrated in Figure 3-14.
,onstant
lsion Torque
*AIternator Output
Figure 3-14: Incremental Efficiency Illustration
AAltemrnator Output
7llncrem. =
A mf*
QLHV
Equation 3-8
The incremental efficiency is used to demonstrate a change to the electrical system. The incremental efficiency metric cannot be used when the system is in a static state. This metric is useful when comparing changes to the electrical system at a fixed propulsion torque. This metric incorporates the static differences in operation of both the alternator and engine between two points. This is the important factor. One operating point is at one alternator output and vehicle speed and the other is at a different alternator output at the same vehicle speed. The definition in Equation 3-8 can be applied at any difference in alternator output. But the concept is most useful when the difference is small. In the limit,
1 aPalt.
7Increm. QH
aEa
QLHV
a
mf
where Palt. is the alternator output.
The incremental alternator efficiency can also be expressed as in Equation 3-10,
AElectrical Load
incr. alt. -
Engine Speed
*(ATorque)
Equation 3-10
FI
The increment of mechanical power is expressed as a change of torque at constant speed because engine speed is determined by the primary function of propelling the vehicle. Therefore,
the torque to the alternator will increase according to the alternator efficiency. Rather than use ADVISOR to check the incremental alternator efficiency at every Watt, the incremental
alternator efficiencies were evaluated for each additional 100 Watts of electrical power from 0 to 1200 Watts. An average of the previous 100 Watt incremental efficiency and the next 100 Watt incremental efficiency was used to define the incremental efficiency at the 100 Watt electrical load interval.
The incremental mechanical power needed to supply any change in electrical power will be more than the electrical power due to alternator inefficiencies. In order to supply this needed power to the alternator, more fuel will be needed. The incremental efficiency of the engine is
defined by Equation 3-11,
Engine Speed
*
(ATorque)
Equation 3-117incr.engine *
QLHV
*(Amf)
The engine speed will stay constant. The change in torque will be the same that was used to calculate the alternator incremental efficiency. QLHV is the lower heating value of the fuel,
gasoline. The lower heating value used for the calculations is 42.6MJ/kg. Amf is the change in fuel flow rate that is needed to supply the change in torque that is needed for the alternator to produce the one additional Watt of electric power.
Total incremental efficiency is the product of the engine incremental efficiency and the alternator incremental efficiency.
![Figure 1-1: Projected Automotive Electric Power Requirements [2]](https://thumb-eu.123doks.com/thumbv2/123doknet/14756906.583021/10.918.182.743.379.795/figure-projected-automotive-electric-power-requirements.webp)
![Figure 1-2: Energy Balance of entire automobile [8]](https://thumb-eu.123doks.com/thumbv2/123doknet/14756906.583021/14.918.190.728.110.606/figure-energy-balance-of-entire-automobile.webp)


![Figure 3-6: Alternator Efficiencies at Alternator Output Loads and Engine Speeds Figure 3-6 is an approximation of a figure from the Bosch handbook [12]](https://thumb-eu.123doks.com/thumbv2/123doknet/14756906.583021/34.918.181.749.108.528/figure-alternator-efficiencies-alternator-output-engine-approximation-handbook.webp)