HAL Id: insu-01828947
https://hal-insu.archives-ouvertes.fr/insu-01828947
Submitted on 3 Jul 2018
HAL is a multi-disciplinary open access
archive for the deposit and dissemination of
sci-entific research documents, whether they are
pub-lished or not. The documents may come from
teaching and research institutions in France or
abroad, or from public or private research centers.
L’archive ouverte pluridisciplinaire HAL, est
destinée au dépôt et à la diffusion de documents
scientifiques de niveau recherche, publiés ou non,
émanant des établissements d’enseignement et de
recherche français ou étrangers, des laboratoires
publics ou privés.
Somali Basin: Insights From Long-offset Reflection
Seismic Data
Daniel Sauter, Jean Ringenbach, Mathilde Cannat, Thomas Maurin, Gianreto
Manatschal, Ken Mcdermott
To cite this version:
Daniel Sauter, Jean Ringenbach, Mathilde Cannat, Thomas Maurin, Gianreto Manatschal, et al..
Intraplate Deformation of Oceanic Crust in the West Somali Basin: Insights From Long-offset
Re-flection Seismic Data. Tectonics, American Geophysical Union (AGU), 2018, 37 (2), pp.588-603.
�10.1002/2017TC004700�. �insu-01828947�
Intraplate Deformation of Oceanic Crust in the West
Somali Basin: Insights From Long-offset
Reflection Seismic Data
Daniel Sauter1 , Jean Claude Ringenbach2, Mathilde Cannat3 , Thomas Maurin2, Gianreto Manatschal1 , and Ken G. McDermott4
1
Institut de Physique du Globe de Strasbourg, CNRS UMR 7516, Strasbourg, France,2TOTAL SA, CSTJF, Pau, France,3Institut de Physique du Globe de Paris, CNRS UMR 7154, Paris, France,4ION, Chertsey, UK
Abstract
Interpretation of new high-resolution seismic reflection sections reveals intraplate deformation of oceanic crust in the West Somali Basin, between the East Africa margin and the Davie Ridge and its northern extension. The deformation of the oceanic crust takes the form of 1–2 km amplitude buckle folds with a 20–30 km wavelength associated with thrust faults. Reverse faulting is localized along deformation corridors, about 15–30 km wide that we interpret as inherited oceanic fracture zones of the extinct oceanic spreading center. Deformation of the oceanic crust in the westernmost segment started before Hauterivian time (~132 Ma), while oceanic accretion was ongoing to the east of the Davie Ridge, and stopped at Aptian time (~120 Ma), when spreading ceased in the whole Somali Basin. Prior to the deformation of the oceanic crust, large volcanic edifices have been emplaced on top of the oceanic crust along preexisting oceanic fracture zones. Well-defined groups of reflectors, within the mantle (<~20 km below top basement), are interpreted as large shear zones that tapped a connection to deep lithospheric melt channels leading to magmatic intrusions within the crust and emplacement of postseafloor-spreading volcanic edifices within deformation corridors.1. Introduction
Because old oceanic lithosphere is strong relative to continental lithosphere, there is thought to be little deformation in the oceanic domain away from plate boundaries (Vauchez et al., 1998). However, intraplate deformation within the oceanic domain does occur. Such deformation is mainly documented in oceanic crust in convergent settings. The Central Indian Basin is the best documented example (Bull, Martinod, & Davy, 1992; Carton et al., 2014; Delescluse, Montési, & Chamot-Rooke, 2008). There, intraplate deformation is observed at two spatial scales. Long-wavelength (~200 km) deformation is expressed as lithospheric scale folds of amplitude up to 2 km (Weissel et al., 1980). These folds are observed as E-W trending anomalies in satellite-derived gravity data (McAdoo & Sandwell, 1985) as well as in long seismic reflection profiles (Weissel et al., 1980). This long-wavelength deformation is thought to be produced by buckling of thick ocea-nic lithosphere (Zuber, 1987). Shorter wavelength deformation is caused by reverse faulting that is observed to cut through the basement and sediment cover (Chamot-Rooke et al., 1993; Delescluse et al., 2008). These reverse faults are at high angles and interpreted to have resulted from the reactivation of preexisting normal faults originally formed during Lower Cretaceous seafloor spreading (Bull & Scrutton, 1990; Montési & Zuber, 2003). It is suggested that this deformation occurred in response to convergence between the Indian and Capricorn plates in a wide diffuse plate boundary (DeMets & Royer, 2003; Royer & Gordon, 1997). Clear evidence for smaller scale buckling (<100 km wavelength) of ocean crust has not yet been reported, either in old basins or in young oceanic crust.
Here we document buckling and reverse faulting of oceanic crust in the West Somali Basin (WSB) offshore eastern Africa through the interpretation of high-quality long-offset seismic reflection profiles collected by ION from 2007 to 2012. We describe the nature of the basement and the style and timing of the deformation. We then discuss the broader tectonic context of the observed intraplate deformation highlighting the impor-tance of structural inheriimpor-tance from early seafloor spreading in the WSB.
2. Geological Background
Seafloor spreading began in the WSB in Middle Late Jurassic time, separating Madagascar and India from Africa (Davis et al., 2016; Geiger et al., 2004; Phethean et al., 2016; Seton et al., 2012) (Figure 1). The oldest magnetic
Tectonics
RESEARCH ARTICLE
10.1002/2017TC004700
Key Points:
• Buckling and reverse faulting are observed within oceanic crust in the West Somali Basin
• Deformation of the oceanic crust started before Hauterivian time (~132 Ma) and stopped at Aptian time (~120 Ma)
• Postseafloor-spreading volcanic edifices have been emplaced on top of the oceanic crust prior to its deformation
Correspondence to:
D. Sauter,
daniel.sauter@unistra.fr
Citation:
Sauter, D., Ringenbach, J. C., Cannat, M., Maurin, T., Manatschal, G., &
McDermott, K. G. (2018). Intraplate deformation of oceanic crust in the West Somali Basin: Insights from long-offset reflection seismic data. Tectonics, 37, 588–603. https://doi.org/ 10.1002/2017TC004700
Received 20 JUN 2017 Accepted 26 JAN 2018
Accepted article online 29 JAN 2018 Published online 17 FEB 2018
©2018. American Geophysical Union. All Rights Reserved.
anomalies identified in the WSB are M22–M24 (150–155 Ma) (Cochran, 1988; Davis et al., 2016; Ségoufin & Patriat, 1980), but spreading may have begun earlier, 170–160 Ma ago (e.g., Geiger et al., 2004). Spreading was slow to intermediate (25–60 km/Myr full-spreading rate) and ceased around M0 time (Aptian) (e.g., Davis et al., 2016; Ségoufin & Patriat, 1980). The location of the spreading axisfirst derived from seis-mic, gravity, and magnetic data in the 80s (Cochran, 1988) has been confirmed by satellite-derived, free-air gravity data (Davis et al., 2016; Phethean et al., 2016; Sauter et al., 2016). Spreading was directed N-S before the extinction, but a NNW-SSE direction is inferred from gravity lineaments in the older oceanic crust fabric close to the Somalian mar-gin (Figure 1) (Davis et al., 2016; Gaina et al., 2015; Phethean et al., 2016; Seton et al., 2012). The age of this change of spreading direction is esti-mated to be 155–150 Ma in the WSB (Davis et al., 2016; Phethean et al., 2016; Reeves et al., 2016).
Here we focus on the westernmost part of the WSB between 5 and 10°S. Our study area is bounded to the west by the Sea Gap Ridge (Reeves et al., 2016) and the Tanzanian continental margin and to the southeast by the Davie Ridge and the northern end of the Kerimbas Graben, a seaward extension of the East African Rift System (Franke et al., 2015; Mougenot et al., 1986) (Figure 1). The Davie Ridge is inferred to be the bathymetric expression of the transform fault that accommodated the southward motion of Madagascar relative to Africa (Scrutton, 1978). It is thought to have been reactivated several times from the Late Cretaceous up to present time (Mascle et al., 1987). The gravity map shows that the Davie Ridge s.s. ends at 8°540S, but a northern extension of the Davie Ridge has been inferred up to the Wallu Ridge offshore Kenya by Rabinowitz et al. (1983) (Figure 1). However, seismic reflection data do not show evidence for the presence of a major transform fault along this gravity anomaly (Klimke & Franke, 2016). The Davie Ridge has long been considered as the western limit of the oceanic domain in the WSB (e.g., Cochran, 1988; Coffin & Rabinowitz, 1987). However, Sauter et al. (2016) and Reeves et al. (2016) have recently proposed, based on seismic data, that oceanic crust does occur to the west of 41°300E off-shore Tanzania. The location of the extinct spreading axis in the wes-ternmost part of the WSB has been inferred from both seismic data and gravity data (Sauter et al., 2016). However, magnetic data are lack-ing to corroborate this location and to determine the age of the most recent oceanic crust there.
3. Data and Method
3.1. Seismic Data
The reflection seismic profiles presented here were acquired by ION as part of their East AfricaSPAN™program (www.iongeo.com/Data_Library/). The reflection seismic source was an air gun array with a total volume of ~6,000 cubic inch, which wasfired at regular ~50 m intervals with a vessel speed of ~5 knots. Seismic signals were recorded with a single ~10 km long streamer. The record length was ~18 ms with a sampling rate of 2 ms. Data were processed and conditioned through several iterations of ION’s proprietary processing and imagingflows to produce the final time migrated sections (see Sauter et al. (2016) for more details about the data collection and processing).
Thirty-six seismic reflection profiles (ION BasinSPAN lines; Figure 2) were used to determine the nature of the basement in the westernmost WSB and to document its deformation. Six seismic profiles, numbered AA0to FF0, were selected for detailed illustration of the basement structure.
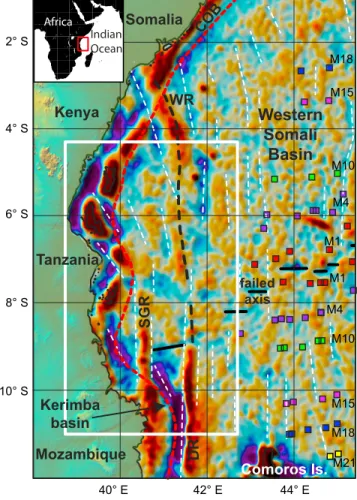
Figure 1. Map of the westernmost part of the West Somali Basin. The black line indicates the extinct ridge axis (Sauter et al., 2016). The red dashed line shows the continent ocean boundary after Ségoufin et al. (2004). The background image is the 2 min gravity anomaly grid downward continued onto the seafloor of Whittaker et al. (2008), based on Sandwell and Smith (2005). Overlain on the gravity data are our interpretations of the paleo spreading directions shown by gravity lineaments (dashed white lines). Magnetic picks are from Davis et al. (2016). DR: Davie Ridge. The dashed black line north of 8°540S indicates the northern extension of the Davie Ridge inferred by Rabinowitz et al. (1983). SGR: Sea Gap Ridge (Reeves et al., 2016). WR: Walu Ridge (Cruciani & Barchi, 2016). The white frame indicates the study area shown in Figure 2.
3.2. Calibrated Seismic Facies
Numerous exploration wells provide a relatively well-defined stratigra-phy of the Late Mesozoic to recent sediments in the Kenyan margin (e.g., Cruciani & Barchi, 2016). The detailed stratigraphic framework offshore Tanzania will not be discussed here. We will use mainly two reference stratigraphic levels: the Hauterivian and Aptian horizons. An exploration well, drilled to the east of the Wallu Ridge, allows the dee-pest calibration (Figure 3). It ended in the Hauterivian, in a characteristic highly reflective package that extends and thins over the oceanic domain of the westernmost WSB. The top of this package marks the Hauterivian horizon (132 Ma) in the seismic profiles (Figure 3). The Lower Cretaceous sequence is then composed by silici-clastic turbiditic beds incased in basinal shales. Some of these beds are marking the Early Aptian horizon (120 Ma, Figure 3). The Upper Cretaceous sequence is characterized by a thick silici-clastic turbiditic unit devel-oped on top of Cenomanian basinal shales. The top of this shaly forma-tion marks the Campanian unconformity (75 Ma, Figure 3). A regional unconformity is also observed at the base of the Tertiary. The deeper marker (Oxfordian) is not calibrated by this exploration well. A dense network of nonacademic high-quality seismic profiles alongside the Tanzanian margin allows following confidently these calibrated hori-zons up to our survey area.
3.3. Intrabasement Reflections
Here we summarize the observations published by Sauter et al. (2016) on seismic section AA0(located in Figures 2 and 4) to illustrate several groups of laterally coherent strong seismic reflections beneath the top basement. The profile runs NNW-SSE and cuts the Davie Ridge on strike in the southern end of the section. Sauter et al. (2016) defined four main groups of reflections, which are imaged down to at least 16 s two-way travel time (TWTT; ~30 km) within the mantle.
The top basement, either smooth or rough, is observed at 7–8 s TWTT (~8–10 km below sea level) outside the Davie Ridge. The smooth top basement is interpreted as a volcanic surface with local onlaps of sediments on small volcanic edifices indicating passive infill. The rougher parts of the top basement show large normal faults associated with rotated blocks that bear numerous alternating strong and weak reflectors interpreted as a volcano-sedimentary (VS in Figure 4) sequence by Sauter et al. (2016). This sequence is either parallel or exhibits a fanned stratigraphic layering. The Hauterivian unconformity is the oldest reference level found at the base of the up to ~5 s TWTT thick sediment pile.
Below top basement, the shallowest reflectors (R1), between 10 and 9 s TWTT, floor an upper unit U1 that is almost transparent. This unit U1 has been interpreted as the oceanic crust, up to ~2.5 s TWTT thick and decreasing to 1.5 s TWTT southward (8 to 5 km respectively assuming a 6.5 km/s crustal velocity) (Sauter et al., 2016). Below R1, a lower unit (U2) is defined by a set of discontinuous reflectors (R2) with contrasting relief and reflectivity. The strength of the R2 group of reflectors weakens progressively southward. Unit U2 is ~1 s TWTT thick on average (~3 km assuming a 6.5 km/s crustal velocity). Unlike U1, unit U2 is not transparent and includes many short chaotic reflectors. It has been interpreted as marking a fossil melt-rich crust-mantle transition zone (Sauter et al., 2016).
The R3 and R4 group of reflectors are located fully within the mantle. The R3 group is seen on each side of the inferred paleo ridge axis. R4 is defined by a group of strong reflectors, over a thickness of up to 0.75 s TWTT (~3 km assuming an 8 km/s mantle velocity). R4 and R3 are separated by only a 0.5 s vertical offset at 230 km distance. The R4 group of reflectors shallows toward the interpreted extinct ridge axis. It was suggested that R4 may result from frozen melt bodies representing relicts of a paleo melt channel system located at the base of the lithosphere and feeding the ridge axis (Sauter et al., 2016).
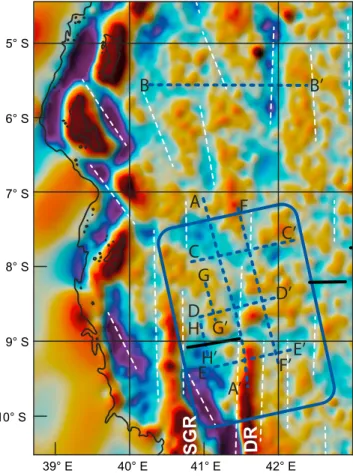
Figure 2. Location of the MSC profiles used in this study. The dark blue dashed lines indicate the profiles shown in Figures 4–9 and 11. The blue frame indicates the area where the 36 long-offset seismic reflection profiles that were used in this study are located. Background image as in Figure 1.
Hereafter we show that most of these reflectors are also present in seismic profiles from 5 to 10°S and that these profiles show evidence for intraplate deformation.
4. Seismic Interpretation of Representative Pro
files
4.1. Profile BB0
The highly reflective top basement in this E-W trending profile (see Figure 2 for location) is smooth at a kilometric scale: No small scale fault-ing is observed. However, large-scale undulations with a 20–30 km wavelength and as much as 2 s TWTT (~3 km) amplitude are observed (Figures 5 and 6). The top basement relief is mimicked at depth by a group of reflectors (interpreted as equivalent to the R1 group in section AA0) at 9–10 s TWTT. R1 is locally underlain by an up to 1 s thick sequence of laterally discontinuous reflectors. Unit U1 is ~2 s TWTT thick (~6.5 km) and exhibits an overall more transparent seismic texture than the underlying basement unit. R1 is not clearly observed in the westernmost part of the profile. There, over up to ~200 km distance, a complex distribution of strong reflectors is observed in the upper part of the basement. Reverse faults associated with asymmetrical folds cut both the top basement and R1. The biggest fault cuts the whole U1 at ~200 km distance (Figure 5). It is an east-verging thrust, likely steep, associated with an asymmetric anticline (Figure 6). A more recent small offset normal fault that extends into the sedimentary cover tips on the folds short forelimb. The reverse fault activity is recorded by onlaps, sedimentary wedges, and erosion below the Aptian unconformity (Figure 6). Two other thrusts, verging west and associated with large wavelength folds of Unit U1 and a faulted top basement, are seen at 275 and 325 km distance (Figure 5). Some other long wavelength folds (e.g., at 225 km) are not associated with thrusts. All the folds and thrusts are sealed by the Aptian unconfor-mity. Younger mild folding in the sedimentary pile is interpreted as compaction related folding. The top base-ment is deepest at 310 km distance, where it corresponds to an N-S trending gravity low (Figure 2). The Aptian horizon lies close to the top of the basement in the easternmost part of the section, while Upper Jurassic sediments are inferred in the westernmost part.
4.2. Profile CC0
Profile CC0crosses profile AA0at 183 km distance (7°520S) almost perpendicular to the NNW-SSE trending gravity lineaments (Figure 2). Similar to profile BB0, small-scale normal faulting is not observed at the top
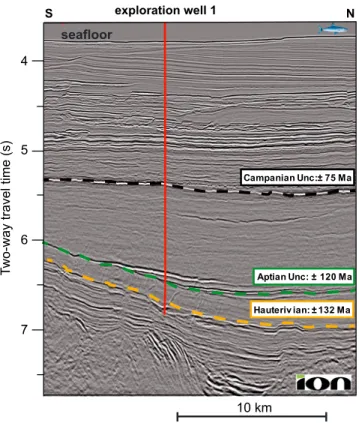
Figure 3. Seismic section showing the Campanian (not used here), Aptian, and Hauterivian horizons. These three reference levels are calibrated using the lithostratigraphy of an exploration well. This well is located on the eastflank of the Walu Ridge. Courtesy of ION Geophysical.
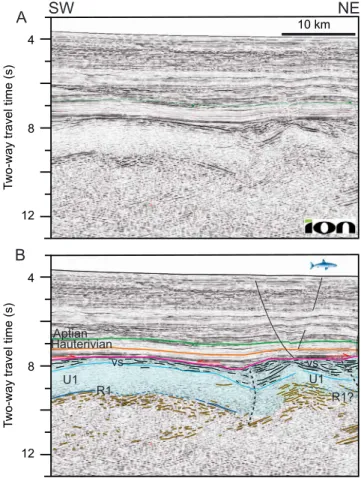
Figure 4. Seismic reflection profile AA0with superimposed interpretation (after Sauter et al. (2016)). R1–R4 are the main groups of reflectors within the basement and are discussed in the text. Unit U1 has been interpreted as the oceanic crust. The blue line indicates the base of a group of reflectors interpreted as a volcano-sedimentary sequence (VS). The Aptian and Hauterivian horizons are also indicated as green and orange lines, respectively. The dashed vertical lines indicated the location of cross sections C–E. Vertical exaggeration: ~1×. See Figure 2 for location. Courtesy of ION Geophysical (ION BasinSPAN line; www.iongeo.com/Data_Library/).
basement but large 20–30 km wavelength undulations (amplitude ~1 s TWTT, ~1.5 km) affect this smooth top basement (Figure 5). As on profile BB0, U1 isfloored by R1 between 9 and 10 s TWTT depths along most of this profile. Where R1 is not observed, U1 can tentatively be defined by its more transparent seismic texture than the underlying basement. The most noticeable antiform of both top basement and R1 is located at 45 km dis-tance (Figure 7). It is underlined by continuous bright R1 reflectors (~15 km long) on each limb of the fold, whereas a package of shorter bright reflectors occurs in the inner part of the fold. Locally, this package of
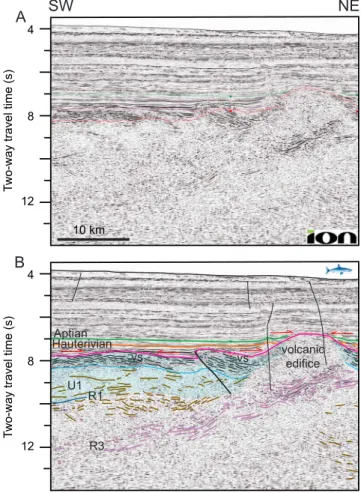
Figure 5. Seismic reflection profiles BB0, CC0, DD0, and EE0with superimposed interpretation. The dashed black lines show inferred fault traces, while the black continuous lines indicate more certain fault traces. Other annotations are the same as in Figure 4. Vertical exaggeration: ~1×. The frames indicate the areas shown in detail in Figures 6–8. See Figure 2 for location. Courtesy of ION Geophysical.
shorter reflectors is more than 1 s TWTT thick. It corresponds to the set of discontinuous reflectors R2 observed on profile AA0 below R1 (Figure 4). U1 is ~1.7 s TWTT thick on average with an upper VS sequence as much as 1 s TWTT thick locally. Profile CC0does not show clear thrust faults comparable to the large structure at 200 km distance on profile BB0. However, based on kinks or scarps at top basement, we suggest possible faults as dashed lines in Figure 5: two low-angle faults, at 100 and 115 km distance, with an apparent normal offset and listric shape and two reverse or transcurrent faults at 60 and 80 km distance. The oldest sedimentary layers (including Hauterivian) onlap the top basement.
Unit U1 is relatively transparent except in its upper part, which shows a series of strong reflectors (Figure 5) similar to the VS sequence observed in the upper part of the basement in the AA0 profile (Figure 4). These VS reflectors are more or less parallel to the top base-ment except around 70 km distance. There, they dip away from a sub-vertical axial plane in the same way as a package of strong reflectors at the base of unit U1 (Figure 7). The VS group of reflectors is absent between 140 and 160 km distance. There, the top basement outlines a 30 km wide massif with numerous short reflectors that form a bright upper layer distinct from the relatively transparent unit that we inter-pret as U1. These short reflectors root below R1 resulting in an upward widening assemblage (seeα in Figure 5). The contact between U1 and this upper layer is marked by a group of continuous reflectors at 9 s TWTT depth (seeβ in Figure 5). We interpret this massif as a volcanic edifice formed after U1. The Aptian horizon onlaps the flanks of this large inferred postseafloor-spreading volcanic edifice and seals the top basement relief elsewhere. Very recent small normal faults with high angles and locally branching inflower-like structure are clearly visible in the Late Mesozoic-Tertiary section from seafloor to top base-ment. These faults cannot be traced easily in the basebase-ment. As on pro-file BB0, the Aptian horizon lies close to the top of the basement in the
easternmost part of the section, while a thick pre-Hauterivian sedimen-tary package is observed in the westernmost part.
4.3. Profile DD0
Profile DD0(Figure 2), parallel to profile CC0, crosses profile AA0further to the south at 263 km distance (or 8°330S; Figure 4). Both the top basement and the base of the VS sequences of reflectors show undulations with a similar wavelength but a smaller amplitude than further north (<1 s TWTT, <1.5 km; Figure 5). The R1 group of reflectors is observed only locally. However, we tentatively define U1 based on the transparent texture of the upper part of the basement, below the VS sequence. The VS sequence reflectors (<1 s TWTT thick) are subparallel to the top basement except near the crossing point with profile AA0(Figure 8). There, they are dipping to the east on profile DD0and to the north on profile AA0where they are seen to belong to a rotated block bounded by a low-angle normal fault. This thick package of highly reflective material with reflectors that are therefore dipping to the northeast is thrusted westward over a thinner VS sequence. The top basement-Hauterivian interval is offset by this thrust (Figure 8). This tilted and reactivated VS package abuts a 1 s TWTT high less reflective domain to the east (at 100 km distance; Figures 5 and 8). The Aptian and Hauterivian layers onlap the conical shaped top basement of this domain. It corresponds to the northern flank of a well-marked rounded-shaped positive gravity anomaly in the satellite-derived, free-air gravity grid (Figure 2). We therefore interpret this domain as theflank of a large volcanic edifice. Beneath this volcano, U1 is not observed but a package of strong reflectors, between 8 and 10 s TWTT depth, has an apparent west-ward dip and possibly joining a westwest-ward dipping set of reflectors that is observed below R1 and up to 12 s TWTT. These deep reflectors have been identified on profile AA0as the R3 reflector group with a north-ward dip. Their true dip is therefore to the northwest. On profile DD0, as on the other profiles, the top
Figure 6. (a) Blowup of seismic reflection profile BB0and (b) interpretation illus-trating thrusting and buckling of the oceanic crust. Note that the Aptian horizon lies directly on the top basement high centered at 198 km indicating an erosion phase that has removed Hauterivian and earlier layers after the thrusting. See Figure 5 for location. Vertical exaggeration: ~1×. Courtesy of ION Geophysical.
basement relief is sealed by the Hauterivian horizon, except on the volcano, which is covered by post-Aptian sediments. This volcano and the western adjacent reactivated block are located within the N-S trending gravity low that is aligned alongside the Davie Ridge (Figure 2). Recent normal faults affect the whole sedimentary cover on both sides of the volcano, but they cannot be traced down in the basement.
4.4. Profile EE0
Profile EE0(Figure 5) illustrates the structure of the northern end of the Davie Ridge (Figure 2). It crosses profile AA0at 341 km distance (9°150S; Figure 4). R1 is barely identified to the west of the Davie Ridge but, to the east, it is marked by groups of aligned short reflectors. There R1 defines a 2 s TWTT thick U1. Westward of the Davie Ridge the upper VS sequence is up to 1.4 s TWTT thick. The reflectors of this VS sequence are more or less parallel to the horizontal or gently dipping parts of the top basement. However, at 100 km distance, they have a symmetric anticlinal form. On each side of the Davie Ridge, between 105 and 117 km and 135 and 150 km distance, the dip of the VS reflectors is decreasing from the base of the sequence toward the top basement suggesting the construction of wedges. At the Davie Ridge, the VS sequence and the R1 reflector group are not observed. A zone of strong reflectivity is observed at 8 s TWTT depth and joins another one to the west, located deeper between 9 and 10 s TWTT, through a westward dipping set of reflectors. We therefore suggest that the shallowest part of the Davie Ridge is a volcanic edifice with a crustal structure similar to the central volcano observed on profile DD0. This volcanic edifice is covered by post-Aptian sediments. To the east of the Davie Ridge, as in the easternmost part of the other profiles, the Aptian horizon lies almost on top of the basement indicating a basement age close to Aptian. In this southern area, the deformation of the top basement is shown at 100 km by an antiform, which is onlapped to the west by the Hauterivian horizon. The whole sediment pile on the eastern side of the Davie Ridge (between 120 and 170 km) dips gently eastward, indicating a recentflexure. Westward of the Davie Ridge, the whole sediment pile is cut by numerous recent faults that offset also the seafloor. The observed offset of the sedimentary layers indicates that normal faulting dominates in section view. However, the association of some of these faults with a bathymetric ridge at the seafloor at ~100 km distance suggests a strike-slip component. This set of normal faults marks the northern end of the Kerimbas Graben (Franke et al., 2015; Mougenot et al., 1986).
4.5. Profile FF0
Profile FF0(Figure 9) is parallel to profile AA0and crosses with high obliquity the N-S trending gravity anoma-lies extending the Davie Ridge to the north (Figure 2). The R1 reflector group is well expressed through short and bright reflectors at both the northern and southern ends of the profile. However, it is not observed beneath the central part of the profile corresponding to the northward extension of the Davie Ridge (Figure 9). There, between 110 and 210 km distance, a rough volcanic relief with several conic shaped edifices is observed. By contrast the top basement is highly reflective and smooth where R1 is well expressed. R1 defines a relatively transparent unit U1 over a thickness of ~2 s TWTT with a <0.5 s TWTT thick upper VS sequence. The reflectors of this VS sequence are short and do not give a layered aspect to the upper part of the basement as on profile EE0but rather look like the VS reflectors observed beneath the smooth volcanic top basement on profile AA0. In the central part of profile FF0, the VS reflectors are no longer parallel to the top basement but are dipping northward or southward (at 125 km distance), or form a thicker pile and a conical-shaped edifice (at 180 km distance). The most noticeable features of this profile are groups of R3 dipping reflectors, between 9 and 12 s TWTT. These R3 reflectors have apparent dips to the north or south and
Figure 7. (a) Blowup of seismic reflection profile CC0 and (b) interpretation illustrating buckling of the oceanic crust and deformation of the volcano-sedi-mentary (VS) sequence. Note the package of reflectors below R1 that corresponds to the set of discontinuous reflectors R2 observed on profile AA0 (see Figure 4). See Figure 5 for location. Vertical exaggeration: ~1×. Courtesy of ION Geophysical.
converge to shallower depths (9 s TWTT) at the western and eastern edges of the central part of the profile to the north of the Davie Ridge (110 and 180 km distances). Such upward convergent groups of deep reflectors are also observed on other NNW-SSE trending seis-mic profiles (including A-A0 at 290 km distance) crossing the Davie Ridge further south. The oldest sediments (including Hauterivian) onlap the top basement indicating passive infill. In the easternmost part of the profile, the Aptian horizon lies almost on top of the basement. Unlike on profile AA0, no fault is identified in the basement and no recent fault is observed in the sedimentary cover.
5. Synthesis of Observations
Here we present a summary of our observations in the westernmost part of the WSB. We presentfirst an interpretation of the nature of the basement and then describe its deformation.
5.1. The Nature of the Crust in the WSB West of 41°300E
Typically,“normal” oceanic crust is characterized in seismic reflection profiles by (1) a reflective top basement, smooth at a kilometric scale for fast or magma-rich spreading ridges, and rougher for slow or magma-poor spreading ridges; (2) an often highly reflective uppermost crust and a more acoustically transparent part below; (3) a ~2 s TWTT mean thickness; and (4) an often well-marked bright reflector at the base of the crust interpreted as the Moho, commonly observed at 10 s TWTT but, which can either be absent or marked by an up to 1 s TWTT thick package of laterally discontinuous reflectors. In most of the seismic sections presented here, U1 matches these characteristics, with R1 corresponding to the oceanic Moho ~2 s TWTT deeper. This leads us to propose the occurrence of oceanic crust to the west of 41°300E (Figure 10). However, some unusual features are observed at the top of U1 as well as below R1. Moreover, U1 is not observed in all parts of the seismic sections as R1 is locally missing. We discuss here-after these peculiarities.
5.1.1. Reflectors in the Upper Part of the Crust
A series of alternating strong and weak reflectors (the VS sequence) is often observed in the upper part of the crust, giving a layered aspect to it. Nevertheless, this layering is easy to distinguish from the overlying sedi-ments as the top of the VS sequence is generally well marked by its strong reflectivity. The VS sequence is rarely identified in the northern part of the basin, but it thickens southward and reaches its maximum
Figure 8. (a) Blowup of seismic reflection profile DD0and (b) interpretation illus-trating thrusting of the volcano-sedimentary (VS) sequence and the volcanic edifices north of the Davie Ridge. Note that the VS sequence thrusted westward corresponds to a rotated block observed on profile AA0(see Figure 4). See Figure 5 for location. Vertical exaggeration: ~1×. Courtesy of ION Geophysical.
thickness on the Davie Ridge (Figures 4 and 5). It is not well expressed in the areas of thickest crust and smooth top basement. The VS sequence is mostly observed within tilted fault blocks, where it locally forms wedges indicating a syn-tectonic origin (Figures 4 and 5). We will discuss the geometry of the normal faults in the next section and focus here on the nature of the VS sequence.
Such fault-related block rotation resulting in shallow dips of sedimen-tary reflectors away from the ridge axis was also described at the Andaman Sea spreading center (Jourdain et al., 2016). Although not typical, some fan-shaped stratigraphic layering, with alternating strong and weak reflectors, were observed within rotated fault blocks at the extinct Middle Labrador spreading center (Srivastava & Keen, 1995) and at the present-day Mohn-Knipovich spreading ridge (Bruvoll et al., 2009). The VS type sequence at those spreading centers is inter-preted as the result of interlayered basalts and sediments deposited over the seafloor in settings with high sedimentation rates (Srivastava & Keen, 1995). A VS-type sequence is also observed at the deep marine flanks of the Hawaiian volcanoes (Morgan et al., 2000). There, the strong, continuous, and conformable reflections of the sequence are interpreted as consisting of hyaloclastites interbedded with volcano-clastic sandstones and breccias (Morgan et al., 2000). Such sequences with hyaloclastites interbedded with turbidites and/or hemipelagic sediments may explain the VS group of reflectors in our study area with high sedimentation rates related to the proximity of the Tanzanian margin. The large volcanic edifices intruding and overlying U1 could be sources for the lavas of this VS sequence. However, the VS sequence is observed also away from these large volcanic edifices, and smaller volcanic edifices are often found on top of the basement nearby. We therefore suggest that the VS sequence results from intermittent volca-nic activity at or close to the ridge axis where seafloor spreading is accommodated through the interplay between tectonic stretching and relatively low volumes of magmatic addition. In regions of thicker crust and smoother volcanic top basement (e.g., in the central part of the study area; Figure 10), the VS sequence is not developed. This may result from the continuous volcanic feeding of the upper crust and seafloor spreading dominated through magmatic addition. By con-trast, the VS sequence thickens southward concomitantly with the reduction in crustal thickness toward the inferred fossil ridge axis. This suggests that the VS sequences formed as a response to discontinuous magmatism due to the decreas-ing melt budget as seafloor spreading came to an end in the westernmost part of the WSB.
5.1.2. The Base of the Crust
The R1 reflector group, interpreted as the Moho at the base of the oceanic crust, is either well marked as a set of 1–2 bright and continuous reflectors or by an up to 1 s TWTT thick package of laterally discontinuous reflec-tors. Locally bright R1 reflectors occur on each side of crustal-scale folds, while a package of smaller bright reflectors occurs in the inner parts of the folds (Figure 5). Laterally, U1 can often be identified thanks to its relatively transparent seismic texture while R1 is not continuously observed (e.g., profile BB0) and R2 still is (profile AA0). In some places, neither R1, nor R2, nor the seismic transparent texture of U1 is observed. There, the crust is either superimposed by postseafloor-spreading volcanic edifices or its upper part is faulted (e.g., profile CC0and DD0; Figures 5 and 10). Although we cannot rule out that oceanic magmatic crust might be absent when R1 and U1 are not observed, we stress that magma-poor slow to ultraslow spreading ridges with large domains of exhumed mantle display rough top basement and strong gravity variations (Sauter et al., 2011, 2018), both of which we do not observe. We therefore rather suggest that the seismic signature of the base of the crust may change depending on whether it is faulted, deformed, intruded, or not.
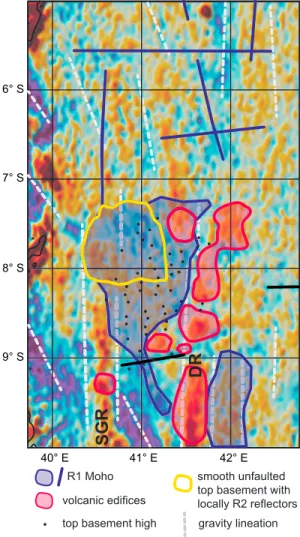
Figure 10. Occurrence of R1 groups of reflectors, interpreted as the oceanic Moho, and distribution of volcanic areas and smooth top basement zones. Surfaces are drawn where the density of seismic profiles is high. There, the black dots indicate the top basement highs interpreted as hinge points. The blue lines show the occurrence of oceanic crust along isolated seismic profiles. The black and dashed gray lines indicate the inferred extinct ridge axis and gravity lineaments, respectively, as in Figure 1. The background image is the vertical derivative of the gravity free-air anomaly (Sandwell et al., 2014).
The oceanic Moho is observed to be most continuous at the base of crust produced at fast spreading rates, while it is always discontinuous at slow rates (Mutter & Carton, 2013). There are many places, away from the axial region, where the crust-mantle transition in slow spreading crust shows no distinguishable reflection (Mutter & Carton, 2013). There may be two explanations for this. Either the Moho interface is quite variable in structure, ranging from a simple step discontinuity to a gradual transition zone broad enough that it does not generate a vertical incidence response, and/or the scattering and absorbing properties in the crustal section lead to variable imaging conditions at the Moho level (Mutter & Carton, 2013). In our study area, the volcanic and tectonic overprinting enhances the variability of the oceanic crust structure. Volcanism post-dating the emplacement of the ocean crust results from melt passing through the crust and the crust-mantle transition zone. Moreover, hydrothermalfluid circulation, favored within faulted areas or in the inner parts of the crustal folds, may have reached deeper crustal level in those areas than in unfaulted zones. Thesefluids may have also resulted in the serpentinization of the mantle and in a thicker seismic velocity gradient zone at the crust-mantle transition.
The R1 group of reflectors is especially well marked within the thickest crust areas where the top basement is smooth and unfaulted. There, the U2 unit, defined by the R2 group of reflectors at its base, is observed beneath R1 (Figures 4 and 10). The strength of these reflectors weakens progressively southward, and they are not more observed where the top basement becomes heavily faulted and U1 is the thinnest. U2 has been interpreted as a crust-mantle transition zone made of trapped melt bodies within the mantle resulting in the reflective character of this unit (see Sauter et al., 2016). This interpretation implies an inefficient extraction of melt out of the mantle, which is favored by the combination of a slow spreading rate, hence a relatively thick lithosphere, and a high magma budget (Lizarralde et al., 2004). As the magma budget decreases southward together with increasing faulting, we speculate that the melt is no more trapped in the mantle and the crust-mantle transition zone thins dramatically, resulting in the vanishing of R2. U2 unit extents between 7°100S and 7°550S and between the Sea Gap Ridge and the northern extension of the Davie Ridge (Figure 10). This area corresponds to a low anomaly in the free-air gravity map supporting the presence of thick crust there. Gravity lineations also change orientation in that area, from NNW-SSE to N-S, possibly marking a clock-wise change in the spreading direction (Figure 1). We will further discuss in the next section how this change of spreading direction may be related to a larger magma budget.
5.1.3. The Reflectors Within the Mantle
The R3 group of reflectors is observed in the mantle below 9°s and up to 12°s TWTT depth. Profiles AA0and FF0 show that they form upward convergent assemblages, which reach the Davie Ridge and its northern exten-sion at the base of the crust. R3 is mostly observed on NNW-SSE profiles; however, one branch is recognized on the perpendicular profile DD0, shallowing eastward and reaching the base of the large volcano at the Davie Ridge. Although another branch is observed southward on profile AA0, profile EE0does not show this deep reflectors, but we note that a volcanic edifice is found at the crossing point between these two profiles. We therefore propose that the R3 reflectors are produced by an accumulation of frozen melt that fed the postseafloor-spreading volcanic edifices along the Davie Ridge and its northern extension (Figure 10). We discuss the origin of this volcanic episode in the next part.
5.2. Deformation of the Oceanic Crust
The oceanic crust in the westernmost part of the WSB is deformed during two main phases: an extensional phase at the end of the spreading followed by an oblique shortening phase in Early Cretaceous.
5.2.1. Normal Faulting
The tilted fault blocks bearing the VS sequence are limited by either high-angle normal faults or by appar-ently listric faults merging into a detachment fault (Figure 11). The seismic profiles are not dense enough to properly map these small structures. However, we were able to follow the main normal faults from one long NNW-SSE seismic profile to the other. The location of the main normal fault at ~110 km on profile AA0 and on two other profiles shows that this fault trends WSW-ENE, perpendicular to the gravity lineations inferred to indicate the paleo spreading direction. Such an orientation also explains why these faults are not seen on the WSW-ENE profiles. The normal faults dip toward the inferred location of the extinct ridge axis, as would be expected for inward facing normal faults across a slow spreading accretionary ridge (Buck et al., 2005). To the north of ~8°150S, they are either absent in the smooth top basement areas where the crust is the thickest or they have small throws most of them only affecting the VS sequence (Figure 4). Detachments are mainly observed south of the area with thick crust. They are located either at the base of the VS sequence or
at the base of the crust (Figures 4 and 11). The décollement level at the base of the VS sequence may be analogous to the one on top of the oceanic crust below theflanks of Hawaiian volcanoes moving away from their eruptive centers (Morgan et al., 2000). There, the base of a volcano-sedimentary sequence, similar to the VS sequence (see above), may act as a weak layer along which slip can occur. Faults may also root near the base of the crust close to the inferred paleo axis. There, the thin faulted crust may favor hydrothermalfluid circulation and serpentinization of the upper mantle resulting in an alteration front where detachment faults may root. Alternatively, they may root in the melt-rich zone beneath the paleo axial valley. Both explanations were suggested for detachment faults at slow spreading ridges (Escartín et al., 2003). High-angle normal faults bounding the rotated blocks may root locally below the Moho, up to ~12 s TWTT depth (Figure 11), while inward facing faults at slow spreading ridges generally terminate downdip at or near Moho depth (Carton et al., 2014). The degree to which these faults penetrate the crust and mantle relates to the extent of brittle failure in the crust and thus the thermal state of the basement. As the normal faults root-ing well below the Moho occur far as well as close to the inferred paleo axis, we suggest that the thermal structure of the ridge may not control these faults but they may have been active after the end of spreading when lithosphere was thick enough to include upper mantle. The VS sequences within the rotated blocks exhibit also a wide variety of internal reflectivity character. In some places the internal reflectors dip at angles of 30 to 45°; in others, they gradually steepen with depth-forming wedges, regardless of the occurrence of U1/R1 (Figure 11). These structural relationships suggest that faulting occurred both during and after the for-mation of the basement. In thefirst case, faulting would have been localized at the ridge axis, while in the second case, extensional faulting could continue for a while after the cessation of spreading, within and out-side the axial valley, extending below the Moho. Both the thickening of the VS sequence and the increasing normal faulting toward the inferred paleo-ridge axis argue for a faulting phase associated with the decreasing melt budget as seafloor spreading came to an end. At the extinct Mid-Labrador spreading center, several observations also tend to favor such thinning of the crust when spreading approached failure (Delescluse et al., 2015). There, both fan-shaped stratigraphic layering and tilted layering with no change of dip are observed within rotated blocks on top of the oceanic crust (Srivastava & Keen, 1995). Tectonism occurred thus after the emplacement of the crust without excluding tectonic extension during spreading (Delescluse et al., 2015) (Louden et al., 1996).
5.2.2. Reverse Faulting and Buckling of the Oceanic Crust
Both top basement and the Moho show folds with a 20–30 km wavelength in the westernmost part of the WSB. This deformation is more severe to the north with folds of larger amplitude than to the south and asso-ciated with large thrust faults (Figure 5). These thrusts have high-angle dips and cut across the basement reaching the Moho. However, the extension of the faults within the mantle is difficult to determine on the
Figure 11. Seismic reflection profiles illustrating the volcano-sedimentary (VS) sequence within rotated blocks which are limited by either high-angle normal faults or by apparently listric faults merging into a décollement fault. The normal faults root locally deep in the basement (>10 s two-way travel time) offsetting the R1 group of reflectors. Note that some faults may be sealed by the upper part of the VS sequence. See Figure 2 for location. Vertical exaggeration: ~1×. Courtesy of ION Geophysical.
seismic profile. In the upper part of the crust, the VS reflectors are usually parallel to the folded top basement indicating that the VS sequence was folded with the basement. Locally, the VS reflectors develop more complex structures, showing chaotic distributions or dip-ping away from a subvertical axial plane in a similar way than the top basement suggesting the formation of antiforms (e.g., Figure 5). Moreover, some tilted blocks bounded by normal faults have been reactivated and rotated westward or eastward through inversion (see profile AA0and DD0; Figures 4 and 5). Buckling of the crust and asso-ciated reverse faulting thus occurred after the extensional phase, which is associated with the emplacement of the VS sequence. In the south-ern part of the study area, the oldest sedimentary layers, including Hauterivian, onlap the folded top basement, while in the northern part, these Hauterivian layers are affected by inversion (Figure 5). The Aptian horizon almost seals the top basement relief everywhere. We therefore conclude that the deformation of the oceanic crust occurred soon after its formation, as early as pre-Hauterivian time, and ended at Aptian time.
5.2.3. Distribution of the Deformation
Deformation is localized along corridors, about 15–30 km wide and trending N-S to NE-SW (Figures 10 and 12). To the south of the inferred extinct ridge axis, these corridors are bordering the Davie Ridge on both western and easternflanks. Northward of the ridge axis, they separate into two branches, one oriented ~N-S and one trending NNW-SSE (Figures 5 and 12). Both the southern part of the NNW-SSE branch and the ~N-S trending branch associated with the Davie Ridge further south correspond to postseafloor-spreading volcanic edi-fices. These two branches separate two oceanic domains with contrast-ing ages, Early Cretaceous to the east and an older domain to the west with locally Upper Jurassic sediments close to the margin (Figures 5 and 9). Picking the hinge points of the crustal folds on the WSW-ENE trending seismic line between 7°300S and the inferred ridge axis reveals that these folds are also parallel to the gravity lineations (Figure 10). These lineations change orientation, from NNW-SSE close to the margin to N-S seaward, and are interpreted to indicate an early change of the spreading direction (Figure 12), as in the North Somali Basin (Gaina et al., 2015; Seton et al., 2012). We therefore suggest that the inherited segmen-tation of the oceanic crust, due to transform faults or nontransform offsets at the ridge axis, may have strongly influenced the deformation of the oceanic crust. At slow spreading segment ends, large throw faults develop where lower magma budget and thicker axial lithosphere are inferred relative to the segment cen-ters (e.g., Carbotte et al., 2015). The fracture zones, resulting from transform faults that offset the ridge axis, may have been reactivated as weaker zones and further localize the postspreading deformation.
Finally, large steep faults affect locally the whole sedimentary cover above these deformation corridors indi-cating that they were reactivated recently. Recent faulting is also observed outside these corridors along and south of the inferred location of the extinct ridge axis. This axis marks thus the northern edge of the Kerimbas Graben, which shows Miocene to recent large normal faults (Franke et al., 2015).
5.3. Volcanism and Magmatic Intrusions
Volcanic edifices correspond to additions at the top of the oceanic crust and result from intrusions within the crust. The oldest sediment layers locally onlap this volcanic relief, indicating early postseafloor-spreading emplacement. Most of the volcanic edifices are aligned along the Davie Ridge and its northern extension (Figures 10 and 12). At depth, the R3 groups of reflectors, within the mantle, reach the base of these volcanic edifices (Figure 5), suggesting that they correspond to melt channels toward the Davie Ridge. Profile FF0 shows that the R3 groups of reflectors form upward convergent structures reaching the base of the crust within the western and eastern deformation corridors bordering the Davie Ridge and its northern extension
Figure 12. Structural map of the westernmost part of the West Somali Basin. The white arrows show the spreading direction. OCT: ocean continent transition. Other annotations are the same as in Figure 1. Tertiary faults related to the East African Rift System are not shown.
(Figure 12). The geometry of the R3 set of reflectors suggests a strong tectonic control of the melt channeling with faults being utilized (potentially reactivated) within the deformation corridors during the postsea floor-spreading volcanic phase. We therefore suggest that the R3 reflectors correspond to main shear zones tapping a connection to deep lithospheric melt channels that enabled extraction of magma up to the crust along the Davie Ridge and its northern extension. The Hauterivian horizon onlaps the volcanic edifices, which are sealed by post-Aptian layers indicating that this postseafloor-spreading volcanic phase began before Hauterivian times.
A few large volcanoes to the north (at ~5 and 3°S; see Figure 12) have been dated to be of Santonian age (Cruciani & Barchi, 2016). Inferred Late Cretaceous volcanic edifices have also been mapped in the southern part of the Somali Basin (see Figure 10 of Klimke et al. (2016)). Late Cretaceous volcanic activity was also observed in western Madagascar and along the Mozambique Channel (Bassias & Leclaire, 1990). There, seamounts have been produced along the Davie Ridge by volcanism predating the onset of the East African Rift System (Bassias & Leclaire, 1990; Franke et al., 2015).
6. Discussion
6.1. Evolution of the Westernmost West Somali Basin
Spreading began with an NNW-SSE direction and then changed to N-S (Davis et al., 2016; Gaina et al., 2015; Reeves et al., 2016). This reorientation induced a strong change of the segmentation of the ridge axis. Following the curvature of the gravity lineations from the segmented Tanzanian margin toward the inferred paleo ridge axis shows that the ~300 km long ridge section southwestward of the Wallu Ridge may have reduced its length by as much as 60% tofinally get trapped in between the Sea Gap Ridge, close to the margin, and the Davie Ridge (Figure 12). We propose that the shortening of this ridge section led to an enhancement of the focusing of melt between the fracture zones while spreading changed direction. This may have led to a higher magma budget and an area with thicker crust within the ridge section between the Sea Gap Ridge and the Davie Ridge (Figure 10). As spreading progressively ceased, the magma budget at the spreading ridge decreased and the oceanic crust thinned concomitantly with an increase in normal faulting that produced large tilted fault blocks with associated syn-tectonic volcano-sedimentary sequences. The deformation corridors were initiated before Hauterivian time along two branches, one oriented ~N-S and one trending NNW-SSE up to the Wallu Ridge (Figure 12) with emplacement of large postseafloor-spreading volcanic edifices. The oceanic crust was then folded, and the deformation corridors were reactivated with westward and eastward directed reverse faulting and inversion. Folding and reactivation of these fracture zones ended at Aptian times, when spreading ceased in the WSB. This timing of the folding and reverse fault-ing in the westernmost WSB is close to one of the convergence phase proposed by Gaina et al. (2015) in the North Somali Basin. These authors showed that there, the preserved oceanic crust formed 160–133 Ma ago as a result of ~N-S extension between the NW Indian margin and the eastern Somali margin and that most of the conjugate oceanicflank was probably deformed and consumed during the subsequent compressional event that started ~132 Ma ago and ceased soon after at ~120 Ma. Early Cretaceous transpressive structures were also inferred to the west of the Davie Ridge in the northern Mozambique Basin (at 17°S) (Franke et al., 2015; Mahanjane, 2014). There, sedimentary strata have been overthrust onto the oceanic crust before wide-spread and largely undisturbed Late Cretaceous to recent sedimentary successions were deposited on top (Franke et al., 2015). The change in the plate tectonic regime off East Africa leading to this so far overlooked Early Cretaceous convergent phase remains to be investigated.
6.2. Implications for the Deformation of Oceanic Crust
The identification of compressional tectonic activity at passive margins is not new, but there are few exam-ples of early intraplate deformation within oceanic crust. The reason for this is that, although the strength of the oceanic lithosphere is lower than in the surrounding continental lithosphere during the initial stages of an oceanic basin, it increases quickly as the oceanic lithosphere cools and thickens (Vauchez et al., 1998). Briggs et al. (2009) and Lawrence et al. (2016) reported early deformation of Late Aptian oceanic crust (~118 Ma; Heine et al., 2013) in the Gulf of Guinea. There, thrust structures and associated folds with a wave-length of a few kilometers, parallel to the fracture zones, are thought to result from a change in spreading direction that occurred at Santonian time during the opening of the South Atlantic (Briggs et al., 2009). As
in the WSB, it is proposed that the deformation of the oceanic crust, ~30 Ma after its formation, is a product of regional stress inducing deformation partly controlled by mechanically weak zones along inherited fracture zones of the oceanic crust (Lawrence et al., 2016).
In the Bay of Biscay, the timing of the deformation relative to the formation of thefirst oceanic crust is close to that in the Gulf of Guinea: Thefirst oceanic crust is dated Late Aptian, and the compression, due to the north-south convergence of Europe and Iberia, occurred at Santonian time (i.e., the Pyrenean orogeny; Tugend, Manatschal, & Kusznir, 2015). However, deformation mainly localized in the ocean-continent transitions and was rather diffuse in the oceanic crust close to the margins (Masson et al., 1994; Tugend et al., 2014). By contrast to the WSB and the Gulf of Guinea, where reverse faulting occurred at fracture zones more or less perpendicular to the regional stress, the direction of compression was parallel to the direction of spreading (hence the orientation of the fracture zones) in the Bay of Biscay. Therefore, we might expect the reactivation of normal faults parallel to the axis and especially those close to the paleo-ridge axis as the extinction of spreading was contemporaneous with the Pyrenean compression phase (Sibuet & Collette, 1991). However, such reactivation is not documented at the unique seismic profile (IAM 12) that crosses the extinct ridge (Fernández-Viejo et al., 1998, 2012).
We therefore conclude that intraplate deformation occurred in the WSB for two reasons. First, the oceanic lithosphere was young and therefore thin enough to be folded. Second, the regional stress changed and compression was oriented oblique to the major and minor fracture zones to reactivate them and initiate thrusting. This leads tofinal important implications of our study. Whether subduction or obduction initiates at the continent-ocean transition or at some other tectonic discontinuity, such as a ridge or transform fault could therefore be strongly related to both the thermal state of the oceanic crust and the reorientation of the regional stress in response to changes in plate motions. These are the two key factors that may have probably controlled the obduction of the Oman ophiolite (Agard et al., 2014).
7. Conclusions
The principal results of our interpretation of high-resolution deep seismic reflection sections in the western-most part of the Somali Basin are as follows:
1. We document the occurrence of oceanic crust to the west of the Davie Ridge and its northern extension. Large tilted fault blocks associated with syn-tectonic volcano-sedimentary sequences are observed on top of the oceanic crust, suggesting that normal faulting may have continued after the end of spreading. 2. A compressional phase, starting before Hauterivian time (~132 Ma) and ending at Aptian time, results in
1–2 km amplitude buckle folds associated with thrust faults. Reverse faulting is localized along deforma-tion corridors about 15–30 km wide that are interpreted as inherited fracture zones of the extinct spread-ing center.
3. Prior to the buckling and reverse faulting of the oceanic crust, large volcanic edifices have been emplaced on top of the oceanic crust. A well-defined group of reflectors within the mantle is interpreted as large shear zones that tapped a connection to deep lithosphericfissures and enabled the channeling of melt up to the crust leading to magmatic intrusions and emplacement of volcanic edifices within the deforma-tion corridors.
References
Agard, P., Zuo, X., Funiciello, F., Bellahsen, N., Faccenna, C., & Savva, D. (2014). Obduction: Why, how and where. Clues from analog models. Earth and Planetary Science Letters, 393, 132–145. https://doi.org/10.1016/j.epsl.2014.02.021
Bassias, Y., & Leclaire, L. (1990). The Davie Ridge in the Mozambique Channel: Crystalline basement and intraplate magmatism. Neues Jahrbuch Fur Geologie Und Palaontologie-Abhandlungen, 2, 67–90.
Briggs, S. E., Davies, R. J., Cartwright, J., & Morgan, R. (2009). Thrusting in oceanic crust during continental drift offshore Niger Delta, equatorial Africa. Tectonics, 28, TC1004. https://doi.org/10.1029/2008tc002266
Bruvoll, V., Breivik, A. R. J., Mjelde, R., & Pedersen, R. B. (2009). Burial of the Mohn-Knipovich seafloor spreading ridge by the Bear Island Fan: Time constraints on tectonic evolution from seismic stratigraphy. Tectonics, 28, TC4001. https://doi.org/10.1029/2008tc002396 Buck, W. R., Lavier, L. L., & Poliakov, A. N. B. (2005). Modes of faulting at mid-ocean ridges. Nature, 434, 719–723. https://doi.org/10.1038/
nature03358.
Bull, J. M., Martinod, J., & Davy, P. (1992). Buckling of the oceanic lithosphere from geophysical data and experiments. Tectonics, 11(3), 537–548. https://doi.org/10.1029/91TC02908
Bull, J. M., & Scrutton, R. A. (1990). Fault reactivation in the central Indian Ocean and the rheology of oceanic lithosphere. Nature, 344(6269), 855–858. https://doi.org/10.1038/344855a0
Acknowledgments
We thank ION for permitting publication of their East AfricaSPAN™seismic data (www.iongeo.com/Data_Library/). Support was provided by TOTAL and the French Institut National des Sciences de l’Univers INSU-CNRS. Constructive reviews by Anne Briais, Dieter Franke, and Tim Minshull are gratefully acknowledged.
Carbotte, S. M., Smith, D. K., Cannat, M., & Klein, E. M. (2015). Tectonic and magmatic segmentation of the Global Ocean ridge system: A synthesis of observations. In T. J. Wright, A. Ayele, D. J. Ferguson, T. Kidane, & C. Vye-Brown (Eds.), Magmatic Rifting and Active Volcanism Geological Society London, Special Publications, 420, 249–295. https://doi.org/10.1144/sp420.5
Carton, H., Singh, S. C., Hananto, N. D., Martin, J., Djajadihardja, Y. S., Udrekh, D. F., & Gaedicke, C. (2014). Deep seismic reflection images of the Wharton Basin oceanic crust and uppermost mantle offshore northern Sumatra: Relation with active and past deformation. Journal of Geophysical Research: Solid Earth, 119, 32–51. https://doi.org/10.1002/2013JB010291
Chamot-Rooke, N., Jestin, F., de Voogd, B., & Phedre Working Group (1993). Intraplate shortening in the Central Indian Ocean determined from a 2100-km-long north-south deep seismic reflection profile. Geology, 21, 1043–1046.
Cochran, J. R. (1988). Somali Basin, Chain Ridge, and origin of the northern Somali Basin gravity and geoid low. Journal of Geophysical Research, 93(B10), 11,985–12,008. https://doi.org/10.1029/JB093iB10p11985
Coffin, M. F., & Rabinowitz, P. D. (1987). Reconstruction of Madagascar and Africa: Evidence from the Davie fracture zone and Western Somali Basin. Journal of Geophysical Research, 92(B9), 9385–9406. https://doi.org/10.1029/JB092iB09p09385
Cruciani, F., & Barchi, M. R. (2016). The Lamu Basin deepwater fold-and-thrust belt: An example of a margin-scale, gravity-driven thrust belt along the continental passive margin of East Africa. Tectonics, 35, 491–510. https://doi.org/10.1002/2015tc003856
Davis, J. K., Lawver, L. A., Norton, I. O., & Gahagan, L. M. (2016). New Somali Basin magnetic anomalies and a plate model for the early Indian Ocean. Gondwana Research, 34, 16–28. https://doi.org/10.1016/j.gr.2016.02.010
Delescluse, M., Funck, T., Dehler, S. A., Louden, K. E., & Watremez, L. (2015). The oceanic crustal structure at the extinct, slow to ultra-slow Labrador Sea spreading center. Journal of Geophysical Research: Solid Earth, 120, 5249–5272. https://doi.org/10.1002/2014JB011739 Delescluse, M., Montési, L., & Chamot-Rooke, N. (2008). Fault reactivation and selective abandonment in the oceanic lithosphere. Geophysical
Research Letters, 35, L16312. https://doi.org/10.1029/2008GL035066
DeMets, C., & Royer, J.-Y. (2003). A new high-resolution model for India-Capricorn motion since 20 Ma: Implications for the chronology and magnitude of distributed crustal deformation in the central Indian Basin. Current Science, 85(3), 339–345.
Escartín, J., Mével, C., MacLeod, C. J., & McCaig, A. M. (2003). Constraints on deformation conditions and the origin of oceanic detachments: The Mid-Atlantic Ridge core complex at 15°450N. Geochemistry, Geophysics, Geosystems, 4(8), 8613. 10https://doi.org/10.1029/ 2001GC000278
Fernández-Viejo, G., Gallart, J., Pulgar, J. A., Gallastegui, J., Dañobeitia, J. J., & Córdoba, D. (1998). Crustal transition between continental and oceanic domains along the north Iberian margin from wide angle seismic and gravity data. Geophysical Research Letters, 25(23), 4249–4252. https://doi.org/10.1029/1998GL900149
Fernández-Viejo, G., Pulgar, J. A., Gallastegui, J., & Quintana, L. (2012). The fossil accretionary wedge of the Bay of Biscay: Critical wedge analysis on depth-migrated seismic sections and geodynamical implications. The Journal of Geology, 120, 315–331. https://doi.org/ 10.1086/664789
Franke, D., Jokat, W., Ladage, S., Stollhofen, H., Klimke, J., Lutz, R., et al. (2015). The offshore East African Rift System: Structural framework at the toe of a juvenile rift. Tectonics, 34, 2086–2104. https://doi.org/10.1002/2015TC003922
Gaina, C., van Hinsbergen, D. J. J., & Spakman, W. (2015). Tectonic interactions between India and Arabia since the Jurassic reconstructed from marine geophysics, ophiolite geology, and seismic tomography. Tectonics, 34, 875–906. https://doi.org/10.1002/2014TC003780 Geiger, M., Clark, D. N., & Mette, W. (2004). Reappraisal of the timing of the breakup of Gondwana based on sedimentological and seismic
evidence from the Morondava Basin, Madagascar. Journal of African Earth Sciences, 38(4), 363–381. https://doi.org/10.1016/ j.jafrearsci.2004.02.003
Heine, C., Zoethout, J., & Müller, R. D. (2013). Kinematics of the South Atlantic rift. Solid Earth, 4(2), 215–253. https://doi.org/10.5194/ se-4-215-2013
Jourdain, A., Singh, S. C., Escartin, J., Klinger, Y., Raju, K. A. K., & McArdle, J. (2016). Crustal accretion at a sedimented spreading center in the Andaman Sea. Geology, 44(5), 351–354. https://doi.org/10.1130/g37537.1
Klimke, J., & Franke, D. (2016). Gondwana breakup: No evidence for a Davie fracture zone offshore northern Mozambique, Tanzania and Kenya. Terra Nova, 28(4), 233–244. https://doi.org/10.1111/ter.12214
Klimke, J., Franke, D., Gaedicke, C., Schreckenberger, B., Schnabel, M., Stollhofen, H., et al. (2016). How to identify oceanic crust—Evidence for a complex break-up in the Mozambique Channel, off East Africa. Tectonophysics, 693, 436–452. https://doi.org/10.1016/j.tecto.2015.10.012 Lawrence, S. R., Beach, A., Jackson, O., & Jackson, A. (2016). Deformation of oceanic crust in the eastern Gulf of Guinea: Role in the evolution of the Cameroon volcanic line and influence on the petroleum endowment of the Douala-Rio Muni Basin. In T. S. Ceraldi, R. A. Hodgkinson, & G. Backe (Eds.), Petroleum Geoscience of the West Africa Margin Geological Society London, Special Publications, 438, 7–26. https://doi.org/ 10.1144/sp438.7
Lizarralde, D., Gaherty, J. B., Collins, J. A., Hirth, G., & Kim, S. D. (2004). Spreading-rate dependence of melt extraction at mid-ocean ridges from mantle seismic refraction data. Nature, 432, 744–747. https://doi.org/10.1038/nature03140
Louden, K. E., Osler, J. C., Srivastava, S. P., & Keen, C. (1996). Formation of oceanic crust at slow-spreading rates: New constraints from an extinct spreading center in the Labrador Sea. Geology, 24(9), 771–774. https://doi.org/10.1130/0091-7613(1996)024%3C0771:FOOCAS% 3E2.3.CO;2
Mahanjane, E. S. (2014). The Davie fracture zone and adjacent basins in the offshore Mozambique Margin—A new insight for the hydrocarbon potential. Marine and Petroleum Geology, 57, 561–571. https://doi.org/10.1016/j.marpetgeo.2014.06.015
Mascle, J., Mougenot, D., Blarez, E., Marinho, M., & Virlogeux, P. (1987). African transform continental margins: Examples from Guinea, the Ivory Coast and Mozambique. Geological Journal, 22(S2), 537–561. https://doi.org/10.1002/gj.3350220632
Masson, D. G., Cartwright, J. A., Pinheiro, L. M., Whitmarsh, R. B., Beslier, M.-O., & Roeser, H. (1994). Compressional deformation at the ocean-continent transition in the NE Atlantic. Journal of the Geological Society, 151(4), 607–613. https://doi.org/10.1144/gsjgs.151.4.0607 McAdoo, D. C., & Sandwell, D. T. (1985). Folding of oceanic lithosphere. Journal of Geophysical Research, 90(B10), 8563–8569. https://doi.org/
10.1029/JB090iB10p08563
Montési, L. G. J., & Zuber, M. T. (2003). Spacing of faults at the scale of the lithosphere and localization instability: 2. Application to the Central Indian Basin. Journal of Geophysical Research, 108(B2), 2111. https://doi.org/10.1029/2002JB001924
Morgan, J. K., Moore, G. F., Hills, D. J., & Leslie, S. (2000). Overthrusting and sediment accretion along Kilauea’s mobile south flank, Hawaii: Evidence for volcanic spreading from marine seismic reflection data. Geology, 28(7), 667–670. https://doi.org/10.1130/ 0091-7613(2000)28%3C667:oasaak%3E2.0.co;2
Mougenot, D., Recq, M., Virlogeux, P., & Lepvrier, C. (1986). Seaward extension of the east African rift. Nature, 321(6070), 599–603. https://doi. org/10.1038/321599a0
Mutter, J. C., & Carton, H. D. (2013). The Mohorovicic discontinuity in ocean basins: Some observations from seismic data. Tectonophysics, 609, 314–330. https://doi.org/10.1016/j.tecto.2013.02.018
Phethean, J. J. J., Kalnins, L. M., van Hunen, J., Biffi, P. G., Davies, R. J., & McCaffrey, K. J. W. (2016). Madagascar’s escape from Africa: A high-resolution plate reconstruction for the Western Somali Basin and implications for supercontinent dispersal. Geochemistry, Geophysics, Geosystems, 17, 5036–5055. https://doi.org/10.1002/2016GC006624
Rabinowitz, P. D., Coffin, M. F., & Falvey, D. (1983). The separation of Madagascar and Africa. Science, 220(4592), 67–69. https://doi.org/ 10.1126/science.220.4592.67
Reeves, C. V., Teasdale, J. P., & Mahanjane, E. S. (2016). Insight into the eastern margin of Africa from a new tectonic model of the Indian Ocean. In M. Nemčok, et al. (Eds.), Transform Margins: Development, Controls and Petroleum Systems. Geological Society London, Special Publications, 431, 299–322. https://doi.org/10.1144/sp431.12
Royer, J. Y., & Gordon, R. G. (1997). The motion and boundary between the Capricorn and Australian plates. Science, 277(5330), 1268–1274. https://doi.org/10.1126/science.277.5330.1268
Sandwell, D. T., Müller, R. D., Smith, W. H. F., Garcia, E., & Francis, R. (2014). New global marine gravity model from CryoSat-2 and Jason-1 reveals buried tectonic structure. Science, 346(6205), 65–67. https://doi.org/10.1126/science.1258213
Sandwell, D. T., & Smith, W. H. F. (2005). Retracking ERS-1 altimeter waveforms for optimal gravityfield recovery. Geophysical Journal International, 163, 79–89. https://doi.org/10.1111/j.1365-246X.2005.02724.x
Sauter, D., Sloan, H., Cannat, M., Goff, J., Patriat, P., Schaming, M., & Roest, W. R. (2011). From slow to ultra-slow: How does spreading rate affect seafloor roughness and crustal thickness? Geology, 39, 911–914. https://doi.org/10.1130/g32028.1
Sauter, D., Tugend, J., Gillard, M., Nirrengarten, M., Autin, J., Manatschal, G., et al. (2018). Oceanic basement roughness alongside magma-poor rifted margins: Insight into initial seafloor spreading. Geophysical Journal International, 212, 900–915. https://doi.org/ 10.1093/gji/ggx439
Sauter, D., Unternehr, P., Manatschal, G., Tugend, J., Cannat, M., le Quellec, P., et al. (2016). Evidence for magma entrapment below oceanic crust from deep seismic reflections in the Western Somali Basin. Geology, 44(6), 407–410. https://doi.org/10.1130/g37747.1
Scrutton, R. A. (1978). Davie fracture zone and the movement of Madagascar. Earth and Planetary Science Letters, 39(1), 84–88. https://doi.org/ 10.1016/0012-821X(78)90143-7
Ségoufin, J., Munschy, M., Bouysse, P., & Mendel, V. (2004). Map of the Indian Ocean, CGMW (Commission for the Geological Map of the World).
Ségoufin, J., & Patriat, P. (1980). Existence d’anomalies mesozoiques dans le basin de Somalie. Implications pour les relations Afrique-Antarctique-Madagascar. Comptes Rendus de l’ Académie des Sciences Série IIa:Sciences de la Terre et des Planètes, 291B, 85–88. Seton, M., Müller, R. D., Zahirovic, S., Gaina, C., Torsvik, T., Shephard, G., et al. (2012). Global continental and ocean basin reconstructions since
200 Ma. Earth Science Reviews, 113, 212–270. https://doi.org/10.1016/j.earscirev.2012.03.002
Sibuet, J. C., & Collette, B. J. (1991). Triple junctions of Bay of Biscay and North Atlantic: New constraints on the kinematic evolution. Geology, 19(5), 522–525. https://doi.org/10.1130/0091-7613(1991)019%3C0522:TJOBOB%3E2.3.CO;2
Srivastava, S. P., & Keen, C. E. (1995). A deep seismic reflection profile across the extinct mid-Labrador Sea spreading center. Tectonics, 14(2), 372–389. https://doi.org/10.1029/94TC02453
Tugend, J., Manatschal, G., & Kusznir, N. J. (2015). Spatial and temporal evolution of hyperextended rift systems: Implication for the nature, kinematics, and timing of the Iberian-European plate boundary. Geology, 43(1), 15–18. https://doi.org/10.1130/g36072.1
Tugend, J., Manatschal, G., Kusznir, N. J., Masini, E., Mohn, G., & Thinon, I. (2014). Formation and deformation of hyperextended rift systems: Insights from rift domain mapping in the Bay of Biscay-Pyrenees. Tectonics, 33, 1239–1276. https://doi.org/10.1002/2014TC003529 Vauchez, A., Tommasi, A., & Barruol, G. (1998). Rheological heterogeneity, mechanical anisotropy and deformation of the continental
lithosphere. Tectonophysics, 296(1-2), 61–86. https://doi.org/10.1016/S0040-1951(98)00137-1
Weissel, J. K., Anderson, R. N., & Geller, C. A. (1980). Deformation of the Indo-Australian plate. Nature, 287(5780), 284–291. https://doi.org/ 10.1038/287284a0
Whittaker, J. M., Muller, R. D., Roest, W. R., Wessel, P., & Smith, W. H. F. (2008). How supercontinents and superoceans affect seafloor roughness. Nature, 456, 938–941. https://doi.org/10.1038/nature07573
Zuber, M. T. (1987). Compression of oceanic lithosphere: An analysis of intraplate deformation in the central Indian Basin. Journal of Geophysical Research, 92(B6), 4817–4825. https://doi.org/10.1029/JB092iB06p04817