The Development of a Resource Allocation Methodology to
Support System Design
by
QUINTON NG
B.E.(Hon.) Civil Engineering, 1999 The University of Auckland
Submitted to the Department of Mechanical Engineering in Partial Fulfillment of the Requirements for the Degree of
Master of Science at the
Massachusetts Institute of Technology September 2002
C 2002 Massachusetts Institute of Technology All rights reserved
A u th o r ...
Department of Mechanical Engineering September 11, 2002
C ertified b y ...
David S. Cochran Associate Professor of Mechanical Engineering Thesis Supervisor
A ccepted by ...
Ain A.Sonin Chairman, Department Committee on Graduate Students
MASSACHUSETTS INSTITUTE OF TECHNOLOGY
The Development of a Resource Allocation Methodology to
Support System Design
QUINTON NG
Submitted to the Department of Mechanical Engineering on September 6, 2002 in partial fulfillment of the requirement for
the degree of Master of Science.
ABSTRACT
The objective of this thesis is first to present the development and application of a method to implement projects that support the axiomatic system design within an organization whose investment resources are constrained. The method presented is a new approach that leads to the selection of projects that axiomatically have the greatest benefit to the manufacturing system. The second objective of this thesis is to understand the organizational dynamics present during the adoption of an axiomatic design within an organization.
Axiomatic Design has proven to be a valuable means to understand and improve complex systems. Decomposing a system with the help of this method shows a path for implementation. The Manufacturing System Design Decomposition (MSDD) developed at MIT shows systematic linkages within a manufacturing system, and the design for an ideal manufacturing system.
With this knowledge "an ideal system" can be implemented if enough financial resources are available. In reality however, the budget is always tight and stakeholders need to understand where limited resources should be deployed to have the greatest impact upon the manufacturing system. The resource allocation methodology focuses upon how limited resources should be allocated to best meet the requirements of an ideal system.
Implementation of an axiomatic design such as the MSDD within an organization may require changes to the manufacturing environment. Existing literature has documented the dynamics apparent during a change initiative. However, organizations still struggle to adopt and implement a systematic manufacturing system. This thesis uses System Dynamics to study the adoption process within a manufacturing plant and compares it to behaviors presented in the literature.
Thesis Supervisor: David. S. Cochran
TABLE OF CONTENTS
The Development of a Resource Allocation Methodology to Support System Design ... 1
The Development of a Resource Allocation Methodology to Support System Design ... 1
T A B LE O F C O N TEN T S ... . ... 2 L IST O F F IG U R E S ... 4 L IST O F E Q U A TIO N S ... 5 L IST O F T A B L E S ... 5 C H A P T E R 1: Introduction ... 6 1 .1 M o tiv atio n ... 6 1 .2 T h esis O u tlin e ... 7
CHAPTER 2: Manufacturing Systems and Resource Allocation... 9
2.1 The Evolution of Manufacturing Systems ... 9
2.1.1 Manufacturing Prior to the Industrial Revolutions ... 9
2.1.2 The First Industrial Revolution ... 10
2.1.3 Second Industrial Revolution... 11
2.1.4 The Ford Production System and The Diversified Corporation of General Motors 12 2.1.5 The Toyota Production System (TPS) ... 14
2.2 M anufacturing System Design Framework ... 16
2.2.1 Systematic Approach towards Manufacturing System Design ... 16
2.2.2 Axiomatic Design... 17
2.2.3 Manufacturing System Design Decomposition... 21
CHAPTER 3: The Alignment of Manufacturing System Development and Resource Allocation 35 3 .1 In tro d u ctio n ... 3 5 3.2 Resource Allocation Strategy... 36
3.2.1 Project Linkage To Organizational Requirements ... 37
3.2.2 Organizational Synergy... 37
3.2.3 Axiomatic Approach to Project Development and Selection... 39
3.2.4 Organizational Flexibility ... 44
3.2.5 Development Timing ... 45
3.3 Resource and Project Design ... 45
3.3.1 The Path Dependency of Resources ... 46
3.3.2 Removal of Gold-plating ... 47
3.3.3 Risk Management... 47
3.3.4 Minimizing Bottlenecks... 48
3.3.5 Extracting the Maximum Latent Value from a Resource ... 48
3 .4 P roject E v alu ation ... 4 9 3.4.1 Net Present Valuation ... 49
3.4.2 Real Option Valuation (ROV)... 51
3.5 Physical Implementation... 56
3.5.1 Performance Measurement... 56
3.6 Resource Allocation Case Study ... 58
3.6.1 Product D elivery System ... 58
3.6.2 PDS Evaluation of Aircraft Manufacturer Y ... 59
3.6.3 Path Dependent Investment Potential for Aircraft Manufacturer Y ... 61
3.6.4 System Design Resource Allocation at Aircraft Manufacturer Y ... 61
3.6.5 Project Devleopment and Resource Allocation Implementation Steps ... 64
3.7 Conclusions from Project Development and Resource Allocation ... 65
CHAPTER 4: System Design Implementation within a Manufacturing Plant ... 66
4 .1 In tro d u ctio n ... 6 6 4.2 Introduction to Plant N ... 67
4.2.1 Plant N as a Living System ... 67
4 .3 Stakeh older A naly sis ... 69
4.3.1 The Local Trade Union (LTU) ... 70
4 .3 .2 M an ag em en t ... 7 2 4.3.3 Stakeholder Analysis Results ... 74
4.4 System Dynamics Model of Plant N Adoption of The System Design Approach.. 75
4.4.1 The Bass Model for Diffusion and Adoption ... 76
4.4.2 Reinforcing Change and Adoption ... 80
4 .5 Inhibitors to C hange ... 86
4.5.1 Infrastructure to Support Adoption... 86
4 .5 .2 R elev an ce ... 8 7 4.5.3 Commitment to Change ... 88
4.5.4 Performance Measurement... 89
4 .5 .5 G ov ern an ce ... 9 1 4.5.6 General resistance to Change ... 91
4 .6 C h apter C on clu sion s... 92
C H A P T E R 5: C onclusion ... 94
A PP E N D IX 1: R EFEREN CES ... 95
LIST OF FIGURES
Figure 2-1: Schematic of a typical high-speed line layout of assembly-type manufacturing
sy stem [L ow 2 0 0 1]... 13
Figure 2-2: Schematic of a typical departmental layout of machining-type manufacturing sy stem [C o chran 2 00 1]... 13
Figure 2-3: Production Sequencing Board. ... 16
Figure 2-4:Mapping between customer domain, functional domain and physical domain [M odified from Suh 1990]... 18
Figure 2-5:Zigzagging process of multi-level design decomposition [Modified from Suh 1 9 9 0 ] ... 1 9 Figure 2-6: M SD D D ecom position... 24
Figure 2-7: M SD D structure [Linck 2001] ... 25
Figure 2-8: Quality branch of M SDD [Zhao 2002] ... 26
Figure 2-9: Problem identifying and resolving branch of MSDD [Zhao 2002] ... 27
Figure 2-10: Predictable output branch of MSDD [Zhao 2002] ... 29
Figure 2-11: Delay reduction branch of MSDD [Zhao 2002]. ... 31
Figure 2-12:The operation cost branch of MSDD [Zhao 2002]. ... 33
Figure 2-13: The investm ent branch of M SDD ... 34
Figure 3-1: Capital Doom Loop [Extracted from Koyama and van Tassel 1998 page 144]. .36 Figure 3-2: Conversion process from monetary investment to monetary benefits... 39
Figure 3-3: Sensitivity of Benefit to Investm ent ... 41
Figure 3-4: Sensitivity of Benefit to Investment - Multiple FR Case ... 42
Figure 3-5: Total of sensitivity implementing DP-Q121... 43
Figure 3-6: Managing real options proactively. Extracted from Leslie and Michaels 1997, p a g e 1 2 ... 5 5 Figure 3-7: Product Delivery System (PDS) and the Six Requirements for System Stability 59 Figure 3-8: PDS Requirements Studied at Aircraft Manufacturer Y ... 60
Figure 3-9: FR Valuation without Path Dependency at Aircraft Manufacturer Y. ... 61
Figure 3-10: FR Valuation showing Path Dependency at Aircraft Manufacturer Y ... 62
Figure 3-11: A llow able Investm ent in each DP ... 63
Figure 4-1: Change Initiative Stakeholder Composition. ... 69
Figure 4-2: Simplified Causal Structure of Adoption at Plant N. ... 76
Figure 4-3: Bass Model for Adoption (from Sterman 2000) modified to describe adoption of the System Design initiative at Plant N for each stakeholder. ... 77
Figure 4-4: Modified Bass Model including changes in Adopter Behavior and increased complexity in the adoption process at Plant N for each stakeholder. ... 79
Figure 4-5: The Reinforcing Loop for Personal Results. ... 81
Figure 4-6: Senge et al 1999 'Because it Matters' Reinforcing Loop ... 81
Figure 4-7: Stock and Flow Structure of Internal Diffusion at Plant N ... 83
Figure 4-8: Senge et al 1999'Because my colleagues take it seriously' Reinforcing Loop. .. 84
Figure 4-9: Stock and Flow Structure of Adoption from Achieving Business Results. ... 85
Figure 4-12: Comparison of US and Japanese automotive production between 1947 and 1989
[W om ack et al 1990]. ... .. 90
Figure 4-13: G eneral Resistance to A doption ... 92
LIST
OFEQUATIONS
Equation 2-1: Design M atrix relating FRs to DPs. ... Equation 2-2:An Uncoupled Design. ... Equation 2-3: A Path Dependent Design. ... Equation 2-4 A Coupled Design... Equation 2-5: Equation 2-6: Equation 3-1: Equation 3-2: Equation 3-3: Equation 3-4: Equation 3-5: Equation 3-6: Equation 3-7: Equation 3-8: Equation 3-9: 19 20 20 20 Goal of a Manufacturing System ... 23First Level MSDD Design Matrix ... 23
Differential Form of Cost Matrix Element Rij ... 40
P artitioned [R ] elem ent ... 4 1 Investment Performance Sensitivity ... 42
Investment Performance Sensitivity ... 42
Investment Performance Sensitivity - Multi FR Case... 43
DP Investment Decision Equation... 43
Investment Performance Sensitivity - Multi FR Case... 44
Investment Performance Sensitivity - Multi FR Case... 44
Investment Performance Sensitivity - Multi FR Case... 44
Equation 3-10: Net Present Value Calculation [Needles et al 1990]. ... 50
Equation 3-11:Black Scholes Option Valuation Equation (Brailsford & Heaney page 698). 52 Equation 3-12: Path Dependency of Studied PDS Requirements at Aircraft Manufacturer Y ... 6 1 Equation 3-13: Path Dependency Contribution at Aircraft Manufacturer Y ... 62
Equation 4-1: Mathematical Representation of a modified Bass model for the adoption of the System Design Initiative at Plant N for each stakeholder. ... 78
Equation 4-2:Compact Mathematical representation of the modified Bass model for the adoption of the System Design Initiative at Plant N for each stakeholder. ... 78
LIST OF TABLES Table 2-1 Representations of Different Types of Design [Linch 2001]. ... 21
T able 3-1: T ypes of O ptions ... 53
CHAPTER
1: INTRODUCTION
1.1 Motivation
The System Design Approach has been established as a valid methodology for the design of manufacturing systems [Cochran 1999, Zhao 2002, Won 2002, Cochran and Won 2002, Cochran and Dobbs 2000]. In existing organizations, the implementation of the System Design method is contingent upon economically justifying changes to the existing manufacturing system, and the organizational adoption of the System Design (SD)
Approach.
The design of manufacturing systems is ordered by the SD Approach into a top-down structure. Customer needs are first established as the intention of the manufacturing system and their requirements are captured as functional requirements (FRs). The means to meet customer requirements are then described through design parameters (DPs). Functional requirements and design parameters are then decomposed until implementable design parameters become apparent. System Design requirements can best be achieved through an uncoupled or path dependent decomposition.
In existing organizations, to implement the SD Approach and its associated manufacturing system design decomposition generally requires changes to the present manufacturing system. Projects to change the manufacturing system need to be developed and evaluated according to their monetary benefit to the organization. The benefit of allocating resources to a project needs to be evaluated not only on the basis of the scarcity of the resource, but also on the impact a resource has towards achieving System Design objectives. The systematic allocation of resources enables organizations to identify and select projects that best meet the System Design requirements within any resource constraints.
As part of an organization's choice to adopt the System Design Approach, the organization may also need to change its manufacturing environment and associated organizational processes. Whilst the dynamics associated with organizational change have been documented within the literature, organizations have generally struggled to replicate the culture of
need to understand the dynamics that reinforce or inhibit the adoption of the approach and the Manufacturing System Design Decomposition (MSDD).
This thesis first aims to develop an economic basis to allocate resources into projects that are capable of implementing the System Design Approach within an organization with limited resources. Second, this thesis attempts to capture the organizational dynamics within a manufacturing plant as the plant adopts the SD Approach and implements the MSDD.
1.2 Thesis Outline
This thesis is comprised of three main chapters. Chapter Two provides a general review of manufacturing system development throughout time and its resource allocation structures. Chapter Three develops a resource allocation methodology to implement System Design projects within a brown-field manufacturing environment and links the methodology into traditional project development and evaluation techniques. Chapter Four uses system dynamics as tool to capture and analyze the adoption of the SD Approach of the different stakeholders within a manufacturing plant.
Chapter Two serves as a general review of the evolution of manufacturing systems and as an introduction to the MSDD and Axiomatic Design. The evolution of manufacturing systems from the first industrial revolution through to the twentieth century is reviewed. The review demonstrates how manufacturing resources were initially constrained by capital and technology, and how over time these constraints have eroded. As resource constraints have changed, new production systems have evolved to capitalize on resource allocation structures. The Axiomatic Design approach and the MSDD are introduced and discussed in detail. Axiomatic Design and the MSDD provide the underlying foundation to the resource allocation methodology developed later in this thesis.
Chapter Three discusses in depth the development of transition projects to further implement the System Design within an organization. The scope of this chapter focuses on three elements. First, to develop a resource allocation method to link manufacturing System Design objectives to other organizational projects. Second, to link resource allocation to
projects whose purpose is to implement the System Design. Finally, to extract the maximum benefits and economic value from these projects to the organization using traditional project
development and evaluation tools.
Chapter Four uses a case study at an automotive parts supplier plant to analyze the organizational dynamics surrounding the adoption of a new SD Approach. A System Dynamics model is developed to capture and analyze the dynamics that occur as part of the implementation of the MSDD and the System Design Approach. The key dynamics that drove adoption at Plant N are compared to those in the literature. Inhibitors to adoption at Plant N are also examined and compared to the literature. Corporate policy recommendations are then concluded from the System Dynamics model.
CHAPTER 2:
MANUFACTURING SYSTEMS AND RESOURCE
ALLOCATION
2.1 The Evolution of Manufacturing Systems
Manufacturing systems have evolved as the result of technological advancement and the shifts that have occurred in needs and wants of customers for manufactured products. The industrial revolutions brought technological developments that advanced the scope and scale of manufacturing operations. Later, visionaries (Sloan, Ford and Ohno) developed systems to allocate manufacturing resources to meet the needs, wants and desires of their customers.
2.1.1 Manufacturing Prior to the Industrial Revolutions
Prior to the first industrial revolution, the size and scope of production was limited with labor being the key constituent. Manufacturing was cared out either domestically or through a craft guide. Within the domestic system, work was "put out" by merchants to homes where different stages of the manufacturing process were undertaken. In the craft guides, work in progress was passed from one shop to another. Both the domestic and the craft guides created a market for each of the different work in progress stages. Resources in the manufacturing system were dispersed and were centered on labor (e.g. in the form of skilled craftspeople). Work was undertaken with people working from home and selling their wares back to merchants or through crafts people who then on sold their products to other crafts people to process further.
2.1.2 The First Industrial Revolution
The first industrial revolution was centered in England during the mid eighteenth century, and was driven by technological change. This revolution brought numerous machines and manufacturing methods, improved productivity, and increased the range of goods that could be manufactured [Hopp 2001]. Watt, Arkwright, Kay and Hargraves invented the steam engine, the water frame, the flying shuttle and the spinning jenny respectively [Hopp 2001]. These technological changes in England enabled capital to replace labor resources, and the consolidation of manufacturing resources into centralized production (factories) with economies of scale.
America adopted the English industrial revolution, and went further towards consolidating manufacturing resources through vertical integration. Vertical integration became popular in American manufacturing plants due to two reasons:
- America did not have the strong tradition of craft guilds as in England. American production primarily operated on the domestic system, where the skills in production were dispersed and there were no formal organized constituencies to block integration. This enabled vertical integration to take place more easily than England. m America's reliance on waterpower in 18t1 and 1 9 th centuries (the steam engine
invented by Watt was not popular till after the Civil war) created a manufacturing system constraint. Manufacturing plants had to be built close to a water wheel, which sent energy to the plant via a spinning shaft. This constraint lead to plants putting all their machines close to the water wheel leading to the consolidation of manufacturing processes.
The American industrial revolution also reintroduced the concept of interchangeable parts. Eli Whitney and Simeon North were contracted to produce 10,000 muskets for the US government [Hopp and Spearman 2000] and proved that interchangeable parts was a viable manufacturing strategy. Boorstein [1958] described interchangeable parts as "the greatest
highly skilled artisans and enabled production of different parts to be performed at different
locations. This enabled manufacturing resources to become specialized in a particular part rather than a complete product.
2.1.3 Second Industrial Revolution
The second industrial revolution was pioneered by the development of the railroads in the United States [Hopp and Spearman 2000]. The railroads brought about two key differences in the allocation of resources:
" The reliance upon external capital. The railroads were considerably capital intensive.
Capital and resources had to be raised from shareholders that would not directly manage the railroad. The creation of external capital enabled firms to vertically and
horizontally integrate.
" The railroads created a market for mass produced products e.g. iron rails, wheels and
spikes. This provided a catalyst for railroad suppliers to produce in mass.
- The introduction of accounting based performance metrics. The railroads focused on ton per mile costs. Mass retailers focused on gross margins and Marshall Field was tracking stock turns [Johnson and Kaplan 1987, Chandler, 1977].
With the creation of the railroads, the scale of manufacturing operations grew considerably. The steel industry was one of the first industries to move towards large-scale production. Carnegie brought the steel industry to unprecedented levels of vertical integration and efficiency. The goal of Carnegie's Edgar Thompson plant was "a large and regular output". This goal drove Carnegie to relentlessly exploit scale advantages and through increasing the velocity of throughput, Carnegie eventually became the most efficient steel producer in the world.
2.1.4 The Ford Production System and The Diversified Corporation of
General Motors
Henry Ford and Alfred Sloan played a significant role in the development of manufacturing corporations. Henry Ford was a pioneer of high-speed vertically integrated manufacturing. Ford is recognized as the founding father of mass production and Sloan is credited for the design of the diversified corporation.
Ford had strong views on the requirements and design of the production system including just in time manufacturing, the value stream methodology, error proofing and zero defects, continuous improvement and worker involvement, and work place cleanliness [Ford 1926]. Ford is best remembered for his achievements in vertical integration, using standardized interchangeable parts for the automobile, the concept of the moving assembly line and the division of labor (the original pioneer of scientific management and the division of labor being Frederick Taylor). Ford's "mass" production system evolved around unit cost reduction through reducing the number of products and their variability, standardization and simplifying operations. Reducing the number of product variations enabled the production system to continue the same production pattern for long periods of time at high speed without the need for frequent changeover. The simplification of worker tasks enabled workers to assimilate their tasks rapidly. Ford raised efficiency by breaking down the assembly sequence into simple repetitive tasks and distributing those tasks along a moving production line [Womack et al 1990].
Ford's initial moving assembly lines moved automobiles through the assembly process at a defined rate to bring the work to the operators at defined time intervals, enabling the division of labor, where operators completed only a single task in the assembly sequence and could thereby specialize in a task or operation. In comparison, previous automobile plants were craft shops where individual workers would put together entire sub-assemblies such as engines, by themselves. In this way, complex sub-assembling skills and artisans became unnecessary. Production speed could be increased and the unit cost was reduced.
The mass-type production was generally implemented with manufacturing resources consolidated into departments, where departments had very specialized resources that emphasized economies of scale. Figure 2-1 and Figure 2-2 demonstrate typical high-speed assembly department (line) and departmental machining typical of the Ford production system.
Cycle time for each operation (seconds)
2.4 3.8 7.4 4.2 3.7 3.7 3.1 7.4 5.8 5.1 4.4 6.2 4.3 4.7 5.5 3.4 5.7 5.7 3.8 6.6 6.6 2.2 4.6 3.5
10 20 30 40 50, 60, 70 0 90 100 110 120 130 14 10 16 10 10 19 20 20 20 23 20 From nventory W
To paint line
Figure 2-1:Schematic of a typical high-speed line layout of assembly-type manufacturing system [Low 2001].
INCOMING PINION INCOMING RINGK
GLEASON#116 ROUGHERS(57 (90 FORGIN(5 KASPER TURNINGLATHES
-[<D
-0-GASN#6(2)ANNE AL CE LL GLAO 16HE AT TREAT
GLEASON-G 4116 -- &-C ____<D ____
PRATT & WHiTNEY GRINDERS (14) FINISH ERS (64 ID HONINGOMACHINES (6) GLESG TREAT_ AR (1E) MATCATN_
ANNELCL HEAT LRAPR:
I LAON#1 BARNES DRILLS (4) SNYDERDRILL STANDARD DRILL GLEASON 606/607 GEAR CUTTERS (43)
GLEAN 17A ROLL TESTE RS (21)
WHEELABRATOR
SHOT- EEN (7) PACKOUT
Figure 2-2: Schematic of a typical departmental layout of machining-type manufacturing system [Cochran 2001].
The results of Ford's "mass" production system enabled Ford to able to produce and sell cars at approximately less than 40% of his competitors and double the wages of his workers. Resources were merged together further, as Ford vertically integrated the complete
production processes of an automobile at his River Rouge facility. In 1926, it took Ford just
81 hours to turn raw materials such as iron ore and coal and transform them into an
automobile [Ford 1926].
As Ford consolidated his company's resources and focused on complete vertical integration, Alfred Sloan had pioneered the paradigm of the organization, which he termed federal decentralization [Cray 1979]. The concept was to create a central staff that was responsible for strategy, whilst division leaders were responsible for operational decisions.
Sloan proposed that the resources of a company should be structured as a set of autonomous operating divisions, which are coordinated through a strong corporate office. Sloan's general office implemented the return on investment (ROI) concept from DuPont and developed new techniques for demand forecasting, inventory tracking, and market share estimation. Each division was tailored to operate and serve a particular market segment in line with Sloan's belief of, "A car for every purse and purpose." [Cray 1979].
This strategy enabled General Motors (GM) to achieve greater flexibility and customer satisfaction. GM was able to become the largest car manufacturer in America with 32.3% market share in 1929 [Hopp and Spearman 2001].
2.1.5 The Toyota Production System (TPS)
The evolution of components of the Toyota Production System initially evolved over a considerable time period. The structural development of TPS arose out of a crisis. The crisis for Toyota was the decline of the Japanese economy after the Second World War.
Initially the 1902 invention by Sakichi Toyoda for an automatic loom that would cease operation if any of the threads snapped [Ohno 1988] was the first example of TPS. This loom accomplished two objectives. Firstly it separated the operators from the work, and secondly the automatic stopping mechanism was a form of error proofing. As a result of Toyoda's automatic loom, operators were now able to control numerous looms, and defects and scrap
into designing machines that could stop and call immediately for attention if problems or errors occurred [Ohno 1988]. As Toyota diversified and entered the automobile business, Kiichiro Toyoda was sent to study the Ford production system
The economic circumstances of post war Japan however forced Toyota to shift away from the Ford production system and develop a production system suited to their own local economic conditions. Toyota did not have the resources to develop specialized equipment for each model and were not able to stock large inventories of stock at each stage of production [Womack et al 1996]. The low volume and the high mix of the post war Japanese auto-market required Toyota to develop general-purpose machinery that could be utilized on different vehicle model types [Womack et al 1996]. Toyota also needed to develop a system that would ensure reliable supplies of parts without a large inventory
[Womack et al 1996].
Ohno in 1956 visited the United States to observe US automobile plants. However, it was the
US supermarkets that captivated Ohno [Ohno 1988]. Ohno understood the similarities between supermarkets and his own work at Toyota. Ohno described a supermarket as a place where a customer could get what they wanted, at the time needed, and the amount needed [Ohno 1988]. As people purchase according to their needs, supermarket operators must make sure that customers are able to buy what they want at any time [Ohno 1988]. The speed and accuracy in which supermarket shelves were replenished became the backbone for information flow in the Toyota Production System, or what is commonly referred to as "pull" production.
Pull production enabled Toyota to divide manufacturing resources into components for a family of products (e.g. manufacturing cells for a product family) and link together these components through the information flow Ohno witnessed, in the supermarket. Ohno developed a number of tools to implement the supermarket system at Toyota, including Kanban as the primary means for communicating production information on the shop floor, and production leveling to reduce the impact of sudden swings in demand. Figure 2.3 is an example of a production sequencing board that levels production.
Production is sequenced once the level of production order cards reaches a trigger.
Migr 'N.Kroduction order cards are collected until
the trigger quantity is met.
Figure 2-3: Production Sequencing Board.
2.2 Manufacturing System Design Framework
2.2.1 Systematic Approach towards Manufacturing System Design
The evolution of manufacturing described in the previous section was initially driven by technological change, but later driven by economic and resource allocation parameters. Initially, the development of these manufacturing systems was centered on the scientific management approach, pioneered by Fredrick Taylor. The scientific approach was to break up the system into small understandable components, and then find solutions for each ofthese components in terms of operating practices and resources. For simple systems this approach was valid.
However, as manufacturing systems became more complex, the interrelationships between different sub-systems begin to govern the performance of the overall system. To overcome the deficiencies that arise through scientific management, a systematic approach needed to be established. The Manufacturing System Design Decomposition (MSDD) is a systematic approach for the design of manufacturing systems. The MSDD uses an axiomatic design approach, and starts with a top-down approach to meet the needs firstly of the overall
Changeover DAY DAY DAY DAY DAY DAY DAY DAY Interval 1-3 4-6 7- 10-12 13-15 16-18 19-21 22-24 Production Schedule F-150 (GREEN) Taurus (RED) Escape (BLUE) . .
2.2.2 Axiomatic Design
Axiomatic design establishes a scientific basis for system design. Despite the rise of the rapid technological growth in manufacturing that was considered above, there still remains many technological and societal problems that have been created through poor design practice [Suh 2001]. These problems arise as we continue to design empirically on a trial and error basis where:
- The merits between competing design options are not evaluated systematically. Design has evolved around intuitive and innate reasoning rather than scientific study [Suh 2001] and hence is not evaluated systematically.
- Design is currently viewed as being a non-structured process. Designers are not currently trained to view design as a structured process. Instead design is taught to be a subject that is not amenable to scientific rigor [Suh 2001].
Axiomatic design is a methodology to add structure and rigor to the design process, and ultimately establish a scientific basis for design. Axiomatic design is based upon two fundamental axioms that lead to a successful design [Suh 2001]:
- Axiom 1. The Independence Axiom. When there are two or more functional requirements, the design solutions must be chosen so that each functional requirement is satisfied in a predictable way.
- Axiom 2. The Information Axiom. The specified design solutions chosen should have the highest probability of requirement achievement.
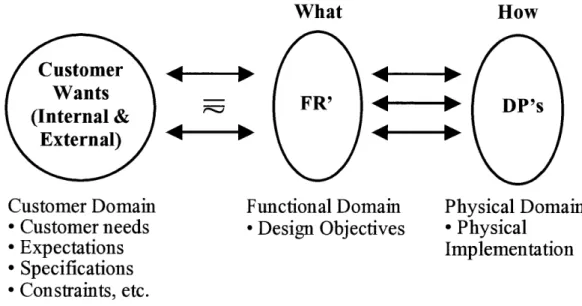
Axiomatic design defines the design as 'an interplay between what we want to achieve and how we want to achieve it.' [Suh, 2001] 'What we want to achieve' will come from the customer needs. The methodology identifies three basic domains as illustrated in Figure 2-4. The internal and external customer requirements can be captured in the customer domain. These requirements can then be translated into a set of objectives or functional requirements (FRs) in the functional domain. FRs are defined as the minimum set of independent
requirements, which completely characterize the functional needs of the customer. Depending on the FRs, design parameters (DPs) are designed to meet the FRs in the physical domain. Design parameters are the key solutions that logically satisfy the specified set of FRs.
Customer
Wants
(Internal &
External)
Customer Domain - Customer needs - Expectations - Specifications - Constraints, etc. What FR' Functional Domain - Design Objectives How DP's Physical Domain - Physical ImplementationFigure 2-4:Mapping between customer domain, functional domain and physical domain [Modified from Suh 19901
The axiomatic decomposition process is shown in Figure 2.6 below. Higher-level FR-DP relationships can be decomposed until physically implementable DPs have been achieved. It is highlighted that the system functional requirements are equal to customer needs. Customer needs are usually phrased in a non-scientific way with ambiguity and overlapping [Zhao, 2002]. The designer should define a set of unambiguous and independent specifications to be design FRs.
In most cases, the DPs designed for system FRs are not physically implementable. DPs could either be subsystems that need to be decomposed further in detail or just general design directions that need to be further decomposed into physically implementable solutions.
"Zig"
FRI DPI
"Zag
FR11 FR12 FR13 DPll DPl2 DP13
Functional Requirements Design Parameters Functional Domain Physical Domain
Figure 2-5:Zigzagging process of multi-level design decomposition [Modified from Suh 1990].
To decompose the high level FRs and DP pairs, zigzagging between the functional and physical domain is required. The design starts from the highest-level functional requirement FRI. FRI is satisfied by DPI. However, DPI is not physically implementable, so the design process returns to the functional domain and FRI is decomposed to FRi 1, FR12 and FR13. The composition of these lower-level FRs will depend upon the composition of FRI and the choice of DPI (choosing a different DPI would lead to different lower level FRs). Once FRI 1, FR12 and FR13 have been defined, the design returns to the physical domain and DP11, DP12 and DP13 are selected. This zigzagging continues until all the DPs are physically implementable. DPs that are physically implementable are referred to as leaf level DPs.
At a given level of a design hierarchy, the set of FRs that defines the specific design goals constitutes the {FR} vector in the functional domain. Similarly, the set of DPs in the physical domain that has been chosen to satisfy the FRs constitutes the {DP} vector. The relationship between these two vectors can be written as:
JFR [A11 A12 {DP
FR2 A21 A
2 2] *DP 2
2.2.2.1.1 Types of Design
When the number of DPs is equal to the number of FRs, axiomatic design identifies three main types of designs: uncoupled, path dependent (partially coupled), and coupled. Other designs where the number of DPs is not equal to the number of FRs, Suh [Suh 2001] has proved the design becomes either redundant or coupled.
To satisfy the Independence Axiom so that a design is predictable, the design must be either uncoupled or path dependent. An uncoupled design results when each FR can be satisfied independently by the means of only one DP, resulting in a diagonal matrix (see Equation 2-2). This design is the most robust. In the design matrix an 'X' signifies that a DPj affects FRI.
FR1 X - ~ DPx
FR2 - - DP2
Equation 2-2:An Uncoupled Design.
The second type of design is the path dependent design. This design results in a triangular matrix (see Equation 2-3) and the independence of FRs can be guaranteed if the DPs are implemented in the proper (path dependent) sequence.
FRI =X - KDP
FR2 JX X DP2
Equation 2-3: A Path Dependent Design.
Any other form of the design matrix is called a full matrix and results in a coupled design (see Equation 2-4). A coupled design violates the independence axiom and has a low probability of FR achievement, especially in the presence of DP variation. Such designs often require the designer to repeatedly tweak the DPs in hope of achieving the FRs. Hence, coupled designs create an optimization problem [Suh 2001].
FRJ ~X X DP
FR2 X X DP2
Table 2-1 Representations of Different Types of Design [Linch 20011. Uncoupled design Partially coupled design Coupled design
Mathematical IFRi lEXO 1.tDP, t FR, =[XO 1f.DP, t FRi=[X X1 fD1il
representation LFRJ 0 X DPJ FR2 X X DPJ FRJX X DP2 FR1 FR2 FR, FR2 FR1 FR2 Graphical representation . 7 DP1 DP2 DP1 DP2 DP1 DP2 FR2 FR2 FR2 DP2 Q L DC DP1 Illustration of DP1 DP1
path dependency FRI FRI FRI
going from A to
B
FR2(B) FR2(B) FR2(B)
FR2(A) A FR2(A) A FR2(A) A
FRI(A) FR1(B) FR1(A) FR1(B) FR1(A) FR1(B)
Table 2-1 provides a summary of the differences between the three types of design, their graphical representation and an illustration of how their path dependency affects the design [Linck 2001].
2.2.3 Manufacturing System Design Decomposition
Cochran and his group at MIT have used axiomatic design to create a framework called the Manufacturing System Design Decomposition (MSDD). The MSDD represents a logical map of the design for a stable manufacturing system that operates with the fewest resources [Cochran et al 2000]. The MSDD represents a system design in its entirety.
Various other attempts have been made to capture in a systematic manner the complex
system. However, some of these attempts have failed to be comprehensive [Cochran et al 2000], by either failing to communicate how lower level requirements affect the overall system [Hayes and Wheelright 1979], failing to identify the means to achieve higher level requirements [Hopp and Spearman 2000], or failing to separate the means from the requirements [Monden 1998].
The objective for axiomatic design and the MSDD is for every FR must be achieved, for the design to be complete. W. Edwards Deming, stated, 'Management objectives cannot be met
by unstable systems' [Demming 2000]. Cochran defines the six requirements (R) for system
stability as:
R 1. Provide a safe, clean, quiet, bright and ergonomically sound environment. R2. Produce the customer-consumed quantity every shift (time interval). R3. Produce the customer-consumed mix every shift (time interval).
R4. Deliver perfect-quality products to the customer every shift (time interval). R5. Do R2 - R4 in spite of operation variation.
R6. When a problem occurs in accomplishing R2 - R4, identify the problem condition immediately and respond in a standardized (pre-defined) way.
These attributes for a successful manufacturing system are discussed in a variety of writings [Cochran et al 2000] [Monden 1998] [Schonberger 1996] [Spear 1999]. The MSDD is an axiomatic design based framework that clearly separates the system FR and design DPs. The
MSDD decomposes the highest level FR for the manufacturing system into multiple levels
until the FR-DP pairs become implementable. This ensures that all DPs are consistent with the higher level FRs. The MSDD presents a partially coupled design that provides a framework to achieve the six requirements of manufacturing system stability.
Starting from the highest-level system FR/DPs, MSDD decomposes them to multiple levels of FR/DP pairs until all DPs become implementable. The decomposition therefore ensures all
detail DPs are consistent with higher-level system level FRs. The MSDD presents a decoupled design and provides a path towards FR achievement in a systematic manner. FRI is the highest level FR in the system, and should present the goal of the manufacturing system. The goal is defined by Hopp and Spearman [1996] as being 'the fundamental objective of a manufacturing firm is to increase the well being of its stakeholders by making a good return on investment in the long term '. FR 1 of the MSDD is hence defined as being 'maximize the long-term return on investment' and its DP, DPi is 'Manufacturing System Design'.
ROI = Revenue -Cost Investment
Equation 2-5: Goal of a Manufacturing System
The second level of the MSDD is derived from the ROI formula (Equation 2.6). FRI is influenced by three factors, the revenue produced from the manufacturing system, the costs involved in generating the revenue, and the investment required. These three factors can be translated into FR-11 Maximize sales revenue, FR-12 Minimize production costs, FR-12 Minimize investment over the production system life cycle. Their associated design parameters DP-1l Production to maximize customer satisfaction, DP-i2 Elimination of non-value adding sources of cost, and DP-13 Investment based on a long term system strategy. The design matrix for FR-in is partially coupled with DP-12 affects FR-11 and FR-12, and DP-13 affects FR-uI, FR-12 and FR-13 and can be expressed as follows:
FR-l1 X 0 0 DP-11
FR-12= X X 0 i P-12
FR-13 X X _ DP-13
Equation 2-6: First Level MSDD Design Matrix
The MSDD decomposition beneath FR-ln can be divided into six branches: quality, identifying and resolving problems, predictable outputs, delay reduction, operational cost, and investment. Figure 2.6 shows how these 6 branches relate to the six requirements of a manufacturing system.
R H
S
Quality Problem Predictable Solving Output Delay Reduction Operational Costs Figure 2-6: MSDD Decomposition
Figure 2-7 explicitly shows the relationship between MSDD branches and high-level FR-DP pairs. FR-DPi] is further decomposed into the first four branches; FR-DPJ2 is decomposed further in the fifth branch, and FR-DPJ3 is further decomposed in the sixth branch. The following discussion is based on each of the six branches.
zip E Cn lip CIO ZO 00 g zo 4W
4le
a-q'Y
FR-1 Maximize long-term retume on investment DP-1 Manufactuaing systesm deasi gn FR-11 FR-12 FR-13
Maximize sall s rave nue Minimize manufacturing Minimize investment
costs over produ clion system
I ~ ~ 1-- liec
--- I---
:---DP-11 DP-12 DP-13
Production to Elimination of non-value Investment based on a
maximize customer adding sources of cost long term strategy
satisfaclon
FR-111 FR-1 12 FRI13
Manufacture products to Deliver products on time Meet customer
target design expected lead time
spe cifications
--- ----
---DP-1 11 DP-1 12 D PI13
Producli on processes Throughput time Mean throughput time
with minimal variation variation reduction reducion
from the target
FR-R11 FR-P1
Respond rapidly to Minimize production production disruptions disruptions
DP-R1 DP-P1
Proedure for dcetection Predictable production
& response to resources (information, production disruptions eqiment, pople
idnfigad Predictable Delay Oper-tonal
Qualityreso~ngOutput Redoction Co sts ne mn
Figure 2-7: MSDD structure [Linck 20011
2.2.3.1 MSDD Quality Branch
FRIll Manufacture products to target design specifications forms the start of the quality
branch and is chosen as one of three FRs to meet DP-11 Production to maximize customer
satisfaction. The quality branch is primarily concerned with quality in terms of firstly
achieving the control limits of the process, secondly setting the target mean to the desired level and thirdly to reduce the process variation. DP1lJ Production processes with minimal
variation from the target is selected to satisfy FR-111. FR-DP pair FR-11l is decomposed
further into three lower-level FR-DP pairs. FR-QJ Operate processes within control limits,
FR-Q2 Center process mean on the target and FR-Q3 Reduce variation in process output.
Three DPs are chosen to address these FRs, they are DP-QJ Elimination of assignable causes
FR111
Menubc ire produce to target design specilicakons PM111 Process capabilty DP-111 Producion processes w hmininnal aton Prm the target FRQ1 FR-Q2 FRQ3
Operate processes Centerprosss Reduce vanieon in within control is mean on fie terget process ouput
PM-QI PM3
Numberofdelcs PM-.2 Varience ofprocess
pern parts mwitan Diferancebetween output assignable case proces mean and
target
DP-Q1 DP-02 EP-Q3
Elinination of Process pareraeter Reduclon of
assgnablecausesof adustnent process nose
FR-QI1 FR-Q12 FR-Q13 FR-Q14 FR-Q31 FR-Q32 Elfninate Eliminate Eliminate Erminatee Reducenoise Reduceinpact operator machine method manrial inprocess ofinputnoiseon assignable assignable assignable assignable input process ouiput
Causes causes Causes causes
PM-Q32
PM-QII PM-Q12 PM-Q13 PM-Q14 PM-Q3I Output
Weriter of Nurber of urrber of Nrrber of defcts Variance of variance
defectser n deftcteporn defeots per n per nS prcpsorutsrbt.iaa
Pats 3abe parts ige P rs ste assiie lo the Process iu I a
imerring rroweiWr
DP-QII DP-Q12 EP-QI3 DP-Q14 DP-Q31 DP-Q32 Stable output Failuremoda Process pIa Supplierquality Convesion of Robutpcs fromoperators andefeco design program common design
nalys causes into
assignable Causes
FW-Q111 FR-Q112 FR-Q113 Ensure tat Ensure hat Ensure fiat
koldg of ronisently eror dono
requied lsks perfrms lasks tenslate to defecs
correctly
PM41111 PM-Q113
Nrter of detete per PM4112 Mianber of defects per
n patsocsedtby an NunarOf defaut Per n Pa auedtby operataslikof nps cased by htian errer
urderstardramou no-starmrd
metods methods
DP-Qi1 DP-Q112 DP-QI13
Traxnlngprogram Standdwcrk Mislakeproof
m ehods operalons (Poks-Yoke)
Figure 2-8: Quality branch of MSDD [Zhao 2002]
Implementing DP-QJ Eliminating all sources of assignable variation, requires the consideration to of all of the sources of variation. These sources of variation can be broken into four contributory factors, operators, machines, operations and materials. Operator related variation requires standardization in order to be reduced. Figure 2-8 shows the full decomposition of the quality branch of the MSDD.
Standardization can come from operator training programs (FR-DP-QI11), standard work
-methods (FR -DP-QJ12), and applying mistake-proofing devices or Poke-Yoke
Machine assignable causes of variation can be understood from failure mode and effects analysis (FMEA), where the root cause of the variation can be identified and procedures developed to prevent them from happening again (FR-DP-Q12).
Operations based assignable causes of variation can be addressed with a carefully designed process plan (FR-DP-Q12).
Materials based assignable causes of variation can be reduced through a supplier quality program (FR-DP-Q14).
2.2.3.2 MSDD Problem Identifying and Resolving Branch
FR-RI Respond repidyt producion disruplors PM-R1 Time beween occunence and resolulonof disruptors DP-Ri Procedure for detecton & disruptors FR-Rhi FR-R12 FR-R13 Rapidy Communicee Sole problems recogrize probbms I he immedately producion rightpeople
disruptors
PM-R12 PM-R13
PM-R1 imrobetween T mebet ese I Mobeb en ideificationo eromtroesorce
oerce What the rdostandrU dsruption end dispton is and What the
letriffiooron of suppoflresorse dirpim is end
wht the urcartndrU problem
dsrGotion what the resolution disrution n
DP-Rii DP-R12 DP-R13
Conliguratonto Specifed Standard onea communiceton metodb deteceon of peasand idenlfyand
disruptors procedires elirnatsroot
FR-R111 FR-R112 FR-R113 FR-R21 FR-R122 FR-R123 Idenihy Idenikl Idenlywhat Idenfiycorrect Minimize delay Lnize"tme for disruptons disruptios thedruplonis spport incontecing Septwrtreeouce
when they where they resources correctsLpport uerdostnd
occur occur resources
PM.RiII PM-R112 PM-R113 PM-R121 PM-R122 MAeM
Time belmeen Timebeween Tirebetween Timebeween Timebetween certtof coet
occurrenice and ioisebooion of idetatonof ioertificlmof idenhicetion Suporteresune
recognion Rat deiniirn and wherde rptticn Rtthe andcontectof andsiepel
disrupton idvredcaonof wcuredo" dopon nd coectspport r
occurred wh"n the idriiainO idatiavo of resource ,nderstdt
dirtion whtte .e Crrt what tie
ucourred denwplonis Suppartmoue clisutoi DP-R1II DP-R112 DP-R113 MP-R12I DP-R122 DP-R123
Increased Simpilled Feedbackof Specified Repidsupport System at
operelr mranal low s tbsetam sppor contct conw what
sanrpinMgreaof pete sote resourcesr prucer edisrupons
oquipment each fiture
setus mode
The second branch of the MSDD, identifying and resolving problems in a predefined manner, addresses R6 and is shown as FR-DP-RJ. Identifying and resolving problems in a rapid predefined manner, evolves around three processes, firstly recognizing production disruptions as they occur (FR-R11), secondly communicating the problems to predefined organizational members who are able to respond to the problem (FR-R12) and thirdly the application of measures to solve the problem rapidly (FR-R13). The full decomposition the problem identifying and resolving branch is shown in Figure 2-9.
FR-R11 Identify disruptions as they occur, is addressed by DP-R1 1, which states that the configuration of the manufacturing system should be able to detect disruptions. The requirement to communicate problems to predefined individuals (FR-R12) is solved by DP-R12 and DP-R11, and is the combination of ensuring the system is able to detect disruptions, and by having paths of communication that are clear and effective. FR-R13 requires the achievement of DP-R11, DP-R12 and DP-R13. Hence, the system needs to be configured to detect disruptions, there should be clear communication channels, and procedures should be predefined so that problem can be resolved in as short a period as possible. Further zigzagging is accomplished to further decompose these FR relationships until they are leaf level DPs (Figure 2-9 shows the complete decomposition of the problem identification and delay reduction branch of the MSDD).
2.2.3.3 Predictable Output
The predictable output branch is the third branch of the MSDD, and begins by addressing DPI with FR-Pi Minimize production disruptions and its corresponding DP, DP-Pi
Predictable production resources. DP-PJ is achieved by ensuring the availability of relevant
product information (FR-P11), ensuring predictable worker output (FR-P12), ensuring predictable equipment output (FR-P13), and ensuring material availability even in the presence of fallout (FR-P14). These lower level FRs are decomposed further until leaf level physically implementable DPs are derived (see Figure 2-10 for the fully decomposition).
FRPI Mnimiza producion deruorns PM-P1 oc~oe of dtruptiors & Arrount of lime 1.1 to dsn.tors Predclble production resources (people, aqupment, info) FP-P11 FR-P12 FR#13 FR-PI4
Ensure Ensure Ensure Ensure material
availablityof Predicable Predictable aiablityawn
relevnt worker output equipment tough falout
production output exisls
inlbiaton
PM-P13
PP1 1 PM-P12 NPfurrtier Of PM-P14
Nuber of eUnter f pd on erex rt Nreq re Of
tekc oe o wortiorel due to erianned deLoCs due to
infrare opeoaenrs. serceuptlmteia
disrulptions, Anmirt of downtimA shortagas,
Ar r of 2 intarripeon rrre A irt of am-t of nter i n eme foperators 0 unpoanne Ftqrruptrontirre
dAiouSt donier shortet
DP-P11 DP-P12 PP-P13 D-P14
Capable nd MotIabdwork- Mintenience of Standard
reliable force equipment mawlpeial
inforrmaton perlrrming relablity replenishment symtim slinrdardwork approach
FR-Pi 21 FR-P122 FR-P123 FR-P131 FR-PI32 FR-P141 FR-PI 42
Reduce Ensure Do notinarrupt Ensure Serce fat Ensure hat Ensure proper vaabilityhof avlablityof producion r equipmentis equment Parb are c ming ofpert TaskcompleJon workers Worker easily regularly aAilablet arriegs
time allody ances seraceable dhe material
PMP122 handes
Numberof PM-P123
PM-P121 occurrences of Nibeir of PM-P131 PM-PI32 PM-P141 PM-P142
Variance in task operawr dlsruptions de to Amountoftme Frequencyof Numberof Paris completiont9 lalones, operoir required to equiement occurce dem ended
-Amountof all aria ser-Ace servicing of pers laperess interruptiontr equipment marketplace deliered
for worss shortages
allowates
DP-P121 DP-F422 =PP23 DPP3 PP32 CP-P 41 DP-MP142
Stardardwork Perfect a~e Marle eular SMOdar 0iitre
rrelhoc; to attendance system Will d*eg ed o preweniw "xre i dowrstriarn proe program cross-rained Serviceability maintenance po s openirs at
repeakabs program b Pacensob
processingme workeissys b-ms ra
Figure 2-10: Predictable output branch of MODD [Zhao 2002]
2.2.3.4 Delay Reduction
The delay reduction branch is the fourth branch of the MSDD and it branches out from
FR-T1-3. The branch decomposes delay into five categories of delay, lot delay, process delay,
run size delay, transportation delays and operational delays. Eliminating these delays will lead to improving mean throughput time (DP-T-13).
Lot delay is defined as when products are transferred between processes in large batch sizes. Individual parts must wait until all of the parts in their batch are processed before being able to move to the next process. Decreasing lot time delay is achieved through DP-TJ Transfer batch reduction (single pieceflow).
Process delay occurs as a result of machine processing time being greater than the rate at which parts arrive. Producing to customer takt eliminates process delay. In order to produce to customer takt, takt firstly must be defined (FR-T21), secondly the production cycle time must be equal to the defined takt time (FR-T22), and finally upstream parts arrive at the defined service rate (FR-T23). The corresponding DPs to achieve these FRs are: DP-T21 Definition or grouping of customer to achieve takt times with an ideal range, DP-T22 Subsystem enabled to meet the desired takt time (design and operation) and DP-T23 Arrival
ofparts at downstream operations according to pace of customer demand.
Run size delay is the result of the manufacturing system not being able to produce the customer required product mix. Products wait in the inventory area until the all of the customer required product types have been produced. The ability to manufacture the customer desired mix at every demand interval requires customer demand information be transferred to each process in the system (FR-T31) and the production run size be reduced to be sufficiently small (FR-T32). These FRs are achieved through the information flow design
(DP-T31) and change over time reduction (DP- T32).
In order to reduce operational delays (FR-T5), the system should be designed to avoid production disruptions (DP-T5). This would entail ensuring that support resources do not interfere with its production resources (FR-T51), production resources do not interfere with each other (FR-T52) and that support resources do not interfere with each other (FR-T53). These three requirements are met by DP-T51 Subsystems and equipment configured to separate support and production access requirements, DP-T52 Ensure coordination and separation of production work patterns and DP-T53 Ensure coordination and separation of support workpatterns, in a partially coupled manner.
The complete decomposition of the delay reduction branch is shown in Figure 2-11.
FRI13
Meet customer ixpected
lead tine
PM113
Differencebetween mean
throughput tirre and custorrrs expectediad
term
DP113
Mean throughput time
reduction
FR-T1 FR-T2 FR-T3 FR-T4 FR-T5
Redu e lot Reduce Reduce run Reduce REoduc
delay process delay sine delay transportation systematic
(catt edby r delay operational
PM-Tl PM-T2 PM-T3 PM-T4 delays
Inventory due Inventory due ITentory due Irwentory due to PM-T r
to lot si delay to proces c to run size transportation Production a pr
delay delay delay lost te to Inlrffer nces
among resources
DP- T1 DP-T2 DP-T3 DP-T4 DIP-T5 Reduction Of Production Production of Soystemosaterialflow
tnsfer batch designed for the desired mix oriented layout deign to avoid
sI= the takttims and quentity design production (singlo-pieco duing each Interruptions
nlow) demand Intarval
FR-T21 FR-T22 FR-T23 FR-T31 FR-T32 FR-T51 FIR-T52 FR-T53
Doins, Ensure that Ensure that parl Proudo Produce in BEure Mat Ensure that E-nsure that
takt timea(s) production arrival rate is knowledge of sufliciently support production support cycle time equal to service demanded small run sizes resorces don't resources resorcs
squab takt time rate (rg:r,) productmix iniarfe-ewih (peopla/automnat (P9PWOpl/UIMO
(parttypos andproduction on)don-tntarfars on)cdon't interfere
(prttrs ndresoUrCes wilh one another win one another quantities)
P11-1121 PM-T22 PM-T23 PM-T32 PM-T51 PM-T52 PM-T53 Has takt time Diff'orence Difference PM-T31 Actual run sizn Froduction tims Production Ims Froduction onme
been dlained? between between arrival Has this -target run sin lost te to lost te to lost due to
('rs/ No) production andservice information support prodiction support
cycle time and rates boon provided? resources resources resources
taktime (Vas/No) inarrerenceswien inorffrenceswilh interferenceswin
prodiction one anolher one another resotrces
DP-T21 DP-T22 DP-T23 DP-T3
hfnitonor Subsystem Arrival of prE at Inform
groupingof enabledtomeet dortseam flowfro customers t hedusiedtakt operations dowrs
achieve takt tts (design and accordng to pace custor tmeswtOm irn operolon) ofcustomer
ideal range demand
FR-T22 FR-T2 FR-T223
Ensure that Ensure that Ensure level autarenao cycle manual cycle cycle lime mix
times times taktltme
minimun takt
time
PM-T223
PM-T221 PM-T222 Is average Has this been Has this been cole time less
achieved? (Yes achieved? (Yes than takt time ir
/No) /No) desiredtime
interval?
DP- T221 DP- T222 DP-T223
Design of Design of Stagger appropriate appropriate production of autonatc work operator work parts with
content at each content/loops difierent cycle
station times
I DP-T32
etion Design quick
m changeoverfor
resim material er handing and
equement
DP-T51 DP-T52 DP-T53
Subsytms and Ensure Ensure
squiprrent coordiration coordination
contiguredto andseparation andseparation seporatesupport of production of support work srd produolton
accdssproin work patterns patterns
2.2.3.5 Operational Cost
The operational cost branch of the MSDD, is decomposed into three branch level FRs, firstly the requirement to reduce direct labor (FR-121), secondly the reduction or indirect labor cost (FR-122) and thirdly the reduction of facilities cost (FR-123).
Non-value adding activities of direct labor are decomposed into eliminating operators' waiting on machines (FR-D1), eliminating wasted motion of operators (FR-D2) and eliminating operators' waiting on other operators (FR-D3). Separating humans from the machines (DP-DJ) achieves FR-D1 Operators waiting for machines. FR-D2 eliminating the wasted motions of operator is achieved through DP-DJ and designing workstations and work loops to facilitate operator motion to achieve their tasks (DP-D2). FR-D3 is accomplished by designing balanced work loops to ensure all operators have the same cycle time (DP-D3). Reducing the waste in the indirect labor of the manufacturing system (FR-122) can be decomposed into two components, firstly to improve the effectiveness of the production managers (FR-Il), and secondly to eliminate information disruptions (FR-I2). Achievement of FR-Il is through the creation of self-directed work teams (horizontal organization)
(DP-I1). FR-I2 is accomplished through seamless information flow in the manufacturing system
(i.e. visual factory) (DP-I2).
![Figure 2-2: Schematic of a typical departmental layout of machining-type manufacturing system [Cochran 2001].](https://thumb-eu.123doks.com/thumbv2/123doknet/14732847.573437/15.918.144.778.526.912/figure-schematic-typical-departmental-layout-machining-manufacturing-cochran.webp)

![Figure 2-5:Zigzagging process of multi-level design decomposition [Modified from Suh 1990].](https://thumb-eu.123doks.com/thumbv2/123doknet/14732847.573437/21.918.138.699.106.388/figure-zigzagging-process-multi-level-design-decomposition-modified.webp)


![Figure 2-8: Quality branch of MSDD [Zhao 2002]](https://thumb-eu.123doks.com/thumbv2/123doknet/14732847.573437/28.918.203.823.105.701/figure-quality-branch-msdd-zhao.webp)
![Figure 2-10: Predictable output branch of MODD [Zhao 2002]](https://thumb-eu.123doks.com/thumbv2/123doknet/14732847.573437/31.918.134.753.107.691/figure-predictable-output-branch-modd-zhao.webp)
![Figure 2-11: Delay reduction branch of MSDD [Zhao 2002].](https://thumb-eu.123doks.com/thumbv2/123doknet/14732847.573437/33.918.130.788.238.968/figure-delay-reduction-branch-msdd-zhao.webp)