HAL Id: insu-00551322
https://hal-insu.archives-ouvertes.fr/insu-00551322
Submitted on 4 Jan 2011HAL is a multi-disciplinary open access
archive for the deposit and dissemination of sci-entific research documents, whether they are pub-lished or not. The documents may come from teaching and research institutions in France or abroad, or from public or private research centers.
L’archive ouverte pluridisciplinaire HAL, est destinée au dépôt et à la diffusion de documents scientifiques de niveau recherche, publiés ou non, émanant des établissements d’enseignement et de recherche français ou étrangers, des laboratoires publics ou privés.
porous materials.
Majda Bouzid, Lionel Mercury, Arnault Lassin, Jean-Michel Matray,
Mohamed Azaroual
To cite this version:
Majda Bouzid, Lionel Mercury, Arnault Lassin, Jean-Michel Matray, Mohamed Azaroual. In-Pore stress by drying-induced capillary bridges inside porous materials.. Journal of Colloid and Interface Science, Elsevier, 2011, 355, pp.494-502. �10.1016/j.jcis.2010.12.058�. �insu-00551322�
1 2 3 4 5 6 7 8 9 10 11 12 13 14 15 16 17 18 19 20 21 22 23 24 25 26 27 28 29 30 31 32 33 34 35 36 37 38 39 40 41 42 43 44 45 46 47 48 49 50 51 52 53 54 55 56 57 58 59
Revised version of the JCIS-10-1991 manuscript. Submitted November 25th, 2010
IN-PORE TENSILE STRESS BY DRYING-INDUCED CAPILLARY BRIDGES INSIDE
1
POROUS MATERIALS
2
Majda BOUZID1,2, Lionel MERCURY3,*, Arnault LASSIN4, Jean-Michel MATRAY2, Mohamed
3
AZAROUAL4
4
1
IDES, UMR 8148 CNRS/Université Paris-Sud, bâtiment 504, 91405 Orsay Cedex, France
5
2 IRSN, DEI/SARG/LR2S, BP 17, 92262 Fontenay-aux-Roses Cedex, France
6
3 Institut des Sciences de la Terre d’Orléans, UMR 6113 CNRS/Université d’Orléans, 1A rue
7
de la Férolerie, 45071 Orléans Cedex, France.
8
4 BRGM, Water Division, 3 av. C. Guillemin, 45060 Orléans Cedex 2, France
9
* Corresponding author: [email protected]. Tel: +33.(0)238.255.398; Fax:
10
+33(0)238.636.488
11
1 2 3 4 5 6 7 8 9 10 11 12 13 14 15 16 17 18 19 20 21 22 23 24 25 26 27 28 29 30 31 32 33 34 35 36 37 38 39 40 41 42 43 44 45 46 47 48 49 50 51 52 53 54 55 56 57 58 59 60 61 Abstract.
13
We present here some evidences that capillary liquid bridges are able to deform micrometric
14
cylindrical pores by tensile stress. Brine-soaked filter membranes are submitted to drying
15
conditions leading to NaCl precipitation inside the 5-10 µm pores. A close examination
16
demonstrated that two forms of NaCl crystallites are successively generated. First, primary
17
cubic crystals grow, driven by the permanent evaporation. When this angular primary solid
18
gets near the pore wall, while the evaporation makes the pore volume to be partly invaded by
19
air, capillary liquid can bridge the now-small gap between the halite angles and the pore wall.
20
In a second step, these small capillary bridges are frozen by a secondary precipitation event
21
of concave-shaped NaCl. The proposed interpretation is that the liquid capillary bridges
22
deform the host matrix of the membrane, and the situation is fossilized by the growth of solid
23
capillary bridges. A quantitative interpretation is proposed and the consequences towards the
24
natural media outlined.
25
Keywords: unsaturated zone, liquid water, tensile strength, poromechanics, soluble salts
26
1 2 3 4 5 6 7 8 9 10 11 12 13 14 15 16 17 18 19 20 21 22 23 24 25 26 27 28 29 30 31 32 33 34 35 36 37 38 39 40 41 42 43 44 45 46 47 48 49 50 51 52 53 54 55 56 57 58 59 1. INTRODUCTION
28
The porous or finely fractured unsaturated systems are widely present in natural systems,
29
like the non-saturated soils or the three-phases oil-depleted aquifers, as well as in
30
anthropogenized media like the excavation damaged zone around deep geological nuclear
31
waste disposals. Another common such systems are the building stones when extracted
32
from natural quarries, and exposed to drying-wetting cycles along an hydrological year. They
33
typically contain water suspended over air against gravity, by bridging the solid-to-solid pore
34
space owing to the capillary forces. The capillary state of the soil solutions has direct
35
consequences on the mechanical equilibrium and the chemical weathering at the pore scale.
36
The first effect is related to the time of the solid-aqueous solution interaction due to the
37
immobilization of the capillary solutions (e.g., [1-2]). Another effect depends on the
38
thermodynamic properties of a capillary liquid (and therefore its solvent properties) which
39
differ from those of the free liquid [3-10]. On the mechanical side, capillary bridges pull on the
40
solid(s) to which they are anchored, and so play a role in the compaction and the strength of
41
soils (e.g., [11-13]), and in general of any granular wetted stacks (e.g., [14-15]). Furthermore,
42
Scherer [16] and Smith et al. [17] for gels, Tas et al. [18,19] for massive solids (silicon chips),
43
gave grounds that the capillary bridges are able to mechanically deform solid matrix, even at
44
moderate capillary pressure.
45
In parallel, many field observations in the arid zones report the erosive role of the salts
46
precipitating in the micro-porous regions of rocks, due to the drying of the network. Salt
47
weathering is able to provoke the in situ breakdown of massive rocks like granite (e.g.,
[20-48
24]). That corresponds to coupled processes, interlinking chemistry and mechanics taking
49
into account the capillary state of the media. The Wellman and Wilson’s model highlighted
50
the role of the smaller pores and the salt precipitation inside them to provoke the most
51
efficient rock breakdown in coastal and arid environments. Scherer [16] highlighted the role
52
of the small pores by replacing the discussion in the context of the drying of any heterometric
53
pore network: as the large pores empty first, then the tension in the neighbouring small pores
1 2 3 4 5 6 7 8 9 10 11 12 13 14 15 16 17 18 19 20 21 22 23 24 25 26 27 28 29 30 31 32 33 34 35 36 37 38 39 40 41 42 43 44 45 46 47 48 49 50 51 52 53 54 55 56 57 58 59 60 61
may deform the pore wall and causes cracking (see especially the Fig. 7 in [16]). Meanwhile,
55
a lot of parameters are acting in these processes, as the host microstructural properties, the
56
environmental conditions, the interfacial tensions, or still the composition of the soaking
57
solution, and so the causal connections are very complex to decompose.
58
The present paper reports simple experiments targeting to illustrate how the capillarity may
59
take place in the salt weathering process. To do that, we decided to work with hand-made
60
saline solutions, (initially) saturating homogeneous simple pores under soft drying conditions.
61
After detailing the protocol and the main results, we will present a thermodynamic
62
interpretation of the successive events which includes the capillarity arising during the drying.
63
Clues of the occurrence of this capillary weathering in the fields are collected to outline the
64
potential importance of this effect in non-saturated media, submitted to drying-wetting cycles,
65
typically natural soils or the area around any excavated tunnels. However, the complexity of
66
such media makes this endeavour very exploratory, and worth to be deepened in the future
67
by field geochemists.
68
2. BACK TO CAPILLARITY
69
The conditions of occurrence of capillarity have been treated for long with the respective
70
roles of the pore radius (Young-Laplace law) and of the Relative Humidity (RH hereafter) of
71
air (Kelvin law) inside the system.
72
2.1 Young-Laplace law
73
The first capillarity ―Young-Laplace‖ law correlates the curvature of an interface with the
74
pressure difference across it. For a liquid-air interface:
75
2 11
1
r
r
P
LV (1a)76
with P = PL − PV is the pressure difference (in Pa) between the liquid phase (at PL) and the
77
air phase (at PV). As capillary menisci are concave towards the atmosphere, the liquid
78
pressure is lower than that of the atmosphere, possibly reaching negative values (commonly
1 2 3 4 5 6 7 8 9 10 11 12 13 14 15 16 17 18 19 20 21 22 23 24 25 26 27 28 29 30 31 32 33 34 35 36 37 38 39 40 41 42 43 44 45 46 47 48 49 50 51 52 53 54 55 56 57 58 59
called tensile or stretched liquid water) while vapour pressure is obviously always positive. r1
80
and r2 (in meters), are the main radii of curvature of the meniscus, and for spherical
81
meniscus: r1 = r2. The radius is counted negative for concave meniscus (positive for a
82
droplet), which maintains the correct sign balance between the two members of equation (1).
83
LV is the surface tension between the liquid water and the vapour in air, and its high value for
84
H2O at room temperature is one of the reasons allowing the liquid water to to undergo high
85
curvatures.
86
2.2 Capillary-elastic pressure for solids
87
The Young-Laplace law also applies to the solid-air interface and writes for a spherical
88
interface:89
2 11
1
r
r
P
SV (1b)90
with P = PS – PV is the pressure difference (in Pa) between the solid phase (at PV) and the
91
air (at PV); SV is the surface tension between the air and the solid having a concave spherical
92
curvature toward the air defined by r1 and r2.
93
One possible ambiguity comes from the twofold origin of the ―solid pressure‖ parameter.
94
Actually, it can be related to both an energy concept (chemical free energy of the solid) and a
95
mechanical concept (surface stress). Cahn [25] outlined that the solid surfaces can change
96
either by creating or destroying surface at constant surface structure and properties, or by an
97
elastic strain along the surface at constant number of surface lattice sites. The first case
98
requires a chemical driving force correlated to the surface free energy (work of creating a unit
99
area of surface), the second requires a mechanical driving force correlated to the surface
100
stress (work of elastic deformation of the surface). When one applies principles of capillarity
101
to solids, the pressure jump across the interface and the corresponding shape of the
102
interface obviously refer to a Gibbs free energy effect. It is why the capillary pressure jump is
103
sometimes called the capillary-elastic pressure (e.g., [26]).
1 2 3 4 5 6 7 8 9 10 11 12 13 14 15 16 17 18 19 20 21 22 23 24 25 26 27 28 29 30 31 32 33 34 35 36 37 38 39 40 41 42 43 44 45 46 47 48 49 50 51 52 53 54 55 56 57 58 59 60 61
The chemical potentials of the naturally shaped solids are tabulated so that to meet the
105
known solubility (in aqueous solutions) at normal conditions. In this sense, these chemical
106
potentials are the 105 Pa reference. Any perturbation of the system pressure makes the
107
chemical potential to vary by the VS.dP term, VS being the (assumed) constant solid volume.
108
It follows that the Young-Laplace law applied to a solid-air equilibrium can be rewritten as:
109
2 11
1
r
r
V
P
SV S S
(1c)110
Where µS = µsolid,1bar - µcapillary solid is the difference in the chemical potentials between the two
111
forms of the given mineral. Equation (1c) correlates the shape change of a solid as a function
112
of the capillary state inside the studied system to a solid pressure variation through the usual
113
surface tension parameter.
114
2.3 Kelvin law
115
The second capillarity ―Kelvin‖ law makes clear that the driving force to ―capillarize‖ is the
116
difference between the chemical potentials of the two partners separated by the curved
117
interface. Again, for one liquid-air interface, that writes:
118
10 ln . log RT V P p p L (2)119
where p and p°, in Pa, are the pressure in equilibrium with, respectively, the curved and the
120
plane interface; VL, in m3/mol, is the molar volume of the liquid, stated constant as a function
121
of PL; P is the Young-Laplace pressure difference across the interface (equation 1a).
122
3. PROTOCOL AND EXPERIMENTAL TECHNIQUES
123
Polycarbonates membranes (filters) having homogeneous pores, in size (10 and 5 µm) and
124
shape (cylindrical), are soaked with brines in a Petri cell filled with the suitable solution (see
125
below). After, they are put in a drying chamber under fixed relative humidity (RH hereafter) of
126
air, set to favor the water evaporation which should lead to the precipitation of solid salts
1 2 3 4 5 6 7 8 9 10 11 12 13 14 15 16 17 18 19 20 21 22 23 24 25 26 27 28 29 30 31 32 33 34 35 36 37 38 39 40 41 42 43 44 45 46 47 48 49 50 51 52 53 54 55 56 57 58 59
inside the initially large and cylindrical pores. After 15-20 days, the remaining brine is
128
removed and the filters are directly observed by scanning electron microscopy (SEM).
129
3.1 Filters
130
The basic materials are polycarbonate membranes (Nuclepore, Whatman), whose pores are
131
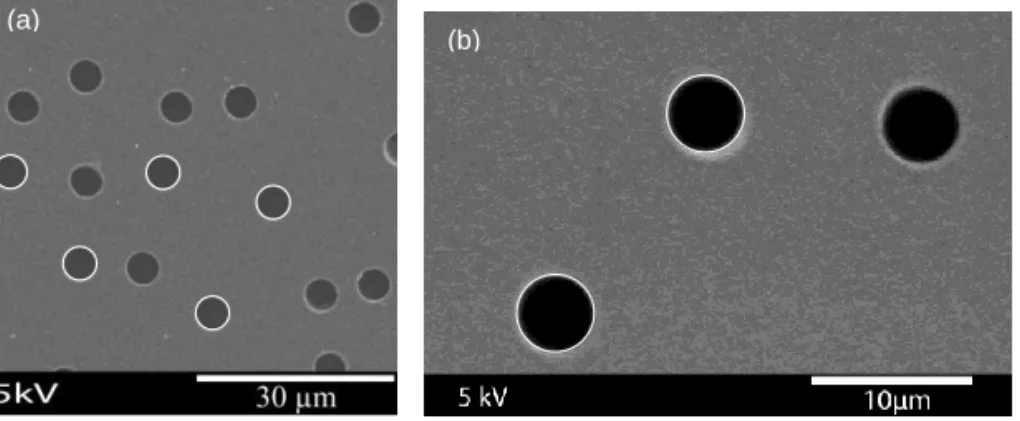
drilled by laser resulting in a perfect round shape (Fig. 1).
132
1
(a)
(b)
133
Figure 1. (a). Micrograph of a pristine membrane. Note the roundness and the regularity of
134
the pores (highlighted by a white circle of the exact scaled size). (b) Micrograph of a
135
membrane processed with pure water: pores after drying are always perfectly round.
136
The reproducibility of the drilled shape is very good as exemplified by the white circles, all of
137
the expected scaled size. The pores are scattered on the whole surface (membrane
138
diameter: 47 mm), and the depth of each pore equals the thickness of the membrane, around
139
10 microns. The membranes are made of polyaliphatic carbonates and so are totally
non-140
hygroscopic, especially toward the atmospheric moisture. To test the stability of the pore
141
geometry throughout the drying process, irrespective of other geochemical event, we
142
compared the before-after states with one membrane soaked in pure water (Fig. 1b). It
143
becomes obvious that the pristine membrane (Fig. 1a) and the water-treated one (Fig. 1b)
144
are identical, establishing that the protocol, especially the drying stage (see below), is not
145
able to modify the pore geometry. That is consistent with the hydrophobic behaviour of the
146
polycarbonate itself.
1 2 3 4 5 6 7 8 9 10 11 12 13 14 15 16 17 18 19 20 21 22 23 24 25 26 27 28 29 30 31 32 33 34 35 36 37 38 39 40 41 42 43 44 45 46 47 48 49 50 51 52 53 54 55 56 57 58 59 60 61
3.2 Salt solution and solid salt
148
The sodium chloride (NaCl) is commonly encountered in salt crystallization decay and is
149
frequently used for salt crystallisation laboratory tests (e.g., [27-28]). A vast literature deals
150
with what happens when saline solutions evaporate in pores, and the subsequent phase
151
transitions (e.g., [29-33]). This background gives us a large amount of very useful
152
observations and measurements, but also relevant ideas on protocols and experimental
153
methods.
154
Under room conditions, the sodium chloride–water system has one stable phase: halite
155
(NaCl). The aqueous solutions are hand-made (NormaPur powder, Prolabo; milli-Q water)
156
close to saturation: concentration is 5.5 mol/kg, at equilibrium with a 77% RH of air and
157
slightly undersaturated with respect to halite (saturation is at 6.2 mol/kg at 25°C and 0.1
158
MPa).
159
3.3 Experimental procedure
160
The filters are individually soaked in the experimental solution, and then stacked upon each
161
other (about ten) in a cylindrical container having the same 47 mm diameter as the filters.
162
The container contains only the wetted filters (no free solution inside) and is put in a dry
163
chamber where RH (75%) and temperature (20°C) are controlled. The RH is maintained
164
constant by a saturated solution of NaCl put at the bottom of the dry chamber, and is
165
recorded with a humidity/temperature data logger (EL-USB-2, LASCAR-Easylog): it never
166
changed outside the ± 5% precision along all the experiments. The saturated bottom solution
167
maintains slightly dry conditions inside the chamber, with respect to the (slightly)
168
undersaturated solution trapped inside the filters (75% against 77%). By that way, we
169
ensured a moderate evaporation, propitious to let the system adjust to geochemical and/or
170
mechanical changes.
171
After 20 days in the dry chamber, the membrane located in the middle of the ―membranes
172
cake‖ is sampled and rinsed by vacuum filtration with water-repellent solvent (cyclohexane).
173
The apolar solvent is poured onto the filter and is drawn throughout into a flask below by a
1 2 3 4 5 6 7 8 9 10 11 12 13 14 15 16 17 18 19 20 21 22 23 24 25 26 27 28 29 30 31 32 33 34 35 36 37 38 39 40 41 42 43 44 45 46 47 48 49 50 51 52 53 54 55 56 57 58 59
vacuum. The filtration time was shorter than one minute, and the applied vacuum was a
175
classic primary vacuum with the residual gas pressure (in the flask) around 15x102 Pa
176
(around 98% vacuum). By that rinsing, we searched to fossilize the situation inside pores at
177
the dry chamber state, extracting the aqueous solution remaining at this time. After, the
178
rinsed membranes were gold/palladium-coated to enable the filter be observed with high
179
vacuum SEM. By that way, we targeted to directly see what happened in the pores during
180
the drying, which have been fossilized by the preparation procedure. These observations
181
were performed at the IRSN laboratory of Fontenay-aux-Roses with a HITACHI S-3500 N.
182
3.4 in situ observation
183
The vacuum conditions of the SEM stage may cast doubt that the secondary solids
184
precipitated in pores are really associated with the drying conditions of the chamber and not
185
with the experimental procedure (especially the SEM stage). The problem is to warrant that
186
the rinsing procedure actually expels the water retained in pores. Due to the importance to
187
avoid any artefact, we also made some cross observations with an environmental scanning
188
electron microscope (ESEM, FEI Quanta 200F) at the School of Mines of Ales (France). The
189
sample was taken in the drying chamber and directly put in the microscope (neither filtration,
190
nor metallization, nor any vacuum), set up to the same (T, RH) conditions as those existing in
191
the drying chamber (75%, 20°C).
1 2 3 4 5 6 7 8 9 10 11 12 13 14 15 16 17 18 19 20 21 22 23 24 25 26 27 28 29 30 31 32 33 34 35 36 37 38 39 40 41 42 43 44 45 46 47 48 49 50 51 52 53 54 55 56 57 58 59 60 61
193
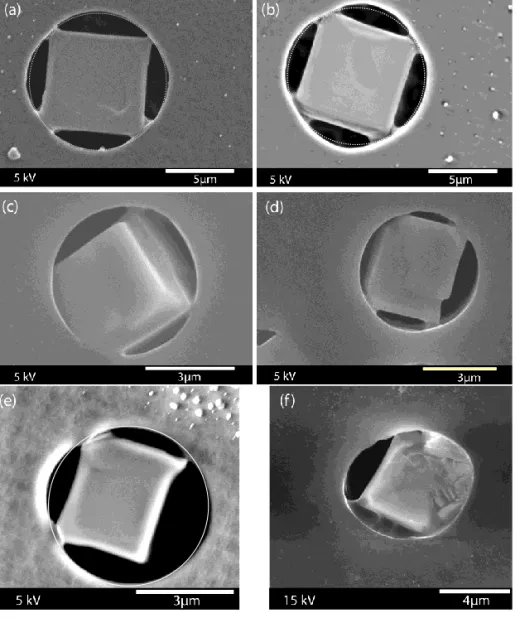
Figure 2. NaCl having grown in pores during 20 days at 75% RH (73 ± 2% RH for 2f) and
194
20°C, as displayed by SEM (a-d) and ESEM (e-f). (a-b) pore diameter = 10 µm; (c-f) pore
195
diameter = 5 µm. Two generations of NaCl are visible: a primary cubic massive crystal and
196
an often-curved secondary one.
197
The SEM (Figs 2a-d) and ESEM (Figs 2e-f) pictures show the same main features: one
198
crystal grown in the pore, and able to deform the membrane when it interacts with it. This
199
similarity gives ground that the cyclohexane rinsing effectively expelled the pore brine. As the
200
quality of the observation is better with the SEM micrographs at a much lower cost, almost all
201
pictures were recorded with SEM. Actually, the ESEM experiences were not able to keep
202
stable conditions, and after around 10 minutes, systematically showed strong deformations
203
of all the pores membranes, irrespective of any salt precipitation but due to drier conditions
204
than those set on. That prevented us to directly observe the whole process described below.
1 2 3 4 5 6 7 8 9 10 11 12 13 14 15 16 17 18 19 20 21 22 23 24 25 26 27 28 29 30 31 32 33 34 35 36 37 38 39 40 41 42 43 44 45 46 47 48 49 50 51 52 53 54 55 56 57 58 59 4. RESULTS
206
Under the drying conditions, the brine filling the pores of the membrane concentrates so that
207
NaCl can precipitate in pores. A cubic (natural shape) crystal develops in the centre of the
208
pore, and, very often (not to say always), develops NaCl-membrane interactions at those
209
corners that are close to the membrane (Fig. 2). According to Sunagawa [34], the cubic
210
shape is characteristic of a NaCl growth at low supersaturation, in quasi-equilibrium with the
211
solution. That means, as expected, the drying process does not proceed violently thanks to
212
the low RH gradient, and allows the cubic NaCl to grow in the whole volume (see especially
213
Figs 2c,d). In addition to this highly reproducible habit, two observations are worth to be
214
noticed on the micrographs.
215
- An ellipsoidal deformation of the global pore, visually in line with the touching corner(s) of
216
the grown NaCl. The deformation clearly corresponds to a pulling effect from around the
217
touching corners;
218
- At these touching corners where the deformation is maximal, we observe (more or less
219
developed/visible) NaCl precipitates with a concave curvature toward the air.
220
4.1 Membrane deformation
221
The first observation, though surprising, is checked in every membrane, and establishes the
222
fact of the in-pore traction. We hypothesize that this traction emanates from the liquid
223
capillary bridges, taking place at the halite-pore contact during the drying process (see fig.
224
2f). This initial liquid traction is relayed by the solid traction when the capillary bridges turn to
225
be solid, and so the deformation is maintained in the pore. Additionally, the sample displayed
226
on figures 2a and b has been rinsed with pure water, two years after the initial soaking stage,
227
and observed again (Fig. 3). It appears clearly that the membrane keeps its deformation,
228
approximately at the same intensity (strain around 3% in the vertical plane of the figure 3a,
229
for instance). This observation points to a (at least partly) irreversible behaviour during the
230
deformation though the micro-mechanisms involved are unknown.
1 2 3 4 5 6 7 8 9 10 11 12 13 14 15 16 17 18 19 20 21 22 23 24 25 26 27 28 29 30 31 32 33 34 35 36 37 38 39 40 41 42 43 44 45 46 47 48 49 50 51 52 53 54 55 56 57 58 59 60 61
232
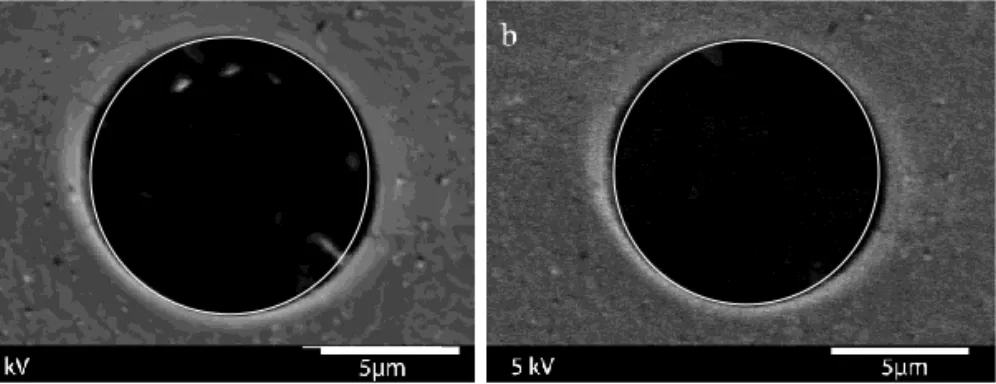
Figure 3. Two pores of the 10 µm membrane of figure 2, once the precipitated salts were
233
removed by dilution. The membrane keeps deformed and seems micro-cracked,
234
demonstrating the potential geomechanical power of the in-pore capillary traction.
235
Furthermore, the figures 3a and 3b shows a sort of halo all around the pore, approximately
236
0,7 µm width, with seemingly micro-cracking located at the previous most deformed places
237
(see especially the top left quadrant). A similar halo of the same size is visible on the figure
238
3b (see also a micro-crack in the bottom right quadrant), though less clearly. These
239
observations would tend to indicate that the deformation propagates inside the membrane
240
and starts disrupting the cohesion of the polycarbonate polymer. This conclusion remains
241
surprising because the tensile strength of the polycarbonate polymers ranges over
550-242
750x105 Pa (see below the values of capillary pressure, around 10x105 Pa) and that an
243
elongation of at least 80% (instead of our 3%) is required to break the material
244
(―polycarbonate‖ item in Wikipedia). We hypothesize that the duration of the traction (two
245
years), though weak, should have led to these first micro-cracks. Also, as the deformation is
246
located on tiny contacts, it is possible that the corresponding local elongation reaches high
247
values.
248
To go further, the deformation can be measured directly on the micrographs and the
249
corresponding traction thus evaluated. With the figure 2a, taken the distances at the
250
equatorial plane of the circle, we measure an ellipsoidal elongation of maximum 0.33 µm
251
(over 10 µm diameter), saying a 3% variation. For the sake of comparison, Tas et al. [18]
252
measured a 7.5% deflection in the centre of rectangular 100 nm channels, filled with capillary
253
water.
1 2 3 4 5 6 7 8 9 10 11 12 13 14 15 16 17 18 19 20 21 22 23 24 25 26 27 28 29 30 31 32 33 34 35 36 37 38 39 40 41 42 43 44 45 46 47 48 49 50 51 52 53 54 55 56 57 58 59
This deformation only affects the membrane, while the cubic halite remains straight. This
255
differential behaviour can be accounted for by comparing the Young’s modulus of the two
256
solids: 2.2x10⁹ Pa for polycarbonates (e.g. ―polycarbonate‖ item in Wikipedia), and at least
257
20x109 Pa for the halite (as an ionic solid).
258
Tas et al [18] measured a 7.5 nm deflection of their 0.8 µm capping silicon layer (E = 70x109
259
Pa), which requires a water pressure of -17x105 Pa ± 10 assuming a total transmission of the
260
capillary forces to the solid (no adhesion effect, [19]). The polycarbonate is 30 times softer
261
than the silicon, and the length variations is 2.5 times smaller in the polycarbonate
262
experiments: at constant geometry, we should expect that the capillary pressure in our
263
experiment is 12 times weaker than that in the nanochannels experiment, namely roughly
264
-1.5x10⁵ Pa. This last value certainly underestimates the real one due to the difference in the
265
geometries of the pulling bridges. We can safely pretend that the right value should range
266
between this low value up to an upper limit, saying one order of magnitude higher (-15x105
267
Pa).
268
4.2 NaCl capillary bridges
269
The second surprising observation is the occurrence of curved NaCl in contact with the
270
primary massive cubic NaCl. The 2a,b figures, taken in the same 10 µm membranes, are the
271
most impressive displaying very clearly capillary bridges at the contacting NaCl corners. As
272
these are SEM micrographs, the capillary bridges are forcibly NaCl-made and have
273
approximately the same curvature, 0.70.1 µm. The uncertainty is pretty large since it is
274
difficult to be sure that we really observe the very contact between the two sides of the
275
bridges. Also, the figures 2c,d (5 µm diameter pores) display less visible (NaCl) capillary
276
bridges, associated with a less pronounced deformation: approximately 0.09 µm on a 5 µm
277
diameter (1.8% variation), that is to say twice less than the deformation displayed on figures
278
2a,b. Therefore, it appears that the global deformation of the pore depends on the size of the
279
bridge as well as the intensity of its internal traction.
1 2 3 4 5 6 7 8 9 10 11 12 13 14 15 16 17 18 19 20 21 22 23 24 25 26 27 28 29 30 31 32 33 34 35 36 37 38 39 40 41 42 43 44 45 46 47 48 49 50 51 52 53 54 55 56 57 58 59 60 61
The curvature of the NaCl bridges can serve to evaluate the capillary pressure existing inside
281
the capillarized solid. We write:
282
) cos( 2 1
h r (3)283
where is the contact angle between the solution and the pore wall or NaCl crystal, and
284
the angle between the cubic halite and the pore wall at the junction point (Fig. 4b). The two
285
main radius of curvature of the capillary meniscus (see equation (1)) simplifies, because r2 is
286
largely higher than r1. A simple geometrical relationship (Figs 4c,d) relates the r1 in the
xy-287
plane to the distance separating the two solids h, while the r2 is related to the length pore e.
288
As the e distance is quite larger than the h distance (Fig. 4d), and with the absence of
289
perpendicular solids on the yz-plane, the 1/r2 term can be neglected.
290
291
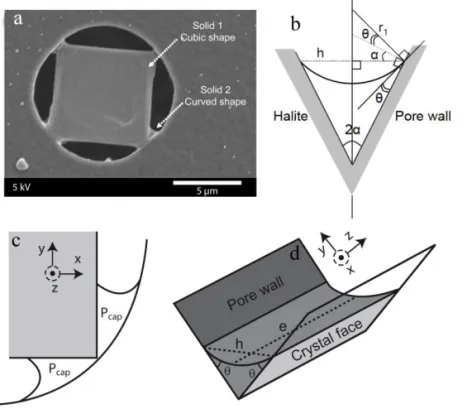
Figure 4. (a) NaCl SEM micrograph showing the massive form (―solid 1‖) precipitated from
292
bulk evaporating solution and the curved form (―solid 2‖) which records the capillary
293
conditions of the mother solution. (b) Geometrical Young-Laplace parameters according to
294
the NaCl-pore wall contact. (c) Sketch showing the capillarized solution trapped between the
295
NaCl primary crystal and pore membrane wall, before the secondary precipitation. (d)
296
Meniscus curvature between the two solids (NaCl crystals and pore wall) in the yz-plane.
1 2 3 4 5 6 7 8 9 10 11 12 13 14 15 16 17 18 19 20 21 22 23 24 25 26 27 28 29 30 31 32 33 34 35 36 37 38 39 40 41 42 43 44 45 46 47 48 49 50 51 52 53 54 55 56 57 58 59
Combining equations (1) and (3) gives the pressure drop across the solid meniscus:
298
h
P
P
P
SV ridge CapillaryB atm cap)
cos(
2
(4)299
Based on measurements from the micrographs 2a,b, the distance h between the two solids
300
was estimated to 0.7±0.1 µm, the contact angle between the pore wall and the bridge is put
301
to 0° because the real halite-membrane contact is not precisely visible, and the angle is
302
measured to around 21°. The SV term is the NaCl-air surface tension, equal to 200 mJ.m
-2
303
[35]. With these values, equation (4) predicts a pressure drop of 5x10⁵ Pa. For an ambient
304
atmospheric pressure (Patm = 105 Pa), the capillary pressure existing in the curved solid is
305
therefore around -4x10⁵ Pa, which is close to the previous estimate (-1.5x10⁵ Pa).
306
4.3 Size effect and bridge traction
307
The above micrographs constitute firm grounds that capillary bridges of the mother solution
308
existed at the NaCl-membrane corners during the drying and were replaced later by solid
309
capillary bridges. Otherwise speaking, the aqueous solution filling the wedge formed
310
between the cubic corner and the pore membrane first capillarizes significantly, owing to the
311
small distance from one solid to the other (h parameter in equation 4). It is clear that the
312
distance between the NaCl corner and the pore must be reduced sufficiently for a capillary
313
liquid bridge to form, prior to the precipitation of the secondary curved NaCl. The free corner
314
on figure 2e (bottom right) exemplifies this point: the corner-wall distance is too large and
315
prevents a capillary liquid bridge (and therefore a secondary curved solid) from taking place.
316
The figure 2e displays a regular shape in the bottom right quadrant which leads us to another
317
conclusion: whenever the precipitated salt and the pore wall are not bridged, no deformation
318
occurs on the corresponding section of the surrounding solid, except that depending on the
319
three anchorage points. This seems a firm fact (in our opinion) that the observed strain is
320
controlled by the bridges.
321
A last observation is worth to be outlined about the tri-dimensional shape of the capillary
322
323
1 2 3 4 5 6 7 8 9 10 11 12 13 14 15 16 17 18 19 20 21 22 23 24 25 26 27 28 29 30 31 32 33 34 35 36 37 38 39 40 41 42 43 44 45 46 47 48 49 50 51 52 53 54 55 56 57 58 59 60 61
bridges extend inside the depth of the pore, especially when examining the bridges at the top
324
right corners on the micrographs. The bridges seem to extend in a more or less cylindrical
325
manner, indicating that the capillary bridge effect is not related to the position at the outer
326
extremity of the pore, but is a ―volume‖ effect.
327
5. INTERPRETATION
328
5.1 Primary in-pore halite
329
As the evaporation progresses, the solution is receding inside the pore, and concentration of
330
dissolved species is increasing up to a stabilized value corresponding to equilibrium (or
331
close) with the naturally-shaped (cubic) halite. The corresponding reaction writes:
332
Na+(AQUEOUS) + Cl-(AQUEOUS) NaCl(SOLID) (5)
333
The advancement of this reaction depends on the ratio between the equilibrium constant at
334
the standard state (K) and the actual composition and activities of the dissolved solutes (ionic
335
activity product, Q). The driving force for the precipitation of the primary massive NaCl is
336
supplied by the evaporation which pulls the Q value above the K one, so that precipitation
337
can occur according to the mass action law. Additionally, the present cubic habit indicates a
338
precipitation at low supersaturation, close to equilibrium [34].
339
When the amount of solution becomes short with respect to the pore volume, and if the cube
340
of NaCl is sufficiently close to the pore wall, the remaining solution can capillarilly bridge the
341
pore space between the NaCl and the membrane (see §4.3). In this configuration, the
342
system is more or less at equilibrium with respect to the local (at the pore scale) RH in air
343
(Kelvin condition, see equation 2), and so the curved liquid ceases (or close) to evaporate,
344
and then to concentrate. Meanwhile, the concentration in the capillary solution is most
345
probably at equilibrium with the primary NaCl, due to the large surface to volume ratio
346
between the tiny capillary bridge and the relatively large NaCl-solution contacting surface.
347
But what is the solubility of the primary halite in a capillary solution?
1 2 3 4 5 6 7 8 9 10 11 12 13 14 15 16 17 18 19 20 21 22 23 24 25 26 27 28 29 30 31 32 33 34 35 36 37 38 39 40 41 42 43 44 45 46 47 48 49 50 51 52 53 54 55 56 57 58 59
Thermodynamically, the solid in its recognized natural shape is stated at 105 Pa, so that its
349
chemical potential is correctly described by the reference Gibbs free energy (see §2.3).
350
However, a change of the equilibrium constant happens due to the change in the
351
thermochemical state of the liquid, which writes:
352
anisobaric P P Cl Na cap R K K RT dP V V G d ref
) ln ( 1 . 0 (6)353
where R is the ideal gases constant (in J.mol-1.K-1), T the temperature (in K), dRGcap (in
354
J.mol-1) the change of the Gibbs free energy due to the capillarization inside the system, Vi
355
(in m3.mol-1) the molar volume of the ith species, P (in Pa) the liquid phase pressure; Kanisobaric
356
and K° are the equilibrium constants of the halite precipitation reaction at P and 105 Pa,
357
respectively. Such calculations with the equilibrium constants relate to an activity ratio,
358
therefore without correction on the activity coefficients.
359
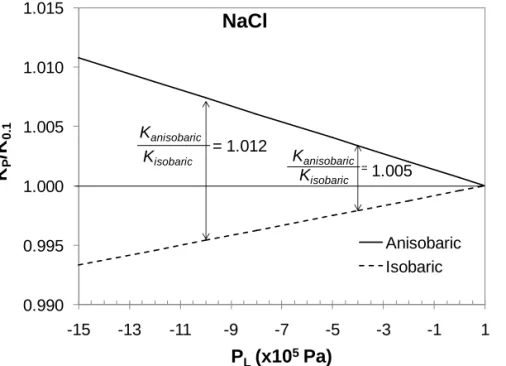
0.990 0.995 1.000 1.005 1.010 1.015 -15 -13 -11 -9 -7 -5 -3 -1 1 KP /K 0.1 PL(x105Pa)NaCl
Anisobaric Isobaric Kisobaric = 1.012 =1.005 Kanisobaric Kisobaric Kanisobaric360
Figure 5. KP/K° ratio for NaCl precipitation as a function of capillary pressure, according to
361
the isobaric and anisobaric contexts (see text; thermodynamic properties from the
362
Thermoddem database, available at http://thermoddem. brgm.fr/).
363
This configuration is called anisobaric (e.g., [8,10]) (―Kanisobaric‖), since the cubic solid and the
364
capillary solution do not experience the same pressure. The corresponding phase diagram is
1 2 3 4 5 6 7 8 9 10 11 12 13 14 15 16 17 18 19 20 21 22 23 24 25 26 27 28 29 30 31 32 33 34 35 36 37 38 39 40 41 42 43 44 45 46 47 48 49 50 51 52 53 54 55 56 57 58 59 60 61
calculations in capillary contexts (e.g., [10]). It shows that the corresponding Kanisobaric
367
increases with decreasing P, meaning that the halite is more soluble in capillary solution than
368
in a free solution. In other words, bulk solution at equilibrium with cubic halite tends to
369
become dissolving when it is capillarized. As a consequence, the chemical driving force in
370
the system is toward the dissolution of the primary in-pore halite. Figure 5 shows that the
371
capillarization of the liquid is probably accompanied by a solute enrichment in the solution,
372
which is calculated with the Pitzer correction [36] on the figure 6. The upward arrow makes
373
clear that a capillary solution has an increasing equilibrium constant, meaning that, under
374
capillary conditions, the solution dissolves the naturally-shaped solid more than a free
375
solution does. The downward arrow exemplifies the proposed driving force to build capillary
376
solids (see below): when the ratio between the anisobaric and the isobaric situation
377
increases enough, this supersaturation affords the required chemical energy for an isobaric
378
(then curved) solid to grow.
379
5.2 Secondary in-pore halite
380
The second stage is the precipitation of the curved NaCl, corresponding to a different pattern
381
than the easiest (low-cost) epitaxial growth on the pre-existing NaCl surface. There is a new
382
process associated with a concave curvature, namely integrating the new capillary conditions
383
of the mother solution. Thermodynamically, if the solid is impacted by the same capillary
384
conditions as the solution, equation (6) becomes:
385
isobaric P Cl Na P NaCl cap R K K RT dP V V dP V G d
cristal
( ) ln 1 . 0 1 . 0 (7)386
with VNaCl (in m3.mol-1) the molar volume of the capillary crystal growing from the capillary
387
solution, P (in Pa) the liquid or solid phase pressure; Kisobaric and K° are the equilibrium
388
constants of the halite precipitation reaction at P and 105 Pa, respectively.
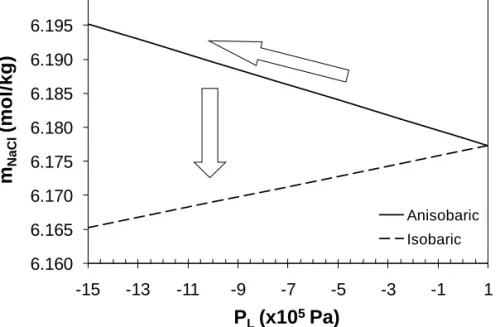
1 2 3 4 5 6 7 8 9 10 11 12 13 14 15 16 17 18 19 20 21 22 23 24 25 26 27 28 29 30 31 32 33 34 35 36 37 38 39 40 41 42 43 44 45 46 47 48 49 50 51 52 53 54 55 56 57 58 59 6.160 6.165 6.170 6.175 6.180 6.185 6.190 6.195 6.200 -15 -13 -11 -9 -7 -5 -3 -1 1 mNaCl (mo l/ kg ) PL(x105Pa) Anisobaric Isobaric
390
Figure 6. NaCl molality in the capillary brine at equilibrium with the cubic (anisobaric) and
391
curved (isobaric) solids.
392
In the isobaric case (P = Pliquid = Psolid), the NaCl crystal is growing at the same pressure than
393
the solution, which means it grows with a concave curvature more or less similar to that of
394
the liquid. Precisely, if the capillary pressures of the solution and the solid are the same, the
395
liquid-air and solid-air curvatures will be different by the difference in the terms (equation
396
1), between LV (82 mJ.m-2 for a saturated NaCl solution, [37]) and SV (200 mJ.m-2, [35]).
397
The corresponding Kisobaric is lower than K°, and then much lower than is Kanisobaric (Fig. 5).
398
Even if the capillary solution kept the same composition as the initial bulk one, it is now
399
supersaturated with respect to the curved solid. And if the capillary solution starts dissolving
400
the naturally-shaped solid according to the anisobaric scenario (which is the most probable),
401
then the supersaturation increases. Therefore, there is a driving force now in the system
402
toward the precipitation of an isobaric NaCl solid phase, owing to the capillarization of the
403
solution and a possible re-dissolution of the primary solid. But this precipitation must occur
404
through a special shape, characteristic of the capillary state of the solid (isobaric
405
configuration).
406
Obviously, the ratio at -4.105 Pa (our capillary pressure) is pretty modest (see y axis in Fig.
407
5): Kanisobaric/Kisobaric = 1.005, amounting to an excess of 14 J/mol of the Gibbs free energy of
1 2 3 4 5 6 7 8 9 10 11 12 13 14 15 16 17 18 19 20 21 22 23 24 25 26 27 28 29 30 31 32 33 34 35 36 37 38 39 40 41 42 43 44 45 46 47 48 49 50 51 52 53 54 55 56 57 58 59 60 61
the precipitation. At -15x105 Pa, Kanisobaric/Kisobaric = 1.018 corresponding to an excess of 43
409
J/mol. These low excesses of chemical potential are explicitly assumed to supply the
410
required energy to resume the precipitation and change the habit of the precipitate.
411
In general, the relationship between the crystal habits and the local physico-chemical
412
conditions are well-known. The ice habit, for instance, can be predicted as a function of the
413
solidification temperature. More generally, the building of small-size crystals requires more
414
chemical energy than the large-size ones, and this excess is supplied by the supersaturation
415
of the solution (Ostwald-Freundlich equation). In the present experiment, an excess amount
416
of chemical energy is made available by the change of the equilibrium constant due to the
417
building of capillary conditions. We propose that this is the driving force for the ―freezing‖ of
418
capillarity by the newly-grown concave crystal.
419
These concave crystals can be related to the hopper-shaped crystals, generally interpreted
420
by a differential growth rate between the middle and the corners and edges of a face (e.g.,
421
[38]). Meanwhile, in concretion-forming (pore-space controlled) processes, they are known to
422
precipitate in a second stage of the concretionary growth, after the first pore-filling stage [38].
423
Aside the diffusion-controlled growth already proposed [38], we may outline that the hopper
424
shape is consistent with a capillarity-controlled precipitation.
425
6. FIELD-SCALE PERSPECTIVES
426
The arguments detailed along the previous sections led us to conclude that we have
427
identified in this cylindrical 10 µm polycarbonate pore, the same phenomenon as Tas et al
428
[18] did in their rectangular 100 nm silicon channels: the occurrence of capillary traction
429
inside water unsaturated pores. But two new points are worth to be outlined: 1/ the traction
430
occurs in a micrometric cylindrical pores, a priori unfavorable to such occurrence, owing to a
431
prior precipitation event which greatly changes the topology of the pore space; 2/ the traction
432
by liquid capillary bridges (Tas et al’s case) is fossilized by the precipitation of a capillarized
1 2 3 4 5 6 7 8 9 10 11 12 13 14 15 16 17 18 19 20 21 22 23 24 25 26 27 28 29 30 31 32 33 34 35 36 37 38 39 40 41 42 43 44 45 46 47 48 49 50 51 52 53 54 55 56 57 58 59
solid, which seems able to provoke micro-cracking in the solid (Fig. 3), probably linked to the
434
duration of the traction event, and the irreversible path of the deformation.
435
Therefore, capillary bridging should contribute to the global strain inside a non-saturated
436
object/system, as already stated for shrinkage and cracking in sol-gel drying processes
[16-437
17]. Moreover, the in-pore mechanical traction exerted by the liquid capillary bridges can be
438
relayed by solid capillary bridges which install the traction on a longer scale. These facts
439
indicate that our experiments are of value to study the coupling between the local phase
440
transitions and the poro-mechanics inside porous samples (membrane technologies largely
441
used for the desalination processes for instance; salt damage in building stones; soil
442
mechanics).
443
One field situation presents clues of the occurrence of the in-pore capillary traction. Inside
444
the excavation damaged zone around drifts excavated in mines, tunnels or in underground
445
research laboratories, several kinds of disturbances change the initial hydrogeological,
446
geochemical and rock mechanical properties. Amongst these disturbances, it is commonly
447
noticed the occurrence of an unsaturated zone with a wide variation of the pore sizes and
448
degree of saturation. Very often, seasonal micro-cracks were observed in situ, which are
449
often (and surprisingly) secant to the bedding [39]. Also, the cracks open during the cold and
450
dry winter and close on hot and wet summer, which is the expected behavior, but during
451
some slightly less wet seasons, the closing is not complete [40]. Meanwhile, the chemical
452
analyses have proven that resident solutions can be concentrated up to gypsum precipitation
453
[41]. Moreover, and this is the most significant in our opinion, gypsum precipitates are always
454
associated with the largest cracks [41]. This is generally explained by the first formation of
455
the cracking, which subsequently promotes the evaporation of the resident solution up to the
456
precipitation threshold. But this explanation accounts neither for the secant cracking, nor for
457
the irreversibility of the aperture. Our work paves the way for another explanation based on
458
the occurrence of the two stages of the in-pore capillary traction, above detailed. Just to
459
illustrate, we can mention that gypsum behaves the same way as the halite when drawn
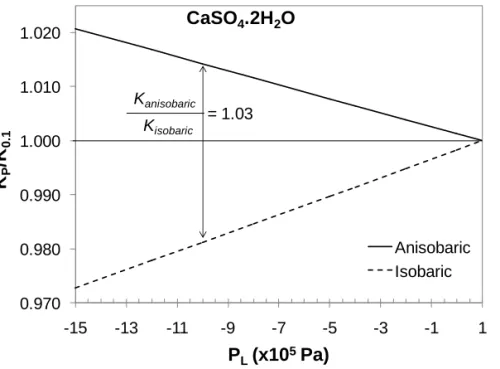
1 2 3 4 5 6 7 8 9 10 11 12 13 14 15 16 17 18 19 20 21 22 23 24 25 26 27 28 29 30 31 32 33 34 35 36 37 38 39 40 41 42 43 44 45 46 47 48 49 50 51 52 53 54 55 56 57 58 59 60 61 0.970 0.980 0.990 1.000 1.010 1.020 -15 -13 -11 -9 -7 -5 -3 -1 1 KP /K 0.1 PL(x105Pa) CaSO4.2H2O Anisobaric Isobaric Kanisobaric = 1.03 Kisobaric
462
Figure 7. KP/K° ratio for CaSO4.2H2O precipitation as a function of capillary pressure, through
463
isobaric and anisobaric contexts (see text; thermodynamic properties from the Thermoddem
464
database, available at http://thermoddem.brgm.fr/).
465
7. CONCLUSION
466
The experiments proposed in this paper are very simple and focused on getting a direct
467
answer to the following question: what are the consequences of a drying desaturation
468
process acting in an initially-saturated porous medium? We chose to carry out experiments in
469
model materials having large cylindrical pores to make the observations easy and the chain
470
of events simple and straightforward.
471
These experiments led us to get two different NaCl habits, coexisting in the same pore
472
submitted to constant drying conditions. We observed first a primary massive precipitate
473
having the cubic shape of NaCl. This habit is linked to a precipitation from a bulk solution
474
supersaturated by evaporation due to the drying conditions. The secondary curved NaCl is
475
interpreted as a precipitation inside a capillary aqueous solution and controlled by it, under a
476
driving force generated by the change of the equilibrium constant K. The corresponding
477
calculations have been accounted for by the isobaric-anisobaric frame of reasoning, already
478
proposed in the literature on the capillary geochemistry. The consistency of the observations
1 2 3 4 5 6 7 8 9 10 11 12 13 14 15 16 17 18 19 20 21 22 23 24 25 26 27 28 29 30 31 32 33 34 35 36 37 38 39 40 41 42 43 44 45 46 47 48 49 50 51 52 53 54 55 56 57 58 59
with the thermodynamic simulation demonstrates the interest to renew our approach of the
480
equilibrium constant when dealing with capillary systems.
481
Our experiments dealt with cylindrical pores in which cubic crystals grow: touching corners
482
are quite logical. A posteriori, we realize that this specific geometry was an enormous chance
483
for the capillary bridges to arise, and for the subsequent process to happen. Nonetheless,
484
any wedge-shape pores, initially present or resulting from a precipitation event, could enable
485
the capillarization and its mechanical traction on the host. An important observation is the
486
ability of these tiny capillary liquid bridges to fossilize while retaining the capillarity state. The
487
NaCl solid bridges appear able to make the in-pore capillary traction more or less
488
independent on the further climatic variations, and so to give it a significant time scale.
489
We target to connect the studied process with what might happen in the natural media,
490
because our experiments show a non-expected coupling between geochemistry and
491
geomechanics possibly acting inside any non-saturated media. We hypothesize that this
492
heterogeneous stress might be responsible for micro-cracking inside any rock hosting
493
capillary water, especially when the conditions favor the salt precipitation. If this process
494
really takes place in nature, we believe that a re-interpretation of known field data may
495
suffice to confirm the proposition.
496
We can conclude unambiguously that precipitation of soluble salts in pores changes
497
drastically the capabilities of evolution of the pore system depending on the local conditions,
498
when the in-pore filling is associated with the pore wall cracking. Interestingly, this effect is
499
related to the global permeability of a thin pores rock, but also to the compaction and global
500
firmness of a granular soils, or still to the salt damage in industrial desalination processes or
501
inside the building stones. Finally, the present experimental results offer a new framework of
502
analysis of the global geochemistry-geomechanics coupling processes.
503
Acknowledgements — E. Tinseau and S. Bassot, of the DEI/SARG/LR2S laboratory of the
504
IRSN, are warmly thanked for their guidance and assistance throughout the experiments. A.
505
506
1 2 3 4 5 6 7 8 9 10 11 12 13 14 15 16 17 18 19 20 21 22 23 24 25 26 27 28 29 30 31 32 33 34 35 36 37 38 39 40 41 42 43 44 45 46 47 48 49 50 51 52 53 54 55 56 57 58 59 60 61
cyclohexane rinsing. P. Mirwald and E. Oelkers are greatly acknowledged for their help in
507
improving a first version of this manuscript. Two anonymous reviewers also contributed to
508
improve the manuscript, as well as H. Raimbourg (ISTO, Orleans University) who helped us
509
with the mechanical side of the paper.
510
REFERENCES
511
[1] Gerard F., Ranger J., Ménétrier C., and Bonnaud P. (2003) Chem. Geol. 202, 443-460.
512
[2] Richards P.L. and Kump L.R. (2003) Geochim. Cosmochim. Acta 67(20), 3803-3815.
513
[3] Mercury L. and Tardy Y. (1997a) C. R. Acad. Sci. Paris 324, 11, 863-873.
514
[4] Mercury L. and Tardy Y. (1997b) C. R. Acad. Sci. Paris 325, 12, 947-954.
515
[5] Mercury L. and Tardy Y. (2001) Geochim.Cosmochim. Acta 65, 20, 3391-3408.
516
[6] Zilberbrand M. (1997) J. Colloid Interf. Sci. 192, 471–474.
517
[7] Zilberbrand M. (1999) Aquatic Geochem. 5, 195-206.
518
[8] Mercury L., Azaroual M., Zeyen H., and Tardy Y. (2003) Geochim. Cosmochim. Acta 67,
519
1769–1785.
520
[9] Mercury L., Pinti D. L., and Zeyen H. (2004) Earth & Planetary Sci. Lett. 223, 147–161.
521
[10] Lassin A., Azaroual M., and Mercury L. (2005) Geochim.Cosmochim. Acta 69, 22,
5187-522
5201.
523
[11] Mullins C.E. and Panayiotopoulos K.P. (1984) J. Soil Sci. 35, 459-468.
524
[12] Fredlund D.G. and Rahardjo H. (1993) Soil mechanics for unsaturated soils. J. Wiley &
525
Sons, 517 p.
526
[13] Mosadegghi, M.R., Hajabbasi M.A., and Khademi H. (2006) Geoderma 134, 160-170.
527
[14] Hasley T.C. and Levine A.J. (1998) Phys. Rev. Lett. 80(14), 3141-3144.
528
[15] Fraysse N., Tomé H., and Petit L. (1999) Eur. Phys. J. B, 11(4):615–619.
529
[16] Scherer G.W. (1990) J. Am. Ceram. Soc. 73(1), 3-14.
530
[17] Smith D.M., Scherer G.W., and Anderson J.M. (1995) J. Non-Cryst. Solids 188, 191-206.
1 2 3 4 5 6 7 8 9 10 11 12 13 14 15 16 17 18 19 20 21 22 23 24 25 26 27 28 29 30 31 32 33 34 35 36 37 38 39 40 41 42 43 44 45 46 47 48 49 50 51 52 53 54 55 56 57 58 59
[18] Tas N.R., Mela P., Kramer T., Berenschot J.W., and van den Berg A. (2003) Nano Lett.
532
3(11), 1537-1540.
533
[19] Tas N.R., Escalante M., van Honschoten J.W., Jansen H.V., and Elwenspoek M. (2010)
534
Langmuir 26(3), 1473-1476.
535
[20] Wellman H.W. and Wilson A.T. (1965) Science 205, 1097-1098.
536
[21] Kwaad F.J.P.M. (1970) Fysisch Geograph. Bodemkundig Lab. 16, 67-80.
537
[22] Goudie A.S. and Day M.J. (1980) Phys. Geograph. 1, 126-137.
538
[23] Mottershead D.N. (1989) Earth Surf. Process. Landforms 14, 383-398.
539
[24] Warke P.A. and Smith B.J. (2000) Earth Surf. Process. Landforms 25, 1333-1342.
540
[25] Cahn J.W. (1980) Acta Metall. 28, 1333-1338.
541
[26] Sanfeld A. and Steinchen A. (2000) Surf. Science 463, 157-173.
542
[27] Sperling C.H.B. and Cooke R.U. (1985) Earth Surf. Process. Landforms 10, 541-555.
543
[28] Goudie A.S. (1993) Earth. Surf. Process. Landforms 18, 369-376.
544
[29] Goudie A.S. and Viles H.A. (1997) Salt weathering hazards. Wiley intersciences. 256 p.
545
[30] Rodriguez-Navarro C. and Doehne E. (1999) Earth Surf. Process. Landforms 24,
191-546
209.
547
[31] Flatt R.J. (2002) J. Cryst. Growth 242, 435-454.
548
[32] Scherer G.W. (2004) Cement Concrete Res. 34, 1613-1624.
549
[33] Steiger M. and Asmussen S. (2008) Geochim. Cosmochim. Acta 72, 4291-4306.
550
[34] Sunagawa I. (1981) Bull. Mineral. 104, 81-87.
551
[35] Adamson A.W. and Gast A.P. (1997) Physical chemistry of surfaces. J. Wiley & Sons,
552
New York, 6th ed., 808p.
553
[36] Pitzer K.S. (1991) Activity coefficients in electrolyte solutions. 2nd edition (ed. CRC
554
Press), 542 pp.
555
[37] Leroy P., Lassin A., and Azaroual M. (2010) Geochim. Cosmochim. Acta (in press,
556
available on the GCA website).
557
[38] Carstens H. (1986) J. Sedim.Petrol. 56(2), 252-257.
1 2 3 4 5 6 7 8 9 10 11 12 13 14 15 16 17 18 19 20 21 22 23 24 25 26 27 28 29 30 31 32 33 34 35 36 37 38 39 40 41 42 43 44 45 46 47 48 49 50 51 52 53 54 55 56 57 58 59 60 61
[39] Valès F., Nguyen Minh D., Gharbui H., and Rejeb A. (2004) Applied Clay Sci. 26,
197-559
207.
560
[40] Massmann J., Uehara S.-I., Rejeb A., and Millard A. (2009) Environ. Geol. 57, 1337–
561
1345.
562
[41] Matray J.-M., Parneix J.-C., Tinseau E., Prêt D., and Mayor J.-C. (2007) Clays in Natural
563
& engineered barriers for radioactive waste confinement. Book of abstracts. September
17-564
18, Lille, France, pp. 445-446.