Animal(2011), 5:10, pp 1634–1642 & The Animal Consortium 2011
doi:10.1017/S1751731111000553
animal
Inter-laboratory comparison of methods to measure
androstenone in pork fat
S. Ampuero Kragten
1-, B. Verkuylen
2, H. Dahlmans
2, M. Hortos
3, J. A. Garcia-Regueiro
3,
E. Dahl
4, O. Andresen
4, H. Feitsma
5, P. K. Mathur
5and B. Harlizius
51
Chemical Department, Agroscope Liebefeld-Posieux Research Station ALP, Tioleyre 4, 1725 Posieux, Switzerland;2Instrumental Analysis, Co-operative Central Laboratory CCL, PO Box 107, 5460 AC Veghel, The Netherlands;3Functionality and Nutrition, Institut de Recerca i Tecnologia Agroalimenta`ries IRTA, Food Technology, Finca Camps i Armet 17121 Monells, Spain;4Department of Production Animal Clinical Sciences, Norwegian School of Veterinary Sciences,
PO Box 8146 Dep, 0033 Oslo, Norway;5Research and Development Department, Institute for Pig Genetics B.V., PO Box 43, 6640 AA Beuningen, The Netherlands
(Received 17 November 2010; Accepted 15 March 2011; First published online 26 April 2011)
Today, different analytical methods are used by different laboratories to quantify androstenone in fat tissue. This study shows the comparison of methods used routinely in different laboratories for androstenone quantification: Time-resolved fluoroimmunoassay in Norwegian School of Veterinary Science (NSVS; Norway), gas chromatography coupled to mass spectrometry in Co-operative Central Laboratory (CCL; The Netherlands) and in Institut de Recerca i Tecnologia Agroalimenta`ries (IRTA; Spain), and high-pressure liquid chromatography in Agroscope Liebefeld-Posieux Research Station (ALP; Switzerland). In a first trial, a set of adipose tissue (AT) samples from 53 entire males was sent to CCL, IRTA and NSVS for determination of androstenone concentration. The average androstenone concentration (s.d.) was 2.47 (2.10) mg/g at NSVS, 1.31 (0.98) mg/g at CCL and 0.62 (0.52) mg/g at IRTA. Despite the large differences in absolute values, inter-laboratory correlations were high, ranging from 0.82 to 0.92. A closer look showed differences in the preparation step. Indeed, different matrices were used for the analysis: pure fat at NSVS, melted fat at CCL and AT at IRTA. A second trial was organised in order to circumvent the differences in sample preparation. Back fat samples from 10 entire males were lyophilised at the ALP labortary in Switzerland and were sent to the other laboratories for androstenone concentration measurement. The average concentration (s.d.) of androstenone in the freeze-dried AT samples was 0.87 (0.52), 1.03 (0.55), 0.84 (0.46) and 0.99 (0.67) mg/g at NSVS, CCL, IRTA and ALP, respectively, and the pairwise correlations between laboratories ranged from 0.92 to 0.97. Thus, this study shows the influence of the different sample preparation protocols, leading to major differences in the results, although still allowing high inter-laboratory correlations. The results further highlight the need for method standardisation and inter-laboratory ring tests for the determination of androstenone. This standardisation is especially relevant when deriving thresholds of consumer acceptance, whereas the ranking of animals for breeding purposes will be less affected due to the high correlations between methods.
Keywords: boar taint, androstenone analysis, pork
Implications
A comparison of androstenone measurements in pork fat between laboratories shows large differences in the absolute values, whereas inter-laboratory correlations remain high. This can be explained to a large extent by differences in the preparation of samples, as demonstrated by the better results obtained with freeze-dried samples, involving a single preparation method. These results are especially relevant to determine thresholds of consumer acceptance across coun-tries, and to any work aiming at reducing boar taint under
detection levels as well as to the definition of boar taint itself. However, any of the reported methods should apply for the ranking of animals for breeding purposes.
Introduction
When cooking/heating meat from entire male pigs, an unpleasant odour/flavour (boar taint) can occur. To prevent boar taint, male piglets are usually castrated at a young age. Thus, in the European Union, around 50% of the 161 Mio slaughtered pigs are barrows. However, according to a recent European declaration on alternatives to surgical castration of pigs, released on 16 December 2010, representatives of
-E-mail: [email protected]
1634
https:/www.cambridge.org/core/terms. https://doi.org/10.1017/S1751731111000553
European farmers, the meat industry, retailers, scientists, veterinarians and animal welfare non-governmental organi-sations committed to a plan to voluntarily end surgical castration of pigs in Europe by 1 January 2018.
Several methods have been described in the literature to measure androstenone (5a-androst-16-en-3-one) in pork fat, one of the major compounds together with skatole and indole causing boar taint in entire male pigs. Despite the fact that the different methods effectively analyse different matrices, androstenone results are usually reported indistinctly, without specifying whether the analysis was performed in adipose tissue (AT), melted fat (MF) or pure fat (PF). This situation makes it difficult to draw meaningful conclusions for the establishment of comparable threshold levels, consumer acceptance limits and finally for the production of boar taint-free pork. In fact, many studies are performed by grouping the animals in high/medium/low-taint classes based on skatole and androstenone thresholds, with the generally accepted androstenone thresholds: 1 mg/g and 0.5 mg/g of fat, using the same levels even if those concentrations are given in MF (Matthewset al., 2000; Weileret al., 2000; Babolet al., 2002) or in AT (Annor-Frempong et al., 1997; Ban˜o´net al., 2003; Font i Furnolset al., 2008) and conclusions are drawn about the abundance of animals in the given classes, or about the consumers’ acceptance by classes. Thus, comparisons are very often made between breeds, breed crosses, locations and countries (Walstraet al., 1999; Bonneauet al., 2000; Pauly
et al., 2009 and 2010).
The methods for measuring the concentration of androste-none in pork fat include immunoassays and various chroma-tographic methods. The chromachroma-tographic methods are used either in combination with mass spectrometry or with fluor-escence detectors. The immunoassays have been described by Claus (1974), Andresen (1975), Clauset al. (1988), Tuomola
et al. (1997) and Squires and Lundstro¨m (1997), whereas chromatographic methods in combination with mass spec-trometry have been described by Claus (1970), Rius and Garcı´a-Regueiro (1988), Ma˚ga˚rdet al. (1995), Tuomolaet al. (1998), Riuset al. (2005) and Verheydenet al. (2007). The high-pressure liquid chromatography (HPLC) method has been described by Hansen-Møller (1994). Chenet al. (2007) and Paulyet al. (2008) mentioned HPLC-modified methods based on Hansen-Møller’s method.
To our knowledge, the comparison of measurements between laboratories has not been reported. This topic is also of major interest, especially with respect to the defini-tion of consumer acceptance thresholds across countries. In this study, measurements of androstenone were compared between three laboratories applying different assays on the same samples. The laboratories were the Norwegian School of Veterinary Science (NSVS) in Norway, the Co-operative Central Laboratory (CCL-Nutricontrol) in the Netherlands and the Institut de Recerca i Tecnologia Agroalimenta`ries (IRTA) in Spain. The methods used were time-resolved fluoroimmunoassay (TR-FIA) and two different methods combining gas chromatography and mass spectrometry (GC-MS). In a second trial, a fourth laboratory was included
in the study, the Agroscope Liebefeld-Posieux Research Station (ALP) in Switzerland, which used HPLC.
Material and methods
Collection, conditioning and shipping conditions of AT samples
In the first trial, AT samples were collected from the neck region of 53 entire males immediately after slaughter, on a single day, in the Netherlands. Pigs were from a Duroc-based composite line with a mean age of 180 days and a mean live weight of around 125 kg at slaughter. The samples were stored at 2208C and shipped on dry ice for quantification of androstenone to NSVS in Oslo, Norway, CCL in Veghel, The Netherlands and IRTA in Girona, Spain. In all laboratories, samples were kept frozen at 2208C until analyses were per-formed, between 1 and 6 months, upon receipt of the samples. Under these storage conditions, at 2208C, no androstenone degradation was observed within the first years of storage as demonstrated by the stable results of several samples repeatedly analysed over 2 to 3 years after sampling (data not shown).
The second trial was carried out with freeze-dried samples. The main purpose was to circumvent the observed differences in sample preparation as routinely performed in the different laboratories, that is, analyte extraction from raw AT sample, from MF or from water-poor ‘PF’. For the second trial, back fat from 10 entire males and one castrated pig were used, and 50 g of AT from each carcass was freeze-dried at ALP, Switzerland. During the freeze-drying proce-dure, the AT samples were cut into pieces, cooled briefly to 2208C in a freezer and placed into closed recipients. These recipients were then immersed into liquid nitrogen. Immediately thereafter, the samples were homogenised (Vertec, Buhler) and freeze-dried (Christ Delta 1 to 24 K). Each sample was then mixed and portioned in aluminium bags, which were in turn sealed under vacuum and stored at 2208C. These lyophilised samples were then distributed to the four laboratories, including ALP in Switzerland, for androstenone analysis during the second trial. The mass (moisture) lost during the freeze-drying procedure in the 10 AT boar samples ranged from 12.6% to 23.8%. The freeze-drying process gave a fine powder, with remaining moisture of ,3%. These samples could be readily extracted, follow-ing each laboratory’s procedure as described below, in the ‘as received’ form without any further sample preparation. The sample from a castrate was also used for calibration.
Analysis of androstenone
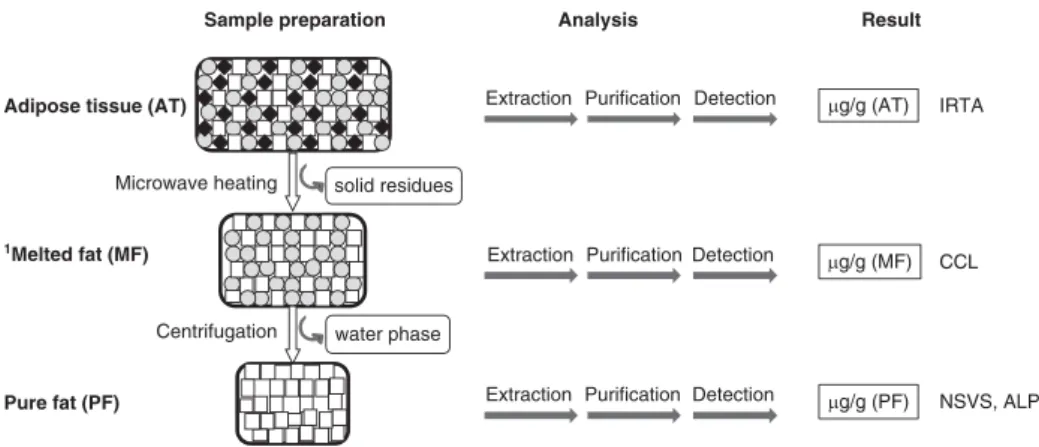
The original methods used by the four laboratories differed considerably not only in the analytical technology but also in the sample preparation (Figure 1), extraction protocol, pre-paration of calibration standards, calibration method and quality control procedures. A short description of the method used in each laboratory is given below and a summary of the main differences between methods, other than the detection principle, is given in Table 1.
TR-FIA at NSVS. At NSVS, samples were analysed as described by Tuomola et al. (1997). In brief, AT samples were melted in a microwave oven at 350 W for 4 min. The MF thus obtained was transferred to eppendorf tubes and centrifuged for 15 s at 6000 r.p.m., and after separation of phases, the water phase was discarded (Figure 1). A volume of 30 ml of water-poor ‘PF’ (558C) was transferred to a glass vial containing 500 ml of methanol and extracted for 30 min at 558C (vortexed at 0 and 15 min). The vials were then allowed to cool to room temperature for 10 min and a 50 ml aliquot of the methanol extract was diluted 1 : 9 with assay buffer. All samples were analysed in duplicate, with 2.1% variation between duplicates. Volumes of the 50 ml sample, 50 ml Eu-labelled androstenone (PerkinElmer Life and Analytical Sciences Wallac Oy, Turku, Finland) and 50 ml anti-androstenone (primary antibody, final dilution 1/45 000; Andresen, 1974) were pipetted into anti-rabbit coated (secondary antibody) micro-titration wells (Goat anti-rabbit IgG affinity purified antibody lot no. 021199, LabAs Ltd. Tartu, Estland). After 1.5 h incubation at room temperature, the wells were washed six times with wash solution DELFIA B117-100 at pH 7.75 (219.2 g/l of NaCl, 1.25 ml/l of Tween 20, 19.7 g/l of Tris HCl, adjusted to pH 7.7.5 with NaOH). Then, 200 ml of enhancement solution (DELFIA/ autoDELFIA enhancement solution product no. B118-100 PerkinElmer, Wallac Oy, Turku, Finland) were added, and the wells shaken for 5 min at room temperature before the enhanced fluorescence was measured in a time-resolved fluorometer (Victor3 1420 multilabel counter, PerkinElmer, Turku, Finland).
Calibration standards were prepared by spiking each time 50 g of PF from a barrow with 0 to 500 ml solution of androstenone (Sigma-Aldrich A-8008, St. Louis, MO, USA) in ethanol (1 mg/ml). Thus, the calibration standards were as follows: 0.0, 0.2, 1.0, 2.0, 5.0 and 10 mg/g of androstenone in ‘PF’. These standards were then extracted and analysed in the same way as the samples.
The samples of the second trial were analysed following the normal procedure, except for the extraction step. Thus,
0.5 g of a freeze-dried sample were extracted with 1 ml methanol : water (95 : 5 v/v), instead of the 30 ml sample extracted with 500 ml methanol in the normal procedure. In this case, fresh calibration standards were prepared with 0.5 g of a freeze-dried barrow sample with 1 ml solutions of androstenone in MeOH : H2O (95 : 5 v/v), ranging from
0.1 to 5 mg/ml. Standards and samples were incubated for 30 min at 558C, whirlmixed every 10 min and centrifuged at 13 000 r.p.m. Samples were frozen and centrifuged once more before further analysis.
GC-MS at CCL. At CCL, samples were analysed according to Verheydenet al. (2007). The AT samples were first prepared by removing meat residues and skin. The cleaned samples were cut into small pieces and placed in 70 ml plastic sample containers. The samples were then heated in a microwave oven at 600 W for 1 min (Figure 1). Then, 0.15 g of liquid fat was transferred to centrifuge tubes (2 ml) and 1.75 ml of extraction solvent methanol : hexane (9 : 1) was added. The tubes were placed in an ultrasonic bath at 508C for 5 min, shaken vigorously and placed back in the ultrasonic bath for additional 30 min. They were shaken every 5 min during this period. The tubes were then centrifuged for 5 min at 10 000 r.p.m. while they were still hot and then placed on a cooled aluminium block. Around 1.5 ml of the extract was then placed into an injection vial and allowed to get to room temperature. Finally, 2 ml of the extract were injected into a GC-MS, 2608C injection temperature, in pulsed splitless mode. The separation was performed in an Rtx-5SIL MS column, 30 m 3 250 mm (0.25 mm film thickness), under a constant helium flow of 1.1 ml/min. The temperature pro-gramme was as follows: 1 min at 508C, then from 508C to 3008C at 108C/min, followed by 9 min at 3008C. Detection was performed in SIM mode with m/z 257 (target), 258 and 259 and a dwell time of 100 ms.
For calibration purposes, solutions of androstenone (.99%, Sigma A-8008) were prepared in 100 ml metha-nol : hexane (9 : 1) additioned with 5 ml corn oil. The cali-bration standards ranged from 6 to 240 ng/ml.
Adipose tissue (AT)
1Melted fat (MF)
Pure fat (PF)
Microwave heating solid residues
Centrifugation water phase
Sample preparation Analysis Result
Extraction Purification Detection µg/g (AT) IRTA
µg/g (MF) CCL
µg/g (PF) NSVS, ALP Extraction Purification Detection
Extraction Purification Detection
Figure 1 Schema of different sample preparation procedures during routinely applied methods for the quantification of androstenone at different laboratories.1Melted fat readily forms two phases (lipid/aqueous) after a short period of rest, especially when the aqueous fraction is important (IRTA 5 Institut de Recerca i Tecnologia Agroalimenta`ries; CCL 5 Co-operative Central Laboratory; NSVS 5 Norwegian School of Veterinary Science; ALP 5 Agroscope Liebefeld-Posieux Research Station).
Ampuero Kragten, Verkuylen, Dahlmans, Hortos, Garcia-Regueiro, Dahl, Andresen, Feitsma, Mathur and Harlizius
1636
https:/www.cambridge.org/core/terms. https://doi.org/10.1017/S1751731111000553
Table 1Summary of main differences among current methods used for the determination of androstenone content in pork fat
NSVS (TR-FIA) CCL (GC-MS) IRTA (GC-MS) ALP (HPLC)
Sample preparation Preparation steps Microwave heating of AT1 Microwave heating of AT1 Homogenisation of AT1 Microwave heating of AT1
Solid phase elimination Solid phase elimination Solid phase elimination
Liquid phase centrifugation Liquid phase centrifugation
Aqueous phase elimination Aqueous phase elimination
Sample for analysis Water-poor liquid fat, or ‘PF’ MF AT Water-poor liquid fat, or ‘PF’
Extraction Sample 30 ml PF 0.15 g MF 1 g AT 0.5 g PF
Solvent 500 ml methanol 1.75 ml MeOH : hexane (9 : 1) 50 ml hexane : dichlorormethane (1 : 1)
containing 2 mg IS2
1 ml MeOH : H2O (95 : 5 w/w)
containing 0.5 mg IS2
Duration/ temperature
30 min/558C 35 min/508C 30 min/room temperature 5 min/308C
Purification None Centrifugation, cold bath (2 h/2188C),
centrifugation
Solid phase extraction clean-up in several steps
Cold bath ( , 08C), centrifugation
Calibration Matrix PF from barrow 100 ml MeOH : hexane (9 : 1)
containing 5 ml corn oil
AT from gilt PF from barrow
Range (number of standards)
0.0 to 10 mg/g (6) 6 to 240 ng/ml solvent (0.07 to 2.8 mg/
g MF) (7)
0.0 to 4.0 mg/g (5) 0.0 to 3.0 mg/g (4)
Type External calibration External calibration Internal standard calibration IS calibration
Quality control procedures
Three control samples Control sample , 1.0 mg/g Linearity from five spiked samples in
duplicate
Control sample , 1.0 mg/g
LOQ (LOD) (0.04 mg/g) (,0.1 mg/g) 0.24 mg/g 0.2 mg/g
NSVS 5 Norwegian School of Veterinary Science; TR-FIA 5 time-resolved fluoroimmunoassay; CCL 5 Co-operative Central Laboratory; GC-MS 5 gas chromatography and mass spectrometry; IRTA 5 Institut de Recerca i Tecnologia Agroalimenta`ries; ALP 5 Agroscope Liebefeld-Posieux Research Station; HPLC 5 high-pressure liquid chromatography; AT 5adipose tissue; PF 5 pure fat; MF 5 melted fat; IS 5 internal standard; LOQ 5 limit of quantification; LOD 5 limit of determination.
1
AT as sampled from a carcasse. 2IS (5a-androstan-3-one). Comparison of androstenone measurements 1637 . https://doi.org/10.1017/S1751731111000553 https:/www.cambridge.org/core
. University of Basel Library
, on
11 Jul 2017 at 17:29:58
During the second trial, the normal procedures for extraction and analysis were followed, skipping the pre-paration step. Thus, 0.15 g of the freeze-dried sample was directly extracted with 1.75 ml of methanol : hexane (9 : 1).
GC-MS at IRTA. At IRTA, samples were analysed as descri-bed by Rius and Garcı´a-Regueiro (1988) and Riuset al. (2005). AT samples (1.00 6 0.01 g) were homogenised (Figure 1) and extracted in 50 ml hexane : dichloromethane (50 : 50) contain-ing 5a-androstan-3-one (2 mg/g) as the internal standard. A 5 ml aliquot was evaporated to dryness and dissolved in 2 ml hexane. Extracts were purified in a solid phase extraction (SPE) Diol column, which had been previously flushed with hexane, by elution with hexane : dichloromethane (40 : 60) and eva-porated to dryness at room temperature. The collected fraction was resuspended in 2 ml methanol and further purified in a C18 SPE column. After evaporation at room temperature, the residues were dissolved in isooctane and injected in a gas chromatographer coupled to a mass spectrometry detector (Varian 3800 – Saturn 2200 Varian, Inc. Corporate Head-quarters, Palo Alto, CA, USA). A capillary column BPX5 (SGE, Australia), 30 m 3 0.25 mm (0.25 mm film thickness), was used. The injection mode was splitless at 2508C. The MS interface temperature was set at 2808C. A temperature pro-gramme was applied: 708C for 2 min, then from 708C to 2008C at 108C/min followed by 58C/min up to 2808C, and then for 9 min at 2808C. Mass spectrometry data was acquired in SIM mode with m/z: 257 and 272 (target) and 202, 274. All samples were evaluated in duplicate.
Calibration standards were prepared with a subcutaneous fat sample that contained ,0.05 mg/g of androstenone. Each standard was prepared with 1.00 6 0.01 g of homo-genised AT and 50 ml of androstenone (.99%, Sigma A-8008) solutions in hexane : dichloromethane (50 : 50). The solvent also contained 5a-androstan-3-one as the internal standard. Fortified samples had 0.0, 0.5, 1, 2 and 4 mg/g of androstenone and 2 mg/g of 5a-androstan-3-one in AT.
During the second trial, the normal procedures for extrac-tion and analysis were followed, skipping the preparaextrac-tion step. Thus, 1.00 6 0.01 g of the freeze-dried sample was directly extracted with 50 ml hexane : dichloromethane (50 : 50).
HPLC at ALP. At ALP, the procedure for the analysis of androstenone described by Paulyet al. (2008) was followed. Although ALP participated in the second trial but not in the first one, the analytical procedure is described hereafter to illustrate the entire procedure for calibration standards. Around 5 g of raw sample (AT) are cleaned from the skin and muscular tissue and cut in pieces before introducing into a glass bottle (50 ml). The bottle with an untightened cap is heated in a microwave device for 2 3 2 min at 250 to 300 W. Twice (the analysis is made on replicate basis), 1 ml of liquid is transferred into a 2 ml eppendorf tube and immediately centrifuged at 11 250 3 g, room temperature, for 2 min. The aqueous phase is then eliminated with a Pasteur pipette (Figure 1). In a 2 ml eppendorf tube, 0.50 6 0.01 g of water-poor ‘PF’ is extracted at 478C with 1.00 ml of MeOH : H2O
(95 : 5 w/w) containing 0.500 mg/l of 5a-androstan-3-one as the internal standard. Samples are then mixed in a vortex and sonicated in an ultrasonic bath at 308C for 5 min. Then, they are placed in an ice-water bath for 20 min. Finally, they are centrifuged at 11 000 3 g, at 48C, for 20 min. The liquid fraction is filtered through a 0.2 mm filter before injection into an HPLC (1200, Agilent Technologies, with FLD G1321A fluorescence detector). Anin situderivatisation is performed by the injection module with dansylhydrazine in the presence of BF3, with a programmed fixed derivatisation time before
injection. The separation is performed by injecting 10 ml of the extract into an SB C18 column (50 3 4.6 mm, 1.8 mm particle size), at 408C, and eluting with phosphate buffer (pH 5 6) at 1.3 ml/min. The FLD parameters for the detection of androstenone are excitation/emission: 346/521 nm.
Calibration standards are prepared by spiking water-poor ‘PF’ from a barrow with 10 to 20 ml of androstenone (.99%, Sigma A-8008) solutions in MeOH : H2O (95 : 5 w/w)
in order to get mass/mass standards ranging from 0.2 to 3 mg/g of androstenone in ‘PF’. These standards are treated as ‘PF’ samples and extracted and analysed following the normal procedure.
During the second trial, the normal procedures for extraction and analysis were followed, skipping the pre-paration step. Thus, 0.50 6 0.01 g of the freeze-dried sample was extracted with 1 ml MeOH : H2O (95 : 5 w/w) containing
0.500 mg/l of the internal standard. Results
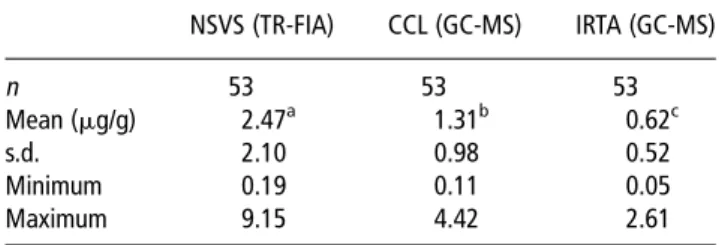
First inter-laboratory trial: androstenone quantification in pork fat
The average androstenone levels measured by three differ-ent laboratories using AT samples from the same 53 pigs in the first trial are given in Table 2. There were large differ-ences between the average levels from different labora-tories. The average values ranging from 0.62 to 2.47 mg/g. The values from NSVS ranging from as low as 0.19 to a maximum of 9.15 mg/g (in PF), whereas those from IRTA ranging from 0.05 to 2.61 mg/g (in AT). All samples were
Table 2Characteristics of a single set of 53 AT pork samples as a result of the androstenone analysis performed independently by three different laboratories. First trial
NSVS (TR-FIA) CCL (GC-MS) IRTA (GC-MS) n 53 53 53 Mean (mg/g) 2.47a 1.31b 0.62c s.d. 2.10 0.98 0.52 Minimum 0.19 0.11 0.05 Maximum 9.15 4.42 2.61
AT 5adipose tissue; NSVS 5 Norwegian School of Veterinary Science; TR-FIA 5 time-resolved fluoroimmunoassay; CCL 5 Co-operative Central Laboratory; GC-MS 5 gas chromatography and mass spectrometry; IRTA 5 Institut de Recerca i Tecnologia Agroalimenta`ries.
a,b,c
Least square means with different superscripts differ atP,0.05. Results are expressed in pure fat at NSVS, melted fat at CCL and AT at IRTA. Ampuero Kragten, Verkuylen, Dahlmans, Hortos, Garcia-Regueiro, Dahl, Andresen, Feitsma, Mathur and Harlizius
1638
https:/www.cambridge.org/core/terms. https://doi.org/10.1017/S1751731111000553
analysed in duplicate with differences between duplicates not exceeding 10% in all cases.
In spite of the large differences between the averages and the range of values from different laboratories, the correlations between different laboratories were high. The highest corre-lation was observed between CCL and IRTA (r50.92), and similarly, a high correlation ofr50.91 was observed between CCL and NSVS. The correlation between IRTA and NSVS was slightly lower (r50.82) but still very high compared to the differences in the mean levels and range of values. These high correlations are apparent in Figure 2 showing the relationship between the androstenone concentrations measured with TR-FIA at NSVS and with GC-MS at CCL and IRTA.
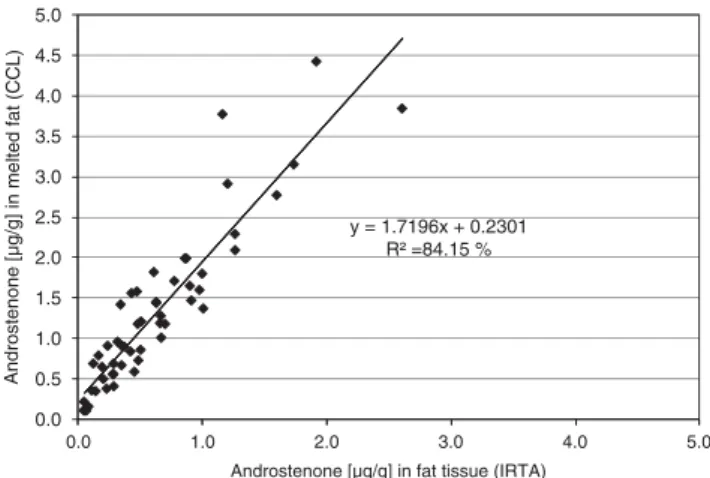
The androstenone concentrations at CCL in the Netherlands and IRTA in Spain were both estimated using a combination of GC-MS assays. However, CCL used MF samples, whereas IRTA used homogenised AT for the analysis. A comparison between the GC-MS assays using AT or MF is shown in Figure 3. The concentration estimated from MF was about 1.7 times higher than the one measured in homogenised AT.
Second inter-laboratory trial: androstenone quantification in freeze-dried AT
During the second inter-laboratory trial, the different labora-tories performed the determinations following their own protocols except for the sample preparation. The extraction step was performed directly on the freeze-dried AT (fine powder), skipping the different melting/homogenising proce-dures of the sample preparation step. The results from all four laboratories of androstenone quantification in the 10 freeze-dried fat samples are given in Table 3. Correlation coefficients for pairwise comparisons were somehow higher than those from the first trial, now ranging from 0.92 between NSVS and ALP to 0.97 between IRTA or CCL and ALP. It was more interesting to note that the range of concentrations was then similar for all four laboratories.
Indeed, by avoiding the different preparation steps which actually resulted in different types of matrices (homogenised AT, liquid fat or water-poor ‘PF’), the results from the dif-ferent laboratories were comparable as illustrated by the slopes of pairwise comparisons, ranging from 0.2 to 0.4 in the first trial to 0.7 to 0.8 in the second trial (Table 4).
However, some systematic error seems to remain as sug-gested by Figure 4. In this figure, the differences between individual measurements and the mean value per sample are shown. These differences seem to spread apart with higher concentration.
Discussion
Within-laboratory comparisons of chromatographic methods with immunochemical androstenone analyses have usually shown good agreement. Hansen-Møller (1994) found com-parable levels between HPLC and radioimmunoassay (RIA). In addition, Clauset al. (1997) found good agreement when comparing HPLC with enzyme immunoassay. In the study of Tuomola et al. (1998), supercritical fluid chromatography – mass spectrometry has shown comparable results with time-resolved fluoroimmunoassay, but the immunoassay gave slightly higher results. Although Chen et al. (2007) found good correlation (r50.9), they report an overestimation of the ELISA method compared to the HPLC assay. However, they showed comparable results between HPLC and GC-MS. In this study, large differences of androstenone determi-nations have been revealed between laboratories using dif-ferent (NSVSv.IRTA, CCL) or comparable technologies (IRTA and CCL). The fact that individual laboratory values spread over very different ranges, Figure 2, together with high inter-laboratory correlation coefficients, shows the presence of systematic errors. An important part of the differences between the results from IRTA and CCL laboratories, both using a GC-MS method, was caused by differences in the sample type: MF at CCL and AT at IRTA. Furthermore, the
y = 0.4254x + 0.2527 R² = 83.56 % y = 0.2038x + 0.1209 R² = 67.41% 0.0 0.5 1.0 1.5 2.0 2.5 3.0 3.5 4.0 4.5 5.0 0 1 2 3 4 5 6 7 8 9 10 A ndrosten one [µg/g] Androstenone [µg/g] NSVS (TR-FIA) CCL (GC-MS) IRTA (GC-MS)
Figure 2 Comparison of androstenone concentrations measured with different methods (time-resolved fluoroimmunoassay (TR-FIA) and gas chromatography and mass spectrometry (GC-MS)) in different laboratories. First trial. Results are expressed: in pure fat at Norwegian School of Veterinary Science (NSVS), melted fat at Co-operative Central Laboratory (CCL) and adipose tissue at Institut de Recerca i Tecnologia Agroalimen-ta`ries (IRTA). y = 1.7196x + 0.2301 R² =84.15 % 0.0 0.5 1.0 1.5 2.0 2.5 3.0 3.5 4.0 4.5 5.0 0.0 1.0 2.0 3.0 4.0 5.0 Androsten one [µg /g] in melted fa t (CCL)
Androstenone [µg/g] in fat tissue (IRTA)
Figure 3 Relationship between androstenone concentrations using homogenised adipose tissue Institut de Recerca i Tecnologia Agroalimen-ta`ries (IRTA) and melted fat Co-operative Central Laboratory (CCL). Both laboratories used a gas chromatography and mass spectrometry assay. First trial.
differences in level between NSVS and CCL are smaller
than those between NSVS and IRTA (TR-FIA v. GC-MS in
both cases); again, this seems to be related to sample type: NSVS uses ‘PF’, whereas CCL uses MF and IRTA AT. This was
further investigated during the second trial. In the second trial, a great part of the systematic error could be avoided by using the same preparation step, that is, freeze-drying per-formed in a single laboratory (ALP). Since the freeze-dried product was a readily dissolvable fine powder, no further preparation before extraction was needed and the matrix in which androstenone was quantified was the same in all cases. This was in contrast to the first trial where the matrix for extraction was AT, MF or water-poor ‘PF’.
During the second trial and for all laboratories, the dif-ferences from the mean spread mainly around the uncer-tainty limits of most methods (60.2 mg/g), up to around 1.2 mg/g of androstenone in AT, Figure 4. This is a crucial range as several studies situate threshold values between 1 and 0.5 mg/g of androstenone in AT. A higher spread is observed for the one sample with the highest concentration (2.26 mg/g), which is probably an indication of systematic error due to matrix-matched calibration effects.
Besides the sample type and matrix-matched calibration effects, other parameters might be important for the harmo-nisation of the analysis of androstenone in pork ‘fat’. Thus, different parameters might affect accuracy to different extents and are likely to be worth studying, including para-meters that are related to individual technologies. Owing to the good correlations and systematic deviations between labs during the first trial (Figures 2 and 3) together with mostly random deviations of the difference to mean during the second trial (Figure 4), minor, random effects might be expected, under the conditions of this study, from the heating and purification protocols in use (which might cause sample losses or specific evaporation of androstenone), insufficient extraction (related to solvent type or to sample/solvent ratio) and internalv.external calibrations.
The varying amount of humidity (12.6% to 23.8%) eva-porated from AT samples during freeze-drying in the second Table 3Concentrations of androstenone in 10 freeze-dried AT samples determined independently by four laboratories. Second trial
Sample no. NSVS (TR-FIA) (mg/g) CCL (GC-MS) (mg/g) IRTA (GC-MS) (mg/g) ALP (HPLC) (mg/g) Mean (mg/g) Median (mg/g)
1 0.48 0.59 0.4 0.44 0.48 0.46 2 0.60 0.57 0.4 0.49 0.51 0.53 3 0.44 0.57 0.5 0.58 0.52 0.54 4 0.93 1.07 0.8 0.70 0.87 0.87 5 0.39 0.65 0.5 0.72 0.57 0.58 6 0.59 1.02 0.8 0.78 0.80 0.79 7 0.88 1.00 0.8 0.89 0.89 0.89 8 0.85 1.30 1.1 1.30 1.14 1.20 9 1.42 1.13 1.2 1.31 1.26 1.25 10 2.07 2.40 1.9 2.68 2.26 2.24 Mean 0.87 1.03 0.84 0.99 0.93 0.93 s.d. 0.52 0.55 0.46 0.67 0.54 0.53 Minimum 0.39 0.57 0.4 0.44 0.48 0.53 Maximum 2.07 2.4 1.9 2.68 2.26 2.24
AT 5adipose tissue; NSVS 5 Norwegian School of Veterinary Science; TR-FIA 5 time-resolved fluoroimmunoassay; CCL 5 Co-operative Central Laboratory; GC-MS 5 gas chromatography and mass spectrometry; IRTA 5 Institut de Recerca i Tecnologia Agroalimenta`ries; ALP 5 Agroscope Liebefeld-Posieux Research Station; HPLC 5 high-pressure liquid chromatography.
All results are expressed in freeze-dried adipose tissue.
Table 4Inter laboratories relationship of androstenone analysis in a single set of freeze-dried AT samples, against ALP. Second trial
NSVS (TR-FIA) CCL (GC-MS) IRTA (GC-MS)
n 10 10 10
Slope 0.7243 0.7992 0.6778
R2 0.8496 0.9361 0.9435
R 0.9217 0.9675 0.9713
AT 5 AT 5adipose tissue; ALP 5 Agroscope Liebefeld-Posieux Research Station; NSVS 5 Norwegian School of Veterinary Science; TR-FIA 5 time-resolved fluoroimmunoassay; CCL 5 Co-operative Central Laboratory; GC-MS 5 gas chromatography and mass spectrometry; IRTA 5 Institut de Recerca i Tecnologia Agroalimenta`ries. -0.6 -0.4 -0.2 0.0 0.2 0.4 0.6 0.00 0.50 1.00 1.50 2.00 2.50 Difference to mean [µg/g]
Mean androstenone concentration [µg/g]
ALP (HPLC) CCL (GC-MS) IRTA (GC-MS) NSVS (TR-FIA)
Figure 4 Differences to mean of androstenone concentrations measured by four different laboratories in the freeze-dried adipose tissue samples. Second trial.
Ampuero Kragten, Verkuylen, Dahlmans, Hortos, Garcia-Regueiro, Dahl, Andresen, Feitsma, Mathur and Harlizius
1640
https:/www.cambridge.org/core/terms. https://doi.org/10.1017/S1751731111000553
trial (results not shown) indicates that the conversion between analyses in MF and in ‘PF’ can only be approximate. In other words, any conversion factor will have uncertainties over 10% because of the water content variability between samples. A similar situation can be expected concerning the amount of solid residues and the conversion between analyses in AT and in MF. These variations will add up when comparing between analyses in AT and in ‘PF’. Furthermore, the effect of fat-melting temperature on androstenone con-tent is not clear as the composition of the liquid fraction depends on the temperature, for example, shorter fatty acid chains liquefy first and unsaturated fatty acids liquefy before saturated fatty acids (this is the reason for using quotation marks with ‘PF’ in this study). Besides, the temperature is not constant through repeated heating cycles in a microwave oven, even if the heating power remains the same (convec-tion effect), adding to the overall variability between sam-ples. The implication of this variability appears even more complex when taking into consideration that the analysis of androstenone is mostly correlated with consumer acceptance. However, what consumers eat is not AT or MF, and even less ‘PF’, but meat with varying amounts of ‘fat’. Indeed, sampling should be related to the tissue that is presented to the con-sumer or panellist.
The correlations between estimates from different labora-tories using different methods are high. The range of values and standard deviations was different from one laboratory to the other but they were proportional to the means. Therefore, although the androstenone concentrations differ in absolute value when compared across the laboratories, the relative ranking between animals is not very different and for breeding purposes any of the laboratories can deliver useful results. Conclusions
Systematic differences were observed in the analysis of androstenone in pork fat by different laboratories using dif-ferent methodologies. These differences could be drastically lowered by using a single preparation method, that is, freeze-drying. The remaining systematic error could be due to matrix-matched calibrations as the differences tend to increase with concentration. Although there was no evi-dence here of a clear effect of the different extraction and purification protocols, they need to be specifically evaluated in order to achieve a harmonised quantification of andros-tenone across different laboratories and with different methods. The production of a reference material that could be used to standardise any analytical method would also be very helpful. Finally, it would be more than convenient to arrive at a convention about the sample preparation proto-col, in order to universally express androstenone contents on the same basis: AT, MF, water-poor ‘PF’ or others (e.g. freeze-dried) In any case, the type of matrix should peremptorily be clearly expressed with every analytical result.
Although the ranking of animals seems not to be affected by the discrepancy in androstenone determinations, the harmonisation of the analysis of androstenone, as well as
that of skatol and indole, is necessary for the study of sen-sory thresholds, the determination of consumer acceptance levels, the definition of clear criteria to sort out boar-tainted carcasses as well as for the development of non-specific online detection methods for boar taint.
Acknowledgements
The authors would like to thank TOPIGS for providing the data of entire boars and tissue sampling as well as S. Dubois for the preparation and analysis of the freeze-dried samples at the chemical department of ALP. This research project has been co-financed by the European Commission, within the 6th Frame-work Programme, contract no. FOOD-CT-2006-016250 (‘SABRE’). The study represents the authors’ views and does not necessarily represent the position of the Commission, which will not be liable for the use made of such information.
References
Andresen Ø 1974. Development of a radioimmunoassay for 5-alpha-androst-16-en-3-one in pig peripheral plasma. Acta Endocrinologica 76, 377–378. Andresen Ø 1975. 5a-Androstenone in peripheral plasma of pigs, diurnal variation in boars, effects of intravenous HCG administration and castration. Acta Endocrinologica 78, 385–391.
Annor-Frempong IE, Nute GR, Whittington FW and Wood JD 1997. The problem of taint in pork- III. Odour profile of pork fat and the interrelationships between androstenone, skatole and indole concentrations. Meat Science 47, 63–76. Babol J, Squires EJ and Gullett EA 2002. Factors affecting the level of boar taint in entire male pigs as assessed by consumer sensory panel. Meat Science 61, 33–40.
Ban˜o´n S, Costa E, Gil MD and Garrido MD 2003. A comparative study of boar taint in cooked and dry-cured meat. Meat Science 63, 381–388.
Bonneau M, Kempster AJ, Claus R, Claudi-Magnussen C, Diestre A, Tornberg E, Walstra P, Chevillon P, Weiler U and Cook GL 2000. An international study on the importance of androstenone and skatole for boar taint: I. Presentation of the programme and measurement of boar taint compounds with different analytical procedures. Meat Science 54, 251–259.
Chen G, Zamaratskaia G, Andersson HK and Lundstro¨m K 2007. Effects of raw potato starch and live weigth on fat and plasma skatole, indole and androstenone levels measured by different methods in entire male pigs. Food Chemistry 101, 439–448.
Claus R 1970. Bestimmung von Testosteron und 5a-androst-16-en-3-on, einem Ebergeruchsstoff bei Schweinen, Dissertation, Technische Hochschule
Mu¨nchen-Weihenstephan, 144pp.
Claus R 1974. Dosage radioimmunologique du 5a-androst-16-en-3-one, ste´roid responsable de l’odeur de verrat, dans le tissue adipeux duporcs. Comptes-rendus Hebdomadaires des Se´ances de l’Acade´mie des Sciences 278, 299–302. Claus R, Mahler G and Mu¨nster E 1988. Determination of the boar taint steroid 5a-androst-16-en-3-one in adipose tissue of pigs with a rapid microtitre plate enzyme-immunoassay (MTE). Archive fu¨r Lebensmittelhygiene 39, 87–90. Claus R, Herbert E and Dehnhard M 1997. Comparative determination of the boar taint steroid androstenone in pig adipose tissue by a rapid enzyme immunoassay and an HPLC-method. Archiv fu¨r Lebensmittelhygiene 48, 25–48. Font i Furnols M, Gispert M, Guerrero L, Velarde A, Tibau J, Soler J, Horto´s M, Garcı´a-Regueiro JA, Pe´rez J, Sua´rez P and Oliver MA 2008. Consumers’ sensory acceptability of pork from immunocastrated male pigs. Meat Science 80, 1013–1018.
Hansen-Møller J 1994. Rapid high-performance liquid chromatographic method for simultaneous determination of androstenone, skatole and indole in back fat from pigs. Journal of Chromatography B 661, 219–230.
Ma˚ga˚rd MA, Berg HEB, Tagesson V, Jaremo MLG, Karlsson LLH, Mathiasson LJE, Bonneau M and Hansen-Møller J 1995. Determination of androstenone in pig fat using supercritical fluid extraction and gas chromatography-mass spectro-metry. Journal of Agricultural Food Chemistry 43, 114–120.
Matthews KR, Homer DB, Punter P, Beague MP, Gispert M, Kempster AJ, Agerhem H, Claudi-Magnussen C, Fischer K, Siret F, Leask H, Font i Furnols M and Bonneau M 2000. An international study on the importance of androstenone and skatole for boar taint. III. Consumer survey in seven European countries. Meat Science 54, 271–283.
Pauly C, Spring P, O’Doherty JV, Ampuero Kragten S and Bee G 2008. Performances, meat quality and boar taint of castrates and entire male pigs fed a standard and raw potato starch enriched diet. Animal 2, 1707–1715. Pauly C, Spring P, O’Doherty JV, Ampuero Kragten S and Bee G 2009. Growth performance, carcass characteristics and meat quality of group-penned surgically castrated, immunocastrated (Improvac R
) and entire male pigs and individually penned entire male pigs. Animal 3, 1057–1066.
Pauly C, Spring-Staehli P, O’Doherty JV, Ampuero Kragten S, Dubois S, Messade`ne J and Bee G 2010. The effects of method castration, rearing condition and diet on sensory quality of pork assessed by a trained panel. Meat Science 86, 498–504.
Rius MA and Garcı´a-Regueiro JA 1988. Analysis of androstenone in pig back fat by solid-phase extraction and GC_MS. In Proceedings of the 44th International Congress of Meat Science and Technology (ed. A Diestre and JM Monfort), pp. 584–585. IRTA-Eurocarne-INIA, Barcelona, Madrid, Spain.
Rius MA, Horto´s M and Garcı´a-Regueiro JA 2005. Influence of volatile compounds on the development of off-flavours in pig back fat samples classified with boar taint by a test panel. Meat Science 71, 595–602.
Squires EJ and Lundstro¨m K 1997. Relationship between cytochrome P450IIE1 in liver and levels of skatole and its metabolites in intact male pigs. Journal of Animal Science 75, 2506–2511.
Tuomola M, Hakala M and Manninen P 1998. Determination of androstenone in pig fat using packed column supercritical fluid chromatography-mass spectro-metry. Journal of Chromatography B 719, 25–30.
Tuomola M, Harpio R, Knuuttila P, Mikola H and Lo¨vgren T 1997. Time-resolved fluoroimmunoassay for the measurement of androstenone in porcine serum and fat samples. Journal of Agricultural and Food Chemistry 45, 3529–3534. Verheyden K, Noppe H, Aluwe´ M, Millet S, Vanden Bussche J and De Brabander HF 2007. Development and validation of a method for simultaneous analysis of the boar taint compounds indole, skatole and androstenone in pig fat using liquid chromatography-multiple mass spectrometry. Journal of Chromatography A 1174, 132–137.
Walstra P, Claudi-Magnussen C, Chevillon P, von Seth G, diestre A, Matthews KR, Homer DB and Bonneau M 1999. An international study on the importance of androstenone and skatole for boar taint: levels of androstenone and skatole by country and season. Livestock Production Science 62, 15–28.
Weiler U, Font i Furnols M, Fisher K, Kemmer H, Oliver MA, Gispert M, Dobrowolski A and Claus R 2000. Influence of differences in sensitivity of Spanish and German consumers to perceive androstenone on the acceptance of boar meat differing in skatole and androstenone concentrations. Meat Science 54, 297–304.
Ampuero Kragten, Verkuylen, Dahlmans, Hortos, Garcia-Regueiro, Dahl, Andresen, Feitsma, Mathur and Harlizius
1642
https:/www.cambridge.org/core/terms. https://doi.org/10.1017/S1751731111000553