SNPs by AFLP (SBA): a rapid SNP isolation strategy
for non-model organisms
Jean-Claude Nicod and Carlo R. LargiadeÁr*
CMPG, Zoological Institute, University of Bern, Baltzerstrasse 6, CH-3012 Bern, Switzerland
Received November 6, 2002; Revised December 20, 2002; Accepted January 2, 2003 DDBJ/EMBL/GenBank accession nos+
ABSTRACT
Despite the great potential of single nucleotide poly-morphism (SNP) markers in evolutionary studies, in particular for inferring population genetic par-ameters, SNP analysis has almost exclusively been limited to humans and `genomic model' organisms, due to the lack of available sequence data in non-model organisms. Here, we describe a rapid and cost effective method to isolate candidate SNPs in non-model organisms. This SNP isolation strategy consists basically in the direct sequencing of ampli-®ed fragment length polymorphism bands. In a ®rst application of this method, 10 unique DNA frag-ments that contained 24 SNPs were discovered in 11.11 kb of sequenced genomic DNA of a non-model species, the brown trout (Salmo trutta).
INTRODUCTION
Single nucleotide polymorphisms (SNPs) are the most abundant resources of genetic variation among individuals of a species. They are currently in the center of interest concerning genome-wide studies, especially in human disease gene mapping (1) and human evolution (2). However, despite the great potential of SNP markers in evolutionary studies, in particular for inferring population genetic parameters (3,4), SNP analysis has almost exclusively been limited to humans and `genomic model' organisms (5). Because of the lack of available sequence data in non-model organisms, the major hurdle consists in the development of ef®cient and ¯exible SNP isolation strategies (5).
SNPs are usually discovered by the sequencing of homologous fragments of genomic DNA (6). Several screen-ing strategies for SNP isolation have been described so far: locus-speci®c ampli®cation (LSA) and comparative sequen-cing from multiple individuals (7), expressed sequence tags (ESTs) sequencing (8), whole-genome shotgun sequencing (9) and, more recently, reduced representation shotgun sequen-cing (RRS; 10). Finally, high-density oligonucleotide arrays have been shown to be useful for ef®cient SNP discovery and screening in humans (11). Unfortunately, all these procedures are currently too expensive and too time consuming, particu-larly for small- to medium-scale DNA sequencing laboratories
(12,13). The development of a more ef®cient method for the isolation of SNPs, which is especially suited to develop a couple of hundred unlinked SNP markers for population genetic studies in any species including domesticated species, is therefore highly desirable (e.g. bovine SNP-based markers for individual identi®cation and paternity testing; 8).
In order to de®ne an ef®cient SNP isolation strategy, we ®rst need to identify the most laborious and expensive steps of `traditional' SNP isolation procedures. As a matter of fact, the aforementioned methods require either the design of a speci®c pair of primers for each DNA fragment in order to amplify homologous copies of loci (e.g. LSA), or an additional cloning step (e.g. RRS). Consequently, the time and expenses required for these procedures are proportional to the number of fragments screened. Thus, the primary aim should be the reduction of primers needed for the LSA and/or to avoid extensive cloning.
The ampli®ed fragment length polymorphism (AFLP) method is a PCR-based DNA ®ngerprinting technique (14) that has been successfully applied to a wide range of organisms with a broad application in systematics, pathotyp-ing, population genetics and quantitative trait loci mapping (15). Recently, two studies reported the isolation of SNP markers from AFLP bands involving both a band-speci®c PCR ampli®cation and a cloning step (13,16).
In this study, we present a highly ef®cient and ¯exible AFLP-based SNP isolation strategy that does not require any cloning steps and that allows a reduction of the number of primers needed for the LSA to a handful, virtually independent of the number of DNA fragments screened. We tested the method by applying it to a non-model species, the brown trout (Salmo trutta), which is an abundant freshwater ®sh in Europe. Finally, we discuss the potential of this method for controlling the degree of the ascertainment bias due to sampling strategies (compare with 2).
MATERIALS AND METHODS
Biological material and DNA extraction
Whole genomic DNA was extracted from 16 brown trout ®n samples that had been stored in absolute ethanol using a standard phenol±chloroform extraction protocol (http:// www.inapg.inra.fr/dsa/microsat/microsat.htm). Samples had been collected from six populations in Switzerland. Detailed
*To whom correspondence should be addressed. Tel: +41 31 631 4513; Fax: +41 31 631 48 88; Email: [email protected]
+AJ535561±AJ535589
information on the sampling locations of the analyzed trout individuals is available from the authors upon request. AFLP analysis
We used the `AFLP analysis system 1' kit (Gibco BRL, Rockville, USA; cat. no. 10544-013) following the instruc-tions of the manufacturer to generate AFLP ®ngerprints. The protocol of the kit has originally been described in detail by Vos et al. (14), who summarized the method as follows. The AFLP technique is based on the selective PCR of restriction fragments from a total digest of genomic DNA. The technique involves three steps: (i) restriction of the DNA and ligation of oligonucleotide adapters; (ii) selective ampli®cation of sets of restriction fragments and (iii) gel analysis of ampli®ed fragments. PCR ampli®cation of restriction fragments is achieved by using the adapter and restriction site sequence as target sites for primer annealing. The selective ampli®ca-tion is achieved by the use of primers that extend into the restriction fragments, amplifying only those fragments in which the primer extensions match the nucleotides ¯anking the restriction site.
Electrophoretic separation and visualization of the AFLP bands was performed according to Grif®ths and Orr (17). From the 64 primer combinations provided by the kit (EcoRI/ MseI), we used the following eight randomly chosen primer combinations: E-ACC/M-CTG, E-ACT/M-CTG, E-ACT/ M-CTA, E-ACA/M-CTA, E-ACA/M-CTC, E-ACC/M-CTC, E-ACC/M-CAG and E-AAG/M-CAG.
Isolation of bands of interest
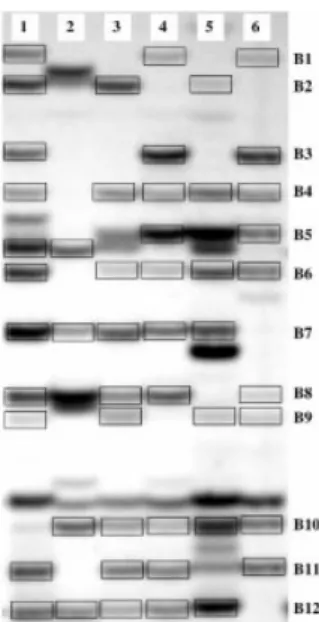
The following band selection criteria, which are illustrated in Figure 1, were applied as an enrichment strategy for the isolation of several homologous copies of a particular DNA fragment. (i) Only clearly visible and distinct bands that were present at least in two individuals (i.e. that displayed the same electrophoretic mobility) were selected. This criterion is based on the assumption that equal mobility is a good predictor of homology and aims at ensuring that at least two homologous copies of any selected DNA fragment can potentially be analyzed. (ii) Bands that were present in all screened individuals were not chosen, because we argued that bands that are polymorphic in terms of presence and absence are less prone to represent repeated DNA elements.
Bands were selected by eye, excised from the dried gel with a clean scalpel and placed individually into PCR tubes containing 50 ml of 13 PCR buffer [Qiagen, Basel, Switzerland; buffer contains Tris±HCl, KCl, (NH4)2SO4,
concentrations kept con®dential by company]. The gel pieces were then incubated for 2 h at 68°C in order to elute the DNA fragments. Then incubation buffer was stored at 4°C up to several weeks before using it as a template for PCR re-ampli®cation of the bands.
Band re-ampli®cation and sequencing
PCR ampli®cations were carried out in volumes of 20 ml using a PTC100Ô-machine (MJ Research, Waltham, USA). Two microliters of eluted DNA mix was added to the PCR mix composed of 10 ml deionized water, 2 ml of PCR 103 buffer (Qiagen), 2 ml 2.5 mM dNTP, 2 pmol of each EcoRI-core and MseI-core primers and 1 U of Taq polymerase. Reaction conditions were as follows: an initial 2 min denaturation step
at 94°C, 30 cycles consisting of 30 s at 94°C, 30 s at 50°C, 2 min at 72°C extension, and a ®nal extension step at 72°C for 5 min. PCR products were then checked with agarose gel (1.5%) electrophoresis and puri®ed with QIAquickâ PCR
puri®cation kit (Qiagen). Single strand sequencing was done either with EcoRI-core primer or MseI-core primer by using the BigDye Terminator v3.0Ô cycle sequencing kit (Applied BioSystems, Foster City, USA) according to the manufactur-er's instructions on an automated capillary electrophoresis sequencer, model ABI 3100 (Applied BioSystems).
Candidate SNP identi®cation
Sequences were ®rst base-called and aligned using the Sequence Analysis program (Applied BioSystems) and the BioEdit v5.0.9 sequence alignment editor (18). Then nucle-otide BLAST searches were carried out for quickly revealing similarities between the obtained sequences and database sequences using the NCBI server (http://www.ncbi.nlm.nih. gov/BLAST). BLAST parameters were set to default values; nr for database (includes all GenBank, EMBL, DDBJ, PDB sequences but no EST, STS, GSS, or phase 0, 1 or 2 HTGS sequences) and Expect threshold = 10. Each sequence was processed with ®ltering programs for masking repeated elements (SINEs) and VNTRs (minisatellites and micro-satellites). The Repeat Masker program (A.F.D.Smit and P.Green, unpublished; http://repeatmasker.genome. washington.edu/cgi-bin/RM2_req.pl) was used to search and detect sequences that were homologous to interspersed repetitive elements of vertebrates. The Tandem repeats ®nder program (19; http://c3.biomath.mssm.edu/trf.html) was used to locate and display tandem repeats in DNA sequences. SNP ®rst step validation
Homologous sites from each locus alignment that appeared to exhibit sequence variation, either in heterozygous or
Figure 1. AFLP pro®le in six brown trout individuals (1±6) generated with the primer combination E-AAG/M-CAG. The approximate size range of the bands displayed in the ®gure is 250±350 bp. Boxes indicate copies of the 12 AFLP bands (B1±B12) that comply with the selection criteria for direct sequencing described in the Materials and Methods section.
homozygous forms were ®rst evaluated by manual inspection (7). SNPs were ®rst checked by eye looking at the alignments and chromatograms. Heterozygous positions were detected as multiple peaks at the same position in DNA sequence chromatograms as shown in Figure 2 (compare with 20). Then, each ABI sequence trace was re-processed with the LifeTrace base-calling program (21), to obtain base quality values and to discern true allelic variations from base-calling errors and sequencing artifacts. Only SNPs that were surrounded by bases showing good qualities (LifeTrace score q > 20) were taken in account and considered as valuable `candidate' SNPs.
SNP second step validation by cloning
In order to con®rm ®rst step validation of some candidate SNPs and to assess the causes of low quality sequence data observed for some bands, we cloned several re-ampli®ed bands using the AdvanTAgeÔ PCR cloning kit according to the manufacturer's instructions (Clontech, Basel, Switzerland). In total four individual fragments corresponding to two different loci either showing homozygote or hetero-zygote SNP allelic states, and three individual fragments that showed low quality signal after direct sequencing (i.e. high background data), were cloned using freshly ampli®ed and unpuri®ed PCR products. Cloned products were then puri®ed using the QIAprep Spin Miniprep KitÔ (Qiagen). Eight to 10 independent clones for each fragment were sequenced with M13 universal forward primer and compared on the basis of respective sequences alignment.
An alternative and independent method was applied for a second step SNP validation. Speci®c primer pairs for the bands containing candidate SNPs were designed. With these
primers, the candidate SNP containing regions were PCR ampli®ed from genomic DNA of the same trout individuals that had been analyzed in the AFLP screen. The PCR products were then puri®ed and directly sequenced with the speci®c primers following the same protocols as were used for the re-ampli®cation and sequencing of AFLP bands given above.
RESULTS
AFLP data, re-ampli®cation and sequencing success Regarding the band selection criteria (detailed in the Materials and Methods section), the eight AFLP primer combinations yielded on average 40 selectable bands or ~50% of all visible bands in the size range of 100±700 bp. Thus, we observed a total of 320 bands that were shared at least between two individuals. Re-ampli®cation success of the extracted indi-vidual band copies was nearly 90% (155 out of 176 PCRs, respectively). Fifty-®ve bands were sequenced on average for 2.56 individuals (range 1±6 individuals), which correspond to 141 individual band copies in total. Forty-eight percent of these 141 individual band copies yielded reliable sequence data (LifeTrace score q > 20) (19) representative for 29 of the 55 analyzed bands. For 24 or 80% of these 29 bands, good quality and identical sequence data were obtained for at least one additional individual. All sequences were submitted to EMBL under the accession nos AJ535561±AJ535589. The BLAST searches indicated that four bands contained DNA sequences similar to known repetitive elements. In all cases, it concerned the Hpa I SINE family of salmonid ®shes.
The size range of the sequenced bands was 140±680 bp. A non-parametric Mann±Whitney U-test (compare with 22) comparing the band sizes of successfully sequenced bands with the sizes of the remaining bands provided no indication that sequencing success was related to band size (P-value = 0.375). The sequence analysis of three cloned PCR products revealed the presence of multiple non-homologous DNA fragments in bands that yielded low quality sequence data (i.e. high background signal) when directly sequenced.
SNP discovery, ®rst and second step validation of candidate SNPs
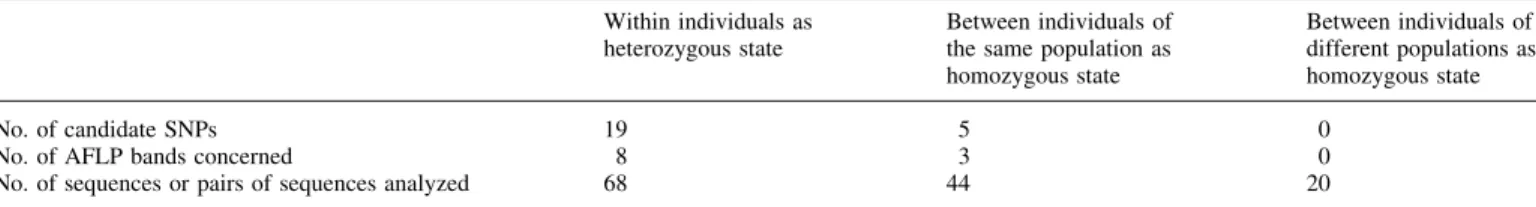
In total, 24 candidate SNPs were discovered among 10 of the 29 successfully sequenced bands. Up to seven candidate SNPs were found within a single band. The 29 bands sum up to ~11.11 kb DNA sequence, thus, on average one SNP out of every 463 base positions. Nineteen candidate SNPs were detected within individuals, i.e. they occurred in heterozygous state; the remaining ®ve candidates were discovered by comparing band copies from different individuals of the same population (Table 1). In these cases, individual band copies represent either homozygous states (two copies of the same allele) or a single allele copy. No candidate SNPs were detected by comparisons between individuals from different populations. The ratio between transitions and transversions was 1.4.
For six candidate SNPs, the allelic states were con®rmed by the sequencing of several clones derived from PCR products of band re-ampli®cations. A total of 12 candidate SNPs were con®rmed by the independent PCR ampli®cation and sequencing of AFLP band segments with speci®c primers.
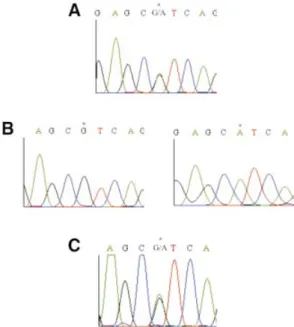
Figure 2. (A) Electropherogram data of a candidate SNP discovered in brown trout by direct sequencing of a re-ampli®ed AFLP band. (B) Electropherogram data of the homologous region in two clones derived from the re-ampli®ed band shown in (A). (C) Electropherogram data of the candidate SNP region obtained by LSA and direct sequencing of the same individual as in (A). The position of the SNP is indicated by asterisks.
Furthermore, no inconsistencies were detected with this second validation method, i.e. all candidate SNPs were con®rmed in all AFLP band segments that could successfully be ampli®ed. An example for both second step validation procedures is given in Figure 2.
DISCUSSION
Our analysis of brown trout samples suggests that direct sequencing of AFLP bands represents a highly ef®cient method to isolate candidate SNPs in non-model species. Using the method described here, we were able to discover rapidly 24 SNPs analyzing 55 AFLP bands. The successful validation of candidate SNPs by cloning and by LSA shows that SNP discovery through direct sequencing of AFLP bands is reliable and does not lead to extensive false inclusion of base-calling errors and sequencing artifacts if candidate SNP identi®cation is based on stringent base-calling quality criteria (i.e. LifeTrace score q > 20). These results are encouraging, indicating that SNPs can be isolated from AFLP ®ngerprints in numbers that are suitable for population genetics studies. A rough extrapolation of the 24 SNPs identi®ed obtained from analyzing 55 AFLP bands indicates that an isolation of a couple of hundred candidate SNPs involves about the same expenses and time effort as is usually invested to isolate microsatellite markers for population genetic studies in non-model species (23). Thus, further tests of the applicability of this SNP isolation strategy in other species would be very promising.
The major advantage of the method resides in the fact that several copies of the same DNA fragment can be sequenced without the need of cloning step and speci®c primer design. In most cases, the sequencing of one particular AFLP band yields already information of two homologous copies. Indeed our data shows that most candidate SNPs are discovered within individuals, i.e. in heterozygous state. Furthermore, our assumption for selecting bands of interest, regarding equal electrophoretic mobility, is a good indicator for sequence homology. This was at least con®rmed for 80% of the bands that could successfully be sequenced. Thus, the number of screened homologous copies can easily be increased by sequencing bands of equal electrophoretic mobility of several individuals, which obviously increases the probability of detecting existing SNPs in a particular DNA fragment.
Theoretically AFLP ®ngerprints can be generated for any organisms (14,15). However, the ef®ciency of the AFLP-based SNP isolation strategy depends critically on the proportion of AFLP bands that represent unique DNA fragments and that are not dif®cult to sequence due to structural problems. Repetitive elements probably do not represent a major problem in this context, as it was shown that
AFLP ®ngerprints of higher plant species, which contain high numbers of repeated sequences, consisted predominantly of unique AFLP fragments, but are characterized by the presence of a small number of more intense fragments (14). We hypothesize that such bands can effectively be avoided by not selecting bands that are present in all screened individuals [compare with band selection criterion (ii) in the Materials and Methods section].
The analysis of cloned AFLP bands, which did not yield interpretable sequence data when directly sequenced, suggests that the extent of size homoplasy among AFLP markers may be the most in¯uential factor determining the proportion of unique DNA fragments that can be analyzed for a given species. Moreover, simulation studies indicated very strong expected size homoplasy for two plant models and that the chance of size homoplasy decreases with increasing fragment size (24). Such a correlation should result in a higher rate of sequencing failures for small AFLP bands than for large AFLP bands; however, probably due to the limited number of bands analyzed in this study, we were not able to detect a signi®cant difference in the mean size between bands that could be successfully sequenced and bands that could not. In any case, it seems logical to assume that the higher the density of visible bands in a particular AFLP ®ngerprint, the higher the probability of size homoplasy. Based on our study, we are not able to give accurate recommendations on the band density of AFLP ®ngerprints that would be suitable for our SNP isolation strategy regarding the problem of size homoplasy. For practical reasons, the number of restriction fragments that are ampli®ed and detected on a denaturing polyacrylamide gel should not exceed 100. Above this number many bands cannot be clearly separated from each other, and thus cannot unambiguously be excised from the gel. Strategies for `tuning' the band densities in AFLP ®ngerprints are for example discussed in detail in Vos et al. (14).
The ef®ciency of the described method also depends on the SNP density in the organism under study. Although it was not in the scope of this study to obtain statistical sound estimates on SNP density in brown trout, it is noteworthy in this context that the SNP density estimated from the brown trout AFLP bands (one SNP out of every 463 base positions) is similar to recent estimates for the human genome (one SNP out of every 300±500 base positions; 3).
Concerning the inference of population genetic parameters, `traditional' SNP isolation strategies are prone to introduce a problem known as the ascertainment bias (compare with 2). This is especially true for methods that take advantage of DNA pooling procedures of several individuals (e.g. RRS; 10) in order to increase the probability of SNP detection. Ascertainment bias refers to a systematic distortion in measuring the true frequency of a phenomenon due to the
Table 1. Candidate SNPs discovered in directly sequenced brown trout AFLP bands Within individuals as
heterozygous state Between individuals ofthe same population as homozygous state
Between individuals of different populations as homozygous state
No. of candidate SNPs 19 5 0
No. of AFLP bands concerned 8 3 0
way in which the data are obtained. Theoretical treatment of this problem clearly indicates that the information on how SNPs were isolated (e.g. in which sample, in which population etc.) is fundamental for an appropriate analysis (4). Moreover, it was also empirically shown that SNP-based variability estimates are highly dependent on the population used to isolate the SNP markers (5). Although not illustrated in detail in this paper, our method provides some means to control for ascertainment bias by knowing the exact source of a candidate SNP and by providing in some cases information on the allelic state of that SNP. Moreover, using the AFLP ®ngerprinting procedure enables one to screen a large set of individuals, and thus various populations. Therefore, with the here described SNP isolation strategy, anyone considering the development of an SNP panel in any given species can easily adapt the isolation strategy (e.g. choice of individuals and populations) according to the questions one intends to address.
ACKNOWLEDGEMENTS
We thank Laurent Excof®er, Grant Hamilton and other members of the CMPG for fruitful discussions and technical assistance. We thank two anonymous reviewers for helpful suggestions and Eric Desmarais for sharing his knowledge on ®ngerprinting and polyacrylamide band gel cutting and soaking. This work was supported by the BUWAL research grant F-01-9825.
REFERENCES
1. Wang,D.G, Fan,J.-B., Siao,C.-J., Berno,A., Young,P., Sapolsky,R., Ghandour,G., Perkins,N., Winchester,E. and Spencer,J. (1998) Large-scale identi®cation, mapping and genotyping of single-nucleotide polymorphisms in the human genome. Science, 280, 1077±1082. 2. Stoneking,M. (2001) Single nucleotide polymorphisms: from the
evolutionary past. Nature, 409, 821±822.
3. Nielsen,R. (2000) Estimation of population parameters and recombination rates from single nucleotide polymorphisms. Genetics, 154, 931±942.
4. Kuhner,M.K., Beerli,P., Yamato,J. and Felsenstein,J. (2000) Usefulness of single nucleotide polymorphism data for estimating population parameters. Genetics, 156, 439±447.
5. SchloÈtterer,C. and Harr,B. (2002) Single nucleotide polymorphisms derived from ancestral populations show no evidence for biased diversity estimates in Drosophila melanogaster. Mol. Ecol., 11, 947±950. 6. Qingbo,L., Zhaowei,L., Monroe,H. and Culiat,C.T. (2002) Integrated
platform for detection of DNA sequence variants using capillary array electrophoresis. Electrophoresis, 23, 1499±1511.
7. Primmer,C.R., Borge,T., Lindell,J. and Saetre,G.P. (2002) Single-nucleotide polymorphism characterization in species with limited available sequence information: high nucleotide diversity revealed in the avian genome. Mol. Ecol., 11, 603±612.
8. Heaton,M.P., Harhay,G.P., Bennett,G.L., Stone,R.T., Grosse,M.W., Casas,E., Keele,J.W., Smith,T.P.L., Chitko-McKown,C.G. and Laegreid,W.W. (2002) Selection and use of SNP markers for animal identi®cation and paternity analysis in U.S. beef cattle. Mamm. Genome, 13, 272±281.
9. Weber,J.L. and Myers,E.W. (1997) Human whole-genome shotgun sequencing. Genome Res., 7, 401±409.
10. Altshuler,D., Pollara,V.J., Cowles,C.R., Van Etten,W.J., Baldwin,J., Linton,L. and Lander,E.S. (2000) An SNP map of the human genome generated by reduced representation shotgun sequencing. Nature, 407, 513±516.
11. Dong,S., Wang,E., Hsie,L., Cao,Y., Chen,X. and Gingeras,T.R. (2001) Flexible use of high-density oligonucleotide arrays for single-nucleotide polymorphism discovery and validation. Genome Res., 11, 1418±1424. 12. Ware,J.L., Moran,L., Lin,C.-L. and Slatko,B. (2000) Implementation of
automation in a small-scale DNA sequencing core facility. J. Biom. Tech., 11, 151±154.
13. Meksem,K., Ruben,E., Hyten,D., Triwitayakorn,K. and Lightfoot,D.A. (2001) Conversion of AFLP bands into high-throughput DNA markers. Mol. Genet. Genomics, 265, 207±214.
14. Vos,P., Hogers,R., Bleeker,M., Reijans,M., van de Lee,T., Hornes,M., Frijters,A., Pot,J., Peleman,J. and Kuiper,M. (1995) AFLP: a new technique for DNA ®ngerprinting. Nucleic Acids Res., 23, 4407±4414. 15. Mueller,U.G. and Wolfenbarger,L.L. (1999) AFLP genotyping and
®ngerprinting. Trends. Ecol. Evol., 14, 389±394.
16. Bensch,S., Akesson,S. and Irwin,D.E. (2002) The use of AFLP to ®nd an informative SNP: genetic differences across a migratory divide in willow warblers. Mol. Ecol., 11, 2359±2366.
17. Grif®ths,R. and Orr,K. (1999) The use of AFLP in the isolation of sex-speci®c markers. Mol. Ecol., 8, 671±674.
18. Hall,T.A. (1999) BIOEDIT: a user-friendly biological sequence alignment, editor and analysis program for Windows 95/98/NT. Nucleic Acids Symp. Ser., 41, 95±98.
19. Benson,G. (1999) Tandem repeats ®nder: a program to analyze DNA sequences. Nucleic Acids Res., 27, 573±580.
20. Fahrenkrug,S.C., Freking,B.A., Smith,T.P.L., Rohrer,G.A. and Keele,J.W. (2002) Single nucleotide polymorphism (SNP) discovery in porcine expressed genes. Anim. Genet., 33, 186±195.
21. Walther,D., Bartha,G. and Morris,M. (2001) Basecalling with LifeTrace. Genome Res., 11, 875±888.
22. Sokal,R.R. and Rohlf,F.J. (1995) Biometry: The Principles and Practice of Statistics in Biological Research, 3rd Edn. W.H. Freeman and Company, New York, NY.
23. Zane,L., Bargelloni,L. and Patarnello,T. (2002) Strategies for microsatellite isolation: a review. Mol. Ecol., 11, 1±16.
24. Vekemans,X., Beauwens,T., Lemaire,M. and RoldaÂn-Ruiz,I. (2002) Data from ampli®ed fragment length polymorphism (AFLP) markers show indication of size homoplasy and of a relationship between degree of homoplasy and fragment size. Mol. Ecol., 11, 139±151.