Arabidopsis transcript profiling on Affymetrix GeneChip arrays
Lars Hennig
1,∗,+, Margit Menges
2,+, James A.H. Murray
2and Wilhelm Gruissem
11Institute of Plant Sciences, Swiss Federal Institute of Technology, ETH Zentrum, Universitätstrasse 2, 8092
Zürich, Switzerland (∗author for correspondence; email [email protected]);2Institute of Biotechno-logy, University of Cambridge, Tennis Court Road, Cambridge CB2 1QT, UK;+these authors contributed equally to this paper
Received 21 October 2003; accepted in revised form 23 October 2003
Key words: Affymetrix, Arabidopsis, cell suspension, microarray, transcriptional profiling
Abstract
DNA microarrays are becoming a frequently used research tool. Whilst several studies have confirmed the repro-ducibility of analysing the same RNA samples on duplicate arrays, there is little analysis of the reprorepro-ducibility of the results of transcript profiling between microarrays carrying different probes to a common set of genes. To address this question, we compared the performance and reproducibility of two microarrays commonly used in plant research, the Affymetrix Arabidopsis AG array containing more than 8000 probe sets and the Affymetrix Arabidopsis ATH1 array containing more than 22 000 redesigned probe sets. A total of 21 different RNA samples were labelled and hybridized in parallel to the two microarray types. Focusing on the overlap of more than 7300 targets detected with both arrays, we found a high degree of reproducibility. Despite the use of different probe sets, both signal and signal log ratio were very similar for most genes. However, genes that were called absent or not changed by Affymetrix’ statistical algorithm implemented in MAS5.0 showed considerably less conservation of expression patterns. Moreover, we identified about 300 genes that yielded strongly different measurements with the two microarrays, emphasizing that RNA profiling data need careful interpretation. Overall, this study shows that results obtained with ATH1 and AG arrays are very comparable and hence that the analysis is largely independent of probe sets. However, the result emphasize the need for appropriate filtering schemes such as those based on the present and change calls provided by MAS5.0 rather than reliance solely on signal values.
Abbreviations: A, absent; D, decreased; I, increased; NC, not changed; SLR, signal log ratio
Introduction
High-throughput technologies for transcriptional pro-filing have strongly advanced our biological know-ledge during recent years (Holloway et al., 2002). Several techniques are commonly used to measure simultaneously the abundance of transcripts of many or even all genes of an organism. These techniques include cDNA or oligonucleotide-based microarrays (Southern et al., 1992; Schena et al., 1995), serial analysis of gene expression (SAGE; Velculescu et al., 1995), massively parallel signature sequencing of at-tached amplified cDNA to microbeads (MPSS; Bren-ner et al., 2000) and different gel-based technologies
to identify genes that are differentially expressed (Li-ang and Pardee, 1992; Breyne and Zabeau, 2001). Among these, microarray-based techniques are prob-ably the most rapidly growing tool for RNA profiling (Holloway et al., 2002), either based on the spot-ting of oligonucleotides or cDNAs onto a solid matrix (Schena et al., 1995), or the photolithographic in situ synthesis of oligonucleotides (Lockhart et al., 1996; Wodicka et al., 1997; Lipshutz et al. 1999). Such in situ synthesized microarrays are manufactured by Affymetrix (Santa Clara, CA) under the trade mark GeneChip and are advertised to offer high reprodu-cibility. During the past few years, many laboratories have performed a large number of microarray
exper-iments with both spotted microarrays and Affymetrix GeneChip. Despite the widespread use of microarray data, there is no consensus view on how to compare results produced in the various platforms. Moreover, interpretation of microarray data is extremely depend-ent on analysis algorithms, such as normalization procedures. It is therefore important to understand to what degree different platforms or methodologies are comparable.
In Arabidopsis thaliana, more than a dozen stud-ies have been reported involving the Affymetrix AG GeneChip containing more than 8000 probe sets. Examples include analysis of the circadian rhythm (Harmer et al., 2000), hormone action (Goda et al., 2002; Müssig et al, 2002; Rashotte et al., 2003), stress responses (Kreps et al., 2002), the cell cycle (Menges et al., 2002), developmental programs (Tepperman et al., 2001; Che et al., 2002; Honys and Twell, 2003; Köhler et al., 2003), responses to pathogens (Puthoff et al., 2003; Tao et al., 2003) and of plants with altered metabolism (Laule et al., 2003). Recently, Affymetrix released the ATH1 Arabidopsis GeneChip which contains more than 22 000 redesigned probe sets covering most identified cDNA and open reading frames. This new GeneChip offers unique opportun-ities to probe the expression of almost every gene in Arabidopsis. Nonetheless, many research groups are still analysing experiments performed with the much smaller AG array and for cost reasons are reluct-ant to repeat the entire profiling experiment. Here, we present a systematic comparison of Affymetrix’ AG and ATH1 Arabidopsis GeneChip and show that data obtained with both array types correlate strongly provided effective filtering is applied.
Materials and methods
Array hybridization and evaluation
Experimental procedures are described following the ‘minimum information about a microarray experiment (MIAME)’ standards (Brazma et al., 2001).
Experimental design
Arabidopsis thaliana (L.) Heynh. suspension cells (accession Landsberg erecta, cell line MM2d) were cultured as described (Menges and Murray, 2002). Ex-perimental design and treatment of cells generating 21 biological samples have been described previously (Menges et al., 2002, 2003).
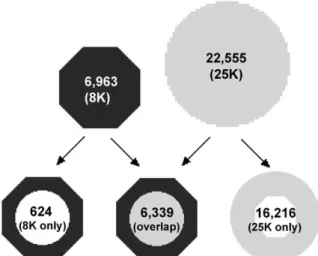
Figure 1. Design features of AG and ATH1 GeneChips.
Array design
Affymetrix Arabidopsis AG and ATH1 GeneChips was used throughout the experiment (Affymetrix, Santa Clara, CA). The exact list of probes present on the arrays can be obtained from the manufac-turer’s web site (http://www.affymetrix.com). Ana-lysis was based on annotations compiled by TAIR (http://www.arabidopsis.org).
Samples
Total RNA was prepared from suspension cells as described previously (Riou-Khamlichi et al., 2001) by hot-phenol extraction followed by a lithium chlor-ide precipitation step (Verwoerd et al., 1989). Total RNA (20 µg) was used to prepare cDNA with the Superscript Double-Stranded cDNA Synthesis Kit (In-vitrogen) according to the manufacturer’s instructions with oligodT-T7 oligonucleotides (GGCCAGTGAAT-TGTAATACGACTCACTATAGG
GAGGCGG(dT)24). The cDNA was subjected to in
vitro transcription in the presence of 2 mM each biotin-11-CTP and biotin-16-UTP (ENZO Life Sci-ences, Farmingdale, NY) with the MegaScript High Yield Transcription Kit (Ambion, Austin, TX). After purification of the cRNA on RNeasy columns (Quia-gen, Hilden, Germany), 15 µg cRNA was fragmented in a volume of 40 µl as recommended by Affymetrix. Hybridization
The fragmented 15 µg of labelled cRNA was dena-tured for 5 min at 99 ˚C and hybridized to the arrays for 16 h as recommended by Affymetrix. Washing and detection of labelled cRNA with
streptavidin-Table 1. Design features of AG and ATH1 GeneChips.
AG ATH1 Comparison AG_ATH1 Unique on AG Total number of IDs 8297 22814 7388 866
Annotated IDs (MIPS) 8112 22736 7388 724
Non-annotated IDs 185 78 0 142 Unique genes 6963 22555 6339 624 Duplicates (2×) 445 78 401 44 Duplicates (3×) 70 3 66 4 Duplicates (4×) 11 2 11 0 Duplicates (5×) 1 0 1 0 Duplicates (8×) 0 1 0
Figure 2. Distribution of calls. Numbers of pairs of calls (AG, ATH1) were determined for 21 (presence call) and 18 (change call) pair-wise comparisons. Values are mean± SD.
phycoerythrin were performed according to the man-ufacturer’s instructions with the EukGE-WS2v3 pro-tocol involving two streptavidin-phycoerythrin la-belling steps.
Measurements
The arrays were scanned with a confocal scanner (Affymetrix).
Evaluation, normalization and data analysis
Raw data were processed with the statistical algorithm of the Affymetrix Microarray Suite 5.0 as described (Liu et al., 2002). Subsequent data processing and display were done with MS-Access 2000, Sigmaplot 7.0 and the statistic package R (version 1.6.1) which is freely available at http://www.r-project.org/ (Ihaka and Gentleman, 1996).
Results and discussion
Design features of the AG and ATH1 Arabidopsis GeneChips
We first compared the probe sets present on both mi-croarrays. The AG array contains 8297 probe sets and the new ATH1 array contains 22 814 probe sets (Figure 1). Based on annotations compiled by TAIR (http://www.arabidopsis.org), 7388 transcripts are tar-geted by probe sets on both arrays (Table 1). On the AG array, 527 targets were detected by more than one probe set, while only 84 transcripts were detected by two or more probe sets on the ATH1 array. Notably, expression of 672 genes can only be detected using the smaller AG array. Subsequently, we focused on the results for the 7388 targets common to both ar-rays. Probes selected by Affymetrix are not always specific for transcripts derived from a single gene and the suffix of the probe set identifier indicates the
ex-Table 2. Non-unequivocal probe sets among the overlap of both microarrays.
Probe IDs AG ATH1 (in overlap) _s_at 1411 299 _i_at 183 0 _g_at 196 0 _f_at 105 0 _r_at 60 0 _x_at 0 7
pected degree of specificity (compare information at www.affymetrix.com). Table 2 lists the fraction of such non-unequivocal probe sets among the selected 7388 targets common to both arrays.
Comparison of presence and change calls
RNA from 21 different biological samples was la-belled and hybridized to Arabidopsis AG and ATH1 GeneChips. Scanned images were analysed with MAS5.0. The 2 × 21 profiling results were com-pared pair-wise to establish general patterns of data similarity.
Because several (11–20) probe pairs exist on Af-fymetrix GeneChips for each target transcript, the distribution of their hybridization intensity can be used to derive presence calls, which indicate the reliable above-background detection of the transcript. On av-erage, more than 80% of the targets had identical presence calls on both array types (Figure 2) and less than 10% of the targets were detected by only one array (Table 3). The number of present targets did not differ significantly between the two arrays. This suggests that neither microarray type has signi-ficant higher sensitivity to detect more of the weakly expressed genes. The RNA samples were derived from different time course experiments and we used the comparative analysis algorithm in MAS5.0 to ob-tain difference calls and signal log ratios (SLR) for each time point compared to its corresponding t0.
Difference calls were compared for all pairs of corres-ponding data obtained with the AG and ATH1 arrays and results were averaged. Similar to the present calls, the difference calls were also usually identical (82%) on both array types (Figure 2). However, the major-ity of targets were classified as ‘not changed’ (NC) and only about 30% were called ‘decreased’ (D) or ‘increased’ (I). The probability that a transcript was called D or I on one array and had a NC call on
Table 3. Similarity of presence calls. ATH1| AG Mean SD P P 3606 155 A A 2557 98 M M 4 2 P A 518 96 A P 480 116 P M 59 14 M P 51 9 A M 58 8 M A 56 9 total 7388 0 Identical calls 0.835 0.010 Opposite calls 0.135 0.010 P at ATH1 4183 162 P at AG 4137 168 ATH1 – AG1 45 218 1The difference of the number of present targets on both arrays was calculated for each RNA sample. Shown is the average across all 21 samples.
the other array was almost 30%, indicating a relat-ively large number of false-positive change calls. The categories termed ‘marginal decrease’ (MD) and ‘mar-ginal increase’ (MI) by MAS5.0 constituted only a small fraction (ca. 1%) of all targets (Table 4).
Figure 3. Pair-wise correlation of signals. Scatter plot of signal in-tensities on the AG versus the ATH1 array for one representative biological sample.
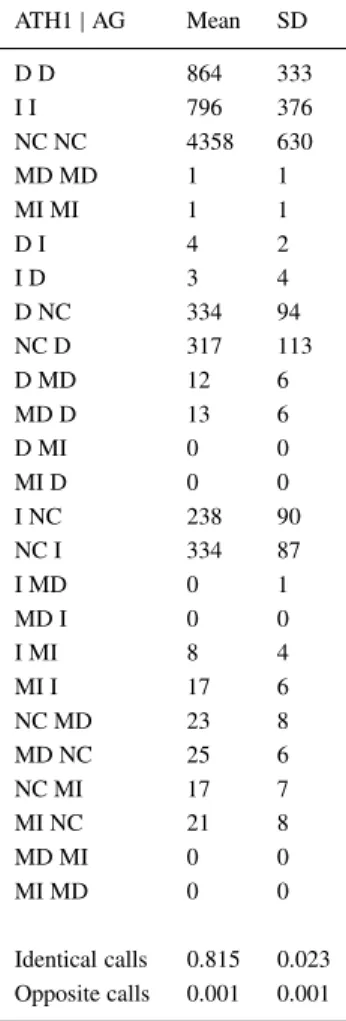
Table 4. Similarity of difference calls. ATH1| AG Mean SD D D 864 333 I I 796 376 NC NC 4358 630 MD MD 1 1 MI MI 1 1 D I 4 2 I D 3 4 D NC 334 94 NC D 317 113 D MD 12 6 MD D 13 6 D MI 0 0 MI D 0 0 I NC 238 90 NC I 334 87 I MD 0 1 MD I 0 0 I MI 8 4 MI I 17 6 NC MD 23 8 MD NC 25 6 NC MI 17 7 MI NC 21 8 MD MI 0 0 MI MD 0 0 Identical calls 0.815 0.023 Opposite calls 0.001 0.001
Conservation of signal intensities and signal log ratios across all probe sets
Next, we asked how well signal values for the same target correlate between both array types. Because the absolute value of the signal is highly dependent on the specific hybridization properties of the probes in the probe sets, one cannot a priori directly compare sig-nals for probe sets directed against different targets. Figure 3 shows an example of the signals obtained after hybridizing the same RNA onto both types of arrays. The plot indeed shows a strong correlation between the signals obtained on both arrays. The av-erage Pearson correlation coefficient for all 21 pairs of hybridizations was 0.81±0.01. The average Spearman correlation coefficient, which is based on ranks and hence more robust, was slightly larger (0.84±0.01).
Because these correlation coefficients were high, we analysed how well the absolute signal intensities were conserved. For a more robust result, we used ranks of the signal values and included only targets that were called present in both groups of arrays at least once. Figure 4A shows a plot of the difference of the signal ranks on both arrays, which were averaged for the 21 pair-wise hybridizations, versus the median rank on the ATH1 arrays. Obviously, the distribution of data points is not uniform and indicates consider-able differences in performance of specific probe sets. In addition to probe set properties, two major effects control the distribution of data points in Figure 4A. First, because most signals have medium intensities and only few signals are very weak or very strong (data not shown), a similar change in signal intensity can alter the rank much more effectively in the medium intensity range than near the low or high end. Con-sequently, rank differences are smaller at the extremes in Figure 4A. Second, the accumulation of points at the left demonstrates that weak signals are less reliable than stronger ones. Half of the targets had rank dif-ferences of less than 506. For these targets, the ranks varied less than 7%. To detect targets that showed particularly large variation, we constructed confidence intervals based on the interquartile range for windows of 400 targets along the median rank axis. Table S1 in the online supplemental material lists the 142 target genes and the corresponding probe set identifiers that are located outside of the confidence interval. The per-formance of the probe sets for these targets changed strongly between the two array types and absolute sig-nals obtained for these should be treated with care. More important than the conservation of signal values is the conservation of signal log ratios. For more robust results, we again used ranks instead of the original values and selected only targets that were called both present, and either increased or decreased in the two sets of arrays at least once (Figure 4B). The results revealed that the SLRs are very well conserved for targets with strong alterations, but much less well cor-related for the large group of genes showing only small changes in expression (see the peak in the middle part of Figure 4B). After construction of the confidence interval, 136 targets with exceptionally low conserva-tion of the signal log ratios were identified (Table S2, online supplemental material). Of these genes, 8 were also characterised by very strong variation of ranked signal values as identified above. A total of 270 probe sets are therefore identified as potentially suspect. Dif-ferences of ranked SLR values were smallest for about
Figure 4. Conservation of signals and SLRs across all targets common to both arrays. Signal values (A) and SLR (B) were replaced by their ranks. Targets were selected that were called present at least once on each array type (A and B) and called increased or decreased at least once on each array type (B). The differences of the ranks on the AG and ATH1 arrays were averaged for the 21 pairs of arrays and plotted for the selected targets versus the ranked median signal on the ATH1 array. Median and IQR were determined with a sliding window (size= 401 targets). Outliers were identified based on the constructed curve (median+3× IQR), which was smoothed using a running mean (window size= 101).
1000 targets with the highest and 1000 targets with the lowest median SLR. This selection covers targets with an absolute median SLR of at least 0.6.
Correlation of signal intensities across all arrays The ultimate question of interest to most researchers is the extent to which gene expression patterns detected using the AG and ATH1 arrays agree. To address this
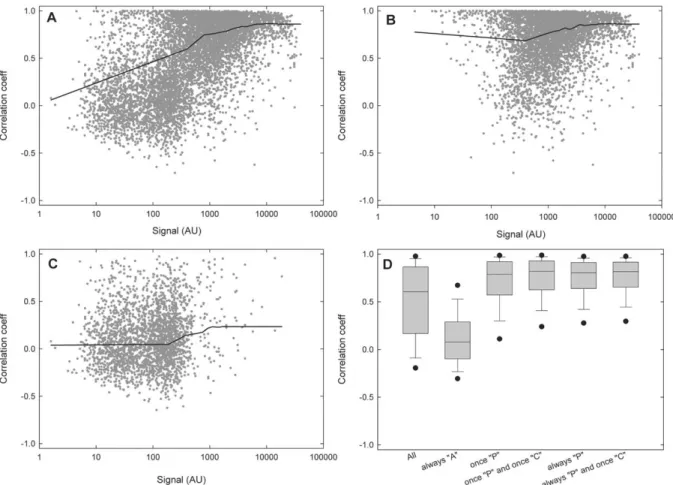
question we calculated the correlation coefficients of the two gene expression profiles across all 21 samples for each gene. Correlation coefficients between –0.7 and +1.0 were obtained, and were plotted versus the median expression level of the corresponding gene on the AG array (Figure 5A). A running median smoother demonstrates the strong dependency of the correlation on signal intensity and that the correlation is generally
Figure 5. Correlation across multiple arrays. Pearson correlation coefficients between gene expression vectors obtained with the two arrays were determined for all common targets (A), targets present at least once (B) and targets always absent (C). Lines represent running medians (sampling proportion= 0.1). (D), box plots of the correlation coefficients after applying various selection criteria.
much higher for more strongly expressed genes. Next, we plotted the distribution of correlation coefficients separately for the group of targets called ‘present’ (P) at least once (Figure 5B), and for the targets that were always called ‘absent’ (A) (Figure 5C). The meas-ured signals and the median correlation coefficients are much smaller for the absent than for the present genes. Surprisingly, however, there is no strong de-pendency of the correlation on signal intensities within the two groups. Therefore, the positive slope of the smoothed curve in Figure 5A results mainly from mixing two populations of data points. Genes called present at least once have a median correlation of 0.7, independent of their signal intensity. In contrast, genes always called absent have a correlation close to 0 even when they are associated with relatively high signal values. This finding emphasizes the advantage of us-ing present calls provided by MAS5.0 over simple thresholds based on signal intensity. Figure 5D
con-tains a box plot showing the distribution of correlation coefficients for various target subsets. These results re-veal that additional filters (e.g. at least one change call different to NC or present calls always P) add little im-provement to the median correlation. Plots similar to Figure 5A–C again provided no indication of depend-encies of correlation coefficients on signal intensities (data not shown).
Taken together, transcriptional profiling results correlated very well between both array types for genes called P at least once. The use of the Spearman rather than the Pearson correlation coefficient had only a very weak influence on the results (data not shown). Finally, Table S3 in the online supplemental mater-ial summarises the results for all selected probe sets common to the AG and the ATH1 microarrays.
Conclusions
Our systematic comparison of results obtained with two different Affymetrix Arabidopsis GeneChips, namely the 8k AG and the 22k ATH1 arrays, revealed a general high degree of reproducibility of transcrip-tome data. Although the selection of probe sets differs strongly between both arrays and the new GeneChip contains only 11 and not 16 probe pairs for most targets, experimental results are very similar. Nonethe-less, the differences between the array types observed in our study are considerably larger than the variance within array types reported previously for biological replicates (e.g. Müssig et al., 2002; Piper et al., 2002; Köhler et al., 2003). Moreover, these observations demonstrate the advantage of using calls and signal log ratios provided by the statistical algorithms of MAS5.0 over relying solely on signal values when filtering for relevant changes in RNA profiling exper-iments. The results suggest that analysis should be focused only on genes called P by MAS5.0 regardless of their actual signal intensities. A further, although smaller improvement of data quality, can be achieved by only including genes called decreased or increased by MAS5.0. Targets producing a median SLR of at least 0.6 (i.e. fold change of 1.5) gave results with the best correlation between array types. Therefore, the commonly used filter of a minimal fold change of 2.0 (SLR = 1.0) is more conservative and can be expected to yield reproducible results. We further suggest that about 2.5% of probe sets may give unre-liable results and identified 270 of these genes. Future studies should also aim to systematically compare Af-fymetrix GeneChips with spotted cDNA microarrays, which are used in many laboratories as a powerful alternative to the Affymetrix products (Schenk et al., 2000; Ma et al., 2001; Schaffer et al., 2001; Wang et al., 2002), and with massively parallel signature sequencing (MPSS; Menges et al., in preparation).
Acknowledgements
We thank Philip Zimmermann for helpful comments on the manuscript. This work was supported by BBSRC grant 8/C15792 to J.A.H.M., and funding from the ETH to W.G. L.H. was supported by the Deutsche Forschungsgemeinschaft (DFG). The au-thors also thank the Functional Genomics Center Zürich for technical and financial support.
References
Brazma, A., Hingamp, P., Quackenbush, J., Sherlock, G., Spellman, P., Stoeckert, C., Aach, J., Ansorge, W., Ball, C.A., Caus-ton, H.C., Gaasterland, T., Glenisson, P., Holstege, F.C., Kim, I.F., Markowitz, V., Matese, J.C., Parkinson, H., Robinson, A., Sarkans, U., Schulze-Kremer, S., Stewart, J., Taylor, R., Vilo, J. and Vingron, M. 2001. Minimum information about a microar-ray experiment (MIAME)-toward standards for microarmicroar-ray data. Nature Genet. 29: 365–371.
Brenner, S., Johnson, M., Bridgham, J., Golda, G., Lloyd, D.H., Johnson, D., Luo, S., McCurdy, S., Foy, M., Ewan, M., Roth, R., George, D., Eletr, S., Albrecht, G., Vermaas, E., Williams, S.R., Moon, K., Burcham, T., Pallas, M., DuBridge, R.B., Kirchner, J., Fearon, K., Mao, J. and Corcoran, K. 2000. Gene expression analysis by massively parallel signature sequencing (MPSS) on microbead arrays. Nature Biotechnol. 18: 630–634.
Breyne, P. and Zabeau, M. 2001. Genome-wide expression analysis of plant cell cycle modulated genes. Curr. Opin. Plant Biol. 4: 136–142.
Che, P., Gingerich, D.J., Lall, S. and Howell, S.H. 2002. Global and hormone-induced gene expression changes during shoot development in Arabidopsis. Plant Cell 14: 2771–2785. Goda, H., Shimada, Y., Asami, T., Fujioka, S. and Yoshida, S.
2002. Microarray analysis of brassinosteroid-regulated genes in Arabidopsis. Plant Physiol. 130: 1319–1334.
Harmer, S.L., Hogenesch, J.B., Straume, M., Chang, H.S., Han, B., Zhu, T., Wang, X., Kreps, J.A. and Kay, S.A. 2000. Orchestrated transcription of key pathways in Arabidopsis by the circadian clock. Science 290: 2110–2113.
Holloway, A.J., van Laar, R.K., Tothill, R.W. and Bowtell, D.D. 2002. Options available –from start to finish – for obtaining data from DNA microarrays II. Nature Genet. 32 (Suppl.): 481–489. Honys, D. and Twell, D. 2003. Comparative analysis of the
Ara-bidopsis pollen transcriptome. Plant Physiol. 132: 640–652. Ihaka, R. and Gentleman, R. 1996. R: a language for data analysis
and graphics. J. Comp. Graph. Stat. 5: 299–314.
Köhler, C., Hennig, L., Spillane, C., Pien, S., Gruissem, W. and Grossniklaus, U. 2003. The Polycomb-group protein MEDEA regulates seed development by controlling expression of the MADS-box gene PHERES1. Genes Dev. 17: 1540–1553. Kreps, J.A., Wu, Y., Chang, H.S., Zhu, T., Wang, X. and Harper,
J.F. 2002. Transcriptome changes for Arabidopsis in response to salt, osmotic, and cold stress. Plant Physiol. 130: 2129–2141. Laule, O., Fürholz, A., Chang, H.S., Zhu, T., Wang, X., Heifetz,
P.B., Gruissem, W. and Lange, M. 2003. Crosstalk between cytosolic and plastidial pathways of isoprenoid biosynthesis in Arabidopsis thaliana. Proc. Natl. Acad. Sci. USA 100: 6866– 6871.
Liang, P. and Pardee, A.B. 1992. Differential display of eukaryotic messenger RNA by means of the polymerase chain reaction. Science 257: 967–971.
Lipshutz, R.J., Fodor, S.P., Gingeras, T.R. and Lockhart, D.J. 1999. High density synthetic oligonucleotide arrays. Nature Genet. 21: 20–24.
Liu, W.M., Mei, R., Di, X., Ryder, T.B., Hubbell, E., Dee, S., Web-ster, T.A., Harrington, C.A., Ho, M.H., Baid, J. and Smeekens, S.P. 2002. Analysis of high density expression microarrays with signed-rank call algorithms. Bioinformatics 18: 1593–1599. Lockhart, D.J., Dong, H., Byrne, M.C., Follettie, M.T., Gallo, M.V.,
Chee, M.S., Mittmann, M., Wang, C., Kobayashi, M., Horton, H. and Brown, E.L. 1996. Expression monitoring by hybridization to high-density oligonucleotide arrays. Nature Biotechnol. 14: 1675–1680.
Ma, L., Li, J., Qu, L., Hager, J., Chen, Z., Zhao, H. and Deng, X.W. 2001. Light control of Arabidopsis development entails coordin-ated regulation of genome expression and cellular pathways. Plant Cell 13: 2589–2607.
Menges, M. and Murray, J.A.H. 2002. Synchronous Arabidopsis suspension cultures for analysis of cell-cycle gene activity. Plant J. 30: 203–212.
Menges, M., Hennig, L., Gruissem, W. and Murray, J.A.H. 2002. Cell cycle-regulated gene expression in Arabidopsis. J. Biol. Chem. 277: 41987–42002.
Menges, M., Hennig, L., Gruissem, W. and Murray, J.A.H. 2003. Genome-wide gene expression in an Arabidopsis cell suspen-sion.. Plant Mol. Biol., in press.
Piper, M.D., Daran-Lapujade, P., Bro, C., Regenberg, B., Knud-sen, S., NielKnud-sen, J. and Pronk, J.T. 2002. Reproducibility of oligonucleotide microarray transcriptome analyses. An interlab-oratory comparison using chemostat cultures of Saccharomyces cerevisiae. J. Biol. Chem. 277: 37001–37008.
Puthoff, D.P., Nettleton, D., Rodermel, S.R. and Baum, T.J. 2003. Arabidopsis gene expression changes during cyst nematode para-sitism revealed by statistical analyses of microarray expression profiles. Plant J. 33: 911–921.
Rashotte, A.M., Carson, S.D., To, J.P. and Kieber, J.J. 2003. Expres-sion profiling of cytokinin action in Arabidopsis. Plant Physiol. 132: 1998–2011.
Riou-Khamlichi, C., Menges, M., Healy, J.M. and Murray, J.A.H. 2000. Sugar control of the plant cell cycle: differential regulation of Arabidopsis D-type cyclin gene expression. Mol. Cell Biol. 20: 4513–4521.
Schaffer, R., Landgraf, J., Accerbi, M., Simon, V., Larson, M. and
Wisman, E. 2001. Microarray analysis of diurnal and circadian-regulated genes in Arabidopsis. Plant Cell 13: 113–123. Schena, M., Shalon, D., Davis, R.W. and Brown, P.O. 1995.
Quantitative monitoring of gene expression patterns with a com-plementary DNA microarray. Science 270: 467–470.
Schenk, P.M., Kazan, K., Wilson, I., Anderson, J.P., Richmond, T., Somerville, S.C. and Manners, J.M. 2000. Coordinated plant de-fense responses in arabidopsis revealed by microarray analysis. Proc. Natl. Acad. Sci. USA 97: 11655–11660.
Southern, E.M., Maskos, U. and Elder, J.K. 1992. Analyzing and comparing nucleic acid sequences by hybridization to ar-rays of oligonucleotides: evaluation using experimental models. Genomics 13: 1008–1017.
Tao, Y., Xie, Z., Chen, W., Glazebrook, J., Chang, H.S., Han, B., Zhu, T., Zou, G. and Katagiri, F. 2003. Quantitative nature of Arabidopsis responses during compatible and incompatible inter-actions with the bacterial pathogen Pseudomonas syringae. Plant Cell 15: 317–330.
Tepperman, J.M., Zhu, T., Chang, H.S., Wang, X. and Quail, P.H. 2001. Multiple transcription-factor genes are early targets of phytochrome A signaling. Proc. Natl. Acad. Sci. USA 98: 9437–9442.
Velculescu, V.E., Zhang, L., Vogelstein, B. and Kinzler, K.W. 1995. Serial analysis of gene expression. Science 270: 484–487. Verwoerd, T.C., Dekker, B.M. and Hoekema, A. 1989. A
small-scale procedure for the rapid isolation of plant RNAs. Nucl. Acids Res. 17: 2362.
Wodicka, L., Dong, H., Mittmann, M., Ho, M.H. and Lockhart, D.J. 1997. Genome-wide expression monitoring in Saccharomyces cerevisiae. Nature Biotechnol. 15: 1359–1367.