CALTECH/MIT
VOTING TECHNOLOGY PROJECT
A multi-disciplinary, collaborative project ofthe California Institute of Technology – Pasadena, California 91125 and
the Massachusetts Institute of Technology – Cambridge, Massachusetts 02139
ACCESS VERSUS INTEGRITY IN VOTER IDENTIFICATION
REQUIREMENTS
STEPHEN ANSOLABEHERE MIT
Key words: voter identification, HAVA, voter identification requirements, voter turnout
VTP WORKING PAPER #58
Access versus Integrity in Voter Identification Requirements1 Stephen Ansolabehere
Elting R. Morison Professor Department of Political Science MIT
February 2007
The Help America Vote Act hit a nearly fatal snag during the final stages of
congressional negotiations over the bill in 2002. The problem? Voter identification requirements. Many conservatives in Congress insisted on the inclusion of a
requirement that voters show photo identification, and many liberals, especially the Congressional Black Caucus, saw this as a deal killer. Ultimately, the two sides reached a compromise that applied the rule to first time voters, but the battlelines over this
question were drawn and they remain in place today.
Both sides of this debate express, at least rhetorically, the same objective: protect the value of the vote. For those on the left, protection of voting rights involves expansion of access to the polls and opening up the vote counting process. “Count all the votes” became the mantra of the election controversies in Florida in 2000 and Ohio in 2004.2 Excluding qualified voters from the polls or not counting ballots through failures in administrative procedures or machines, of course, eliminates those votes from the count, and dilutes the value of others who voted for the same candidates or party. Polemical writings frequently allege that problems with electoral machinery are the modern day equivalent of the Jim Crow laws.3
A second form of vote dilution comes from ballots cast unlawfully, especially by people who are not qualified to vote, such as aliens or people at the wrong polling place or, in some states, felons. Illegal votes dilute the value of qualified votes just as surely as failings of machines and errors in registration lists do. Many states go well beyond the rules in HAVA and require that voters show identification at the polls.
Voter identification rules can cut both ways. Identification seems a reasonable
requirement for ensuring that only those who are qualified are allowed to vote and that people do not vote in the wrong place, and thus in the wrong elections. Poll workers can check identification to validate both that the individual is properly registered to vote and
1 Paper presented at the New York University Law School’s Election Law Symposium for the Annual
Survey of American Law.
2 Of course, that is exactly what the Democrats did with overseas military ballots in Florida in 2000 even
though many of those ballots were cast late, not signed, or not dated, and they were sufficient to decide the election outcome. See Gary King’s analyses of these ballots.
3 Most of the rhetoric on the left is driven by the exaggerated claims of writers unhappy with the election
results, rather than the election process. The Election Assistance Commission’s Voter Fraud and Voter Intimidation provides a good survey:
that he or she is in the correct polling place. If questions arise, the person can be allowed to vote a provisional ballot.
Identification and other polling place administration practices, however, also have an unfortunate history. Challenges to voters’ qualifications and improper disqualifications of legal voters have long been used as political tools. The problems arise when the local polling place operators have too much discretion in determining voters’ qualifications. In the mid 19th Century, British political parties used challenges to voter registration lists
to disqualify wholesale hundreds of presumably legal voters. The challenges on Election Day could not be resolved until it was too late. Parliament had to limit the use of
disqualifications in response.4 Such practices were widespread in American elections as well. World War II veterans, upon returning to the United States, found themselves purged from registration rolls and systematically excluded from the electoral process. In some instances, veterans’ protests to gain back their voting rights led to riots.5
Discriminatory election administration practices gained infamy in the American South. Blacks were denied access to registration through limited election office hours, literacy tests, and excessive identification requirements.6 On election day, poll workers
selectively applied poll taxes, literacy tests, and other instruments to exclude Blacks and many poor whites.7 Only 25 percent of the Southern Black population was registered to vote in 1960; fewer still were allowed to vote.
It is through the lens of this unfortunate history that voter identification requirements are viewed. These new rules may amount to a test, applied capriciously and discriminatorily at polling places, as were literacy tests and other standards. In addition, identification requirements create a new “qualification” that seems irrelevant to the electoral process – the possession of a photo id. The Report of the National Commission on Federal Election Reform concluded that identification requirements might have disproportionate effects on poorer people and inner city residents because many of them do not have the most commonly used forms of identification, such as drivers’ licenses and state-issued identification cards.8
These two views – on the left and the right – paint two quite different pictures of the use of voter identification on election day. According to those on the left, voter fraud is rare, but identification requirements are used to exclude voters differentially across racial and class lines. According to those on the right, voter fraud is common, and voter identification requirements are applied equitably to prevent illegal voters from participating. By both accounts a noticeable number of voters are excluded through identification requirements; these two stories differ in terms of who is excluded. A rate
4 Seymour, Electoral Reform in England, Scotland, and Wales.
5 Veterans’ riots in Memphis ultimately led to the downfall of the Crump political machine. See the
Tennessee Bluebook for a discussion of these riots.
6 See Bernard Taper, Gomillion v. Lightfoot. 7 See V. O. Key Southern Politics.
8 National Commission on Federal Election Reform, To Assure Pride and Confidence in the Electoral
of exclusion (either justified because of fraud or unjustified because of intimidation) of even one or two percent could affect elections noticeably.
Relatively little is known about the application of voter identification requirements in the United States. A handful of surveys have found support for the use of voter
identification, but nothing is known about the incidence of use or who is excluded through this mechanism. The reason is cost. A very large scale survey is required to measure factors that affect a small percent of the population. The natural survey to ask about identification would be the Current Population Survey’s voter supplement, as that survey covers approximately 75,000 people. Alas, they have not asked about these new rules.
This paper presents the findings of a new survey designed to achieve a sufficient scale so as to gauge this and other electoral phenomena. In 2006, a collaborative survey project among 37 universities conduced a 36,500 person national sample survey, the Cooperative Congressional Election Survey. That survey included a battery of questions to gauge election day practices; a handful of questions probed the use of voter identifications. In addition a smaller subset of the larger project asked whether respondents approved of laws requiring voter identification.
I proceed as a naïve empiricist. The stark arguments of the advocates and critics of voter identification requirements motivate this research, but I have no particular stake in these claims.
Description of Survey
The Cooperative Congressional Election Survey was conducted over the Internet by Polimetrix. Polimetrix uses a matched random sample to construct a national random sample of adults. That is, they randomly sample people from the National Consumer File, which includes approximately 95 percent of the American adult population. They then match the demographic profiles of those people to individuals who have agreed to participate in Internet surveys, and they conduct the survey of those matched cases. To compensate for low Internet participation among poor and minority communities, Polimetrix more actively recruits respondents with these characteristics.9
The survey was fielded in three waves, August-September 2006, October 2006, and November 2006. The first wave profiled the participants, emphasizing demographics. The second wave tapped opinions, attitudes, and beliefs that would shape the vote. The third wave emphasized voting behavior.
The survey consisted of 35 separate team surveys of approximately 1,000 persons each. Every university-based team purchased a survey and controlled approximately half of the questions asked of their individual team sample, called Team Content. Approximately half of each team’s questions were pooled into Common Content. Every Team Survey was a national random matched sample, so the Common Survey was as well.
9 For details see the CCES website.
Common Content consists of a set of approximately 60 questions asked on every survey. Common Content was designed by a committee consisting of Stephen Ansolabehere, Robert Erikson, Donald Kinder, Jeremy Pope, Wendy Rahn, John Sides, and Lynn Vavrek, with input from all of the participating groups. On this common battery, we included questions that all teams would want to use, such as vote preferences, party identification, and demographics.
The Common Content included a battery of questions concerning the voting experience. In this paper, I will focus on a handful of items. First, how did the person vote – at the polls on election day, early at an office or kiosk, by mail or absentee, or not at all? Second, when the person voted, was he or she asked to show voter identification? Third, of those asked to show identification, were they allowed to vote or not? Other questions asked about registration problems and lines at the polls.
The MIT Team Content also included a set of questions designed to gauge opinion about various election administration practices and reforms. In this paper we focus on one such question, whether the person supported or opposed requiring voters to show picture identification at the polls. Other questions in this battery concerned districting practices. Support for Voter Identification Requirements
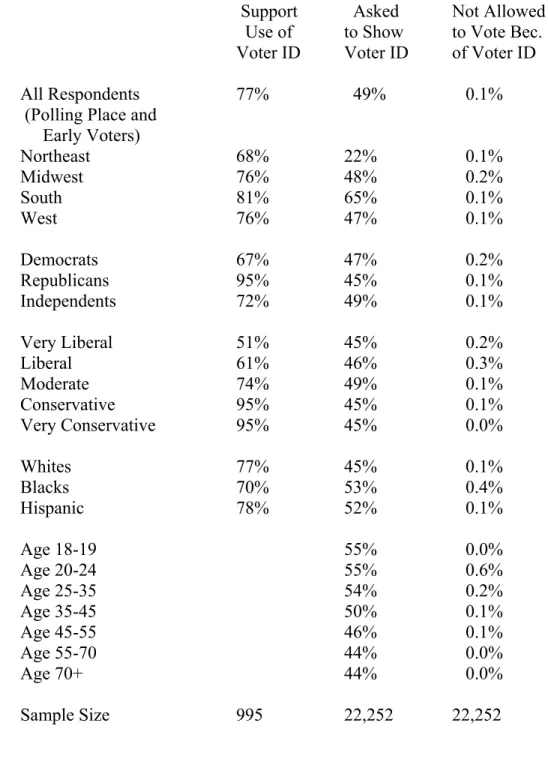
A large majority of the sample in the MIT survey expressed support for voter
identification requirements. Over 75 percent of the respondents expressed their support for the idea; 17 percent were opposed, and 8 percent were unsure.
Table 1 presents the support for voter identification across various electoral groups. Region, party and ideology, and race show the most interesting splits across electoral groups. Support differs noticeably across groups; however, a majority of every group in the sample supports voter identification requirements. A plausible explanation is that the large number of voters are not affected adversely by this rule, and it provides some protection of the dilution of their votes from illegally cast ballots.
Support varied across regions in ways that state laws reflect. Respondents from Southern states expressed the highest support for voter identification requirements, with fully 81 percent in favor. In the South, every state provides for some form of identification
requirement. Those in the Midwest and West expressed the next highest levels of support for voter identification, with support from fully three-fourths of the respondents in both of these regions. Those in the Northeast supported voter identification requirements the least, although two in three agreed with the idea.
Support for this idea divided unexpectedly along ideological and partisan lines. Ninety-five percent of people who identify as Conservatives or as Republicans support voter identification requirements. Slightly more than 7 in 10 moderates and Independents supported the voter identification rule. Two-thirds of Democrats supported the idea, as did 60 percent of people who identify as Liberal and 50 percent of those who identify as
very liberal. The very high support among Democratic voters comes as something of a surprise considering the very strong opposition to the voter identification proposal from Democratic congressional leaders and members.
Perhaps the most surprising demographic or political comparison arose with race. And the surprise was the lack of division. Over 70 percent of Whites, Hispanics, and Blacks support the requirement. Black and Hispanic voters did not express measurably less support for voter identification requirements than whites. The Congressional Black Caucus and the Democratic party leadership were wholly out of step with the analogous segments of the electorate on this issue. The lowest levels of support (and again it’s a majority) came from White Democrats and White Liberals.
A multivariate statistical analysis revealed that of all the factors, the most important was ideology. Holding constant region, income, party, and race, ideology has a strong effect on support for voter identification requirements. The difference in support for id requirements between a very liberal and very conservative person, holding other things constant, is approximately 55 percentage points. Region proved marginally significant, with Northeasterners expressing support for id requirements about 10 percent more often than Southerners. No other factors proved statistically significant.
Incidence of Voter Identification
The debate in Congress and among other leaders over voter identification rules revolved not around questions of public support but around questions of the application of the rules in practice. Legal scholars and political scientists have catalogued the identification laws used in the states.10 In practice, poll workers have considerable discretion in the
application of identification rules: they may ignore the rule altogether, or they may ask for identification even when the law does not require it or when they are forbidden from doing so.
The Common Content of the CCES survey gauges the frequency with which voters are asked to show identification when they voted. We restrict attention to those who report that they voted on election day or early, and exclude from the analysis those who say that they voted absentee, did not vote, or were not sure. Early voting is most common in the South, where roughly a third of ballots are cast at election offices before election day. Absentee voting is most common in the West, where half of all ballots were cast absentee or by mail. Better than 85 percent of ballots cast in the Northeast and Midwest are at polling places on Election Day. We use the same vote questions as the Current Population Survey. The CCES data show that voter identification is widely used. Half of those who reported that they went to the polls or voted early said that they were asked to show identification. That differed according to how people voted. Sixty percent of those who voted early reported that they were asked to show identification, compared with forty-six percent of those who on election day. That difference appears consistent
across regions, except in the South, where election day and early voters are asked to show identification at similar rates.
The variation in the use of identification across regions is tremendous. Only one in four Northeasterners are asked to show id, compared with half of those in the Midwest and West, and two-thirds of those in the South. Interestingly, this ordering reflects the ordering of public preferences. Voters are most commonly asked to show identification in the South, the region in which the largest fraction of the population favors voter identification requirements, and in the region where there is the greatest opposition to voter identification, the Northeast, the rule is applied the least.11
Trivial partisan and ideological differences arose in the application of this rule.
Approximately the same percentages of Democrats and Republicans, and of Liberals and Conservatives, were asked to show identification. Independents were slightly more likely to have to show identification, but the difference between partisans and Independents was small. Voter identification requirements, as they are applied in practice, then have no apparent partisan or ideological effect.
Identification requirements, however, are not applied neutrally. One noticeable
difference runs long age lines. About 55% of those younger than 30 were asked to show id, while only 45% of older age cohorts were asked to present some form of identification when they voted. But a more disquieting discrepancy emerges upon dividing the sample along racial lines.
As feared by civil rights advocates, poll workers apply the regulations differentially along racial lines. Blacks and Hispanics showed their identification 52% of the time during the 2006 election, while whites and other racial groups (i.e., those who identify as Asians, native Americans, and “other” race) showed their id 45% of the time.12 Nationwide, and not controlling for other factors, Blacks and Hispanics are asked to show identification 7 percent more frequently than whites and other racial groups.
Although partly attributable to region and other factors, race appears to be a substantial factor in the administration of voter identification requirements even after taking other factors into account. Controlling for region, age, party, and income, Blacks and Hispanics are asked to show identification 5 percent more often than whites, a statistically
significant difference. The differences appear greatest among low income groups. Sixty-three percent of the lowest income (household income less than $20,000) Blacks were asked to show id, compared with 46 percent of the lowest income whites.
Racial differences in the frequency with which people are asked to show identification echo discriminatory practices common before the passage of the Voting Rights Act.
11 Interestingly, those who were asked to show voter ID were more likely to support its adoption as a
common requirement than were those who had not been asked. This pattern held up controlling for race, region, and income.
12 In these data, 78% of election day and early voters are white, 9% are black, 8% are Hispanic, and 6% are
These differences, however, are small relative to the racial discrimination evident before 1965, and they are much smaller than differences across age groups and regions.
However, given the history of Jim Crow laws, the differential application of id requirements does flag a potential problem with the administration of election laws. Exclusions
The true test of the effects of identification requirements lies in the rate at which such rules exclude or prevent people from voting. Arguments on both the left and the right suggest that identification requirements would affect a noticeable number of potential voters. The push to require identification asserted that fraud was widespread and that these requirements would stop people from voting illegally. Opposition came from those who feared that the provisions would lead to a new round of discrimination at polling places and that simple errors in registration rolls would lead to many accidental exclusions from voting.
To prevent just such wrongful exclusions and correct for errors in the registration rolls, the Help America Vote Act put in place a fail-safe mechanism – provisional ballots. If polling place records do not show the voter on the rolls or if other questions about qualifications arise, then the voter may still cast a paper ballot that is later verified by the local election officials. According to studies commissioned by the Election Assistance Commission, approximately two percent of ballots cast in 2004 were provisional.
Approximately two-thirds of those were valid, and most of those consisted of people who were not in fact registered.13
Were there significant exclusions on top of that? The CCES reveals the extent to which voters made use of provisional ballots or were excluded altogether. One would expect a noticeable rate of exclusions either because of discrimination or fraud.
Simply put, almost no one was excluded from voting. Only 23 people in the entire 36,500 person sample said that they were not allowed to vote because of voter
identification requirements. That figure translates into approximately one-tenth of one percent of voters.
One may attempt to divide the sample further along various social lines, such as race, income, or age. There are, however, so few cases of exclusion that little can be said with any statistical meaning. The rates of exclusion are shown in Table 1. There are some differences some may wish to focus on, but any differences are statistically insignificant. The real lesson from the data is that the total number of people who said they were not allowed to vote because of voter identification requirements is trivially small.
The CCES offers a second perspective on this problem through questions concerning problems with voters’ registration. A separate question in the survey asked people
13 Election Assistance Commission, Final Report of the 2004 Election Day Survey, Washington, DC:
EAC, September 27, 2005. See especially page 12 and Chapter 6.
whether there was a problem with their voter registration, and if so whether the person was allowed to vote. Only about 3 percent of those who cast ballots in precincts or at election offices (early voting) said that there was a problem with their registration. Of these people 86.4 percent were allowed to vote, 12.6 percent cast a provisional ballot, and 1 percent were not allowed to vote. Extrapolating to the entire electorate (not just those who had a problem) reveals that almost 99 percent of those who voted cast a normal ballot, about 1 percent cast a provisional ballot, and an almost immeasurably small number of people who tried to vote were excluded because of identification requirements or questions with their qualifications.
The number of people reporting registration problems in the CCES sample is sufficiently large as to permit some statistical analysis of differential treatment. The number of exclusions because of questions about qualifications were, again, trivially small. Of the entire sample, 744 people said that they encountered a problem with their registration. Of those who reported problems with their registration, 86 percent were allowed to vote, 13 percent were allowed to cast a provisional ballot, and only one-half of one percent were not allowed to vote.
Interestingly, these figures suggest that when questions arise about voters’ registrations poll workers simply allow people to vote. In these instances even provisional ballots are rare, and almost no one in the CCES who said that they voted in precincts on election day or early at an election office reported that they were prevented from voting because of questions regarding their registration and qualifications.
Exclusions because of voter qualification questions showed no racial differences. Of those election day voters whose registration was problematic, 70 percent were white (compared with 78 percent of all in-person voters), 16 percent were black (compared with 10 percent of in-person voters), and 10 percent were Hispanic (compared with 8 percent of in-person voters). Across all racial groups 85 to 86 percent were allowed to cast regular ballots and 13 to 14 percent cast provisional ballots.
Finally, it should be noted that the rate of exclusions seems unrelated to the frequency with which identification is shown. In the Northeast one-tenth of one percent are
excluded because of id requirements, even though only one-in-five are asked to show id. In the Midwest and West, the same incidence of exclusion arises, even though more than twice as many are asked to show id. As for registration problems and provisional voting, their rates appear to be independent of region as well. In each of the four regions of the country, 3 percent of the election day voters reported registration problems, and 80 to 90 percent were allowed to vote regular ballots. Indeed, in the South, where allegations of problems get the most attention, the percent allowed to cast a regular ballot is the highest, and everyone with a registration problem reported that they were allowed to vote.
It is rare in survey data that a true zero arises. The number of people who said they were excluded from the polls as a result of voter identification requirements, however, is approaching that limit. Only 23 people out of 36,500 said that they were excluded from the polls because of voter identification and questions about their qualifications. This
number is so small that we are unable to say much. Indeed, one would need a survey more than 10 times as large as this one to begin to gauge who was excluded and why. It is just that rare of a phenomenon.
Conclusions
Voter identification is the controversy that isn’t. Almost no one is excluded by this requirement, and when problems arise there is now a reasonable fail safe mechanism. It is not surprising, then, that large majorities in the public support the idea.
These findings undercut much of the heated rhetoric that has inflated the debate over voter identification requirements in the United States. It is charged that voter id
requirements are used to discriminate against people, especially racial minorities, and that has a chilling effect. That almost no one is prevented from voting because of voter id requirements casts doubt on arguments from the left that this amounts to a new poll tax or literacy test. It is also hard to imagine how id requirements could have a chilling effect, if they are rarely used to prevent people form voting. The poll tax, literacy test, and other tools of the Jim Crow laws are powerful metaphors derived from a very ugly period in American history. Id requirements in practice bear absolutely no resemblance to such discriminatory practices. This is simply not a case of voter intimidation.
The lack of people prevented from voting by id requirements or questionable registration also should deflate much of the rhetoric on the right about voter fraud. Like random traffic stops and other means of detecting illegal activities, voter identification
requirements were introduced as a device for rooting out crime – people voting in the wrong place or unregistered people voting. But very few people evidently were caught by identification requirements. Almost no one in the survey (less than one tenth of one percent of voter) reported that they could not vote. The EAC’s study of actual
provisional balloting revealed that less than one-third of one percent of all ballots in 2004 were not counted, and most of those were people who thought they were registered but who were not in fact registered.
These facts strongly suggest that there maybe little or no voting right issue involved here, and not fraud issue either. This is hardly the stuff of the civil rights movement, when only 25 percent of Southern Blacks were registered, and fewer still were allowed to vote. Nor does this resemble the bad-old days of urban political machines, when fraudulent voting accounted, according to some studies, for 10 percent of the total vote.14 That being said, there are some tricky issues here. Identification requirements are administered differently across racial groups. Although the almost no one is ever excluded, it is unclear why these differences would arise. Is this evidence of subtle harassment on a small scale or subtle prejudice among election judges? If so, what can be done about it? A more intensive field study that focuses on the race of the poll worker and the voter and measures the incidence of identification would help to address whether this is a real problem and what explains how pollworkers apply the law.
In addition, improper exclusions and cases of fraud, while not systemic problems, surely arise in individual cases. Extrapolating the CCES data up to the population as a whole suggests that thousands of people may have been excluded. Again, I have little
statistical confidence in the exact number, and this would be a small percent of the 60 million or so voters in 2006. However, each of these involves a possible violation of voting rights that ought to be pursued.
Beyond legal questions of possible individual cases, though, there is an important insight about public policy contained in the CCES data. It is commonplace to debate election regulations as a tradeoff between access and integrity. I infer from the lack of a
relationship between the laws and the (non)exclusion of voters that identification rules present little by way of a tradeoff.
The survey and election data show the striking lack of uniformity in election procedures in the United States. In the Northeast very few voters are asked to show identification, while in the South the large majority are. Even without such uniformity there seems to be relatively little variation in the way in which the law is applied or the extent to which the law excludes voters, illegal or qualified. We could relax the rules, as in the Northeast, or tighten them, as in the South. There would be little effect on the ability of those who come to the polls to cast a valid ballot. Even when questions arise, virtually all votes would be cast as regular ballots, rather than provisionally.
The tradeoff between integrity and access, then, offers no insight about whether the United States ought to have a voter identification requirement. The values of access and integrity simply do not seem to have much play in the actual use of id requirements. Other principles and values must operate in deciding what the appropriate law or policy ought to be. There are good arguments for moving to a more relaxed system of voter identification, most importantly protection of civil liberties. There are equally good arguments for creating a uniform national voter identification separate from drivers’ licenses. Most notably, a national voter id would provide a mechanism for constructing a more coherent voter registration system.
Much of the debate over voter identification, however, has not focused on the questions of civil liberties and coherence of the administration of elections. Rather the debate has been cast as a question of access and discrimination versus integrity and fraud. These are lofty and profound concerns for a democracy. In the realm voter identification in the United States, this debate rests more on phantoms of the past, than the realities of the present.
Table 1. Voter Identification: Support For, Application of, and Exclusions By. 2006 CCES Sample.
Support Asked Not Allowed
Use of to Show to Vote Bec.
Voter ID Voter ID of Voter ID
All Respondents 77% 49% 0.1%
(Polling Place and Early Voters) Northeast 68% 22% 0.1% Midwest 76% 48% 0.2% South 81% 65% 0.1% West 76% 47% 0.1% Democrats 67% 47% 0.2% Republicans 95% 45% 0.1% Independents 72% 49% 0.1% Very Liberal 51% 45% 0.2% Liberal 61% 46% 0.3% Moderate 74% 49% 0.1% Conservative 95% 45% 0.1% Very Conservative 95% 45% 0.0% Whites 77% 45% 0.1% Blacks 70% 53% 0.4% Hispanic 78% 52% 0.1% Age 18-19 55% 0.0% Age 20-24 55% 0.6% Age 25-35 54% 0.2% Age 35-45 50% 0.1% Age 45-55 46% 0.1% Age 55-70 44% 0.0% Age 70+ 44% 0.0% Sample Size 995 22,252 22,252