HAL Id: hal-02352993
https://hal.archives-ouvertes.fr/hal-02352993
Submitted on 30 Jun 2020HAL is a multi-disciplinary open access archive for the deposit and dissemination of sci-entific research documents, whether they are pub-lished or not. The documents may come from teaching and research institutions in France or abroad, or from public or private research centers.
L’archive ouverte pluridisciplinaire HAL, est destinée au dépôt et à la diffusion de documents scientifiques de niveau recherche, publiés ou non, émanant des établissements d’enseignement et de recherche français ou étrangers, des laboratoires publics ou privés.
Recent Adaptive Acquisition by African Rainforest
Hunter-Gatherers of the Late Pleistocene Sickle-Cell
Mutation Suggests Past Differences in Malaria Exposure
Guillaume Laval, Stéphane Peyrégne, Nora Zidane, Christine Harmant,
François Renaud, Etienne Patin, Franck Prugnolle, Lluis Quintana-Murci
To cite this version:
Guillaume Laval, Stéphane Peyrégne, Nora Zidane, Christine Harmant, François Renaud, et al.. Re-cent Adaptive Acquisition by African Rainforest Hunter-Gatherers of the Late Pleistocene Sickle-Cell Mutation Suggests Past Differences in Malaria Exposure. American Journal of Human Genetics, Elsevier (Cell Press), 2019, 104 (3), pp.553-561. �10.1016/j.ajhg.2019.02.007�. �hal-02352993�
Manuscript format: Report
Title: Recent Adaptive Acquisition by Rainforest Hunter-Gatherers of the Late Pleistocene
Sickle-Cell Mutation Suggests Past Ecological Differences in Exposure to Malaria in Africa
Authors:
Guillaume Laval1,2,*, Stéphane Peyrégne1,2,3, Nora Zidane1,2, Christine Harmant1,2, François
Renaud4, Etienne Patin1,2, Franck Prugnolle4,5 and Lluis Quintana-Murci1,2,5*
Affiliations:
1Human Evolutionary Genetics Unit, Institut Pasteur, UMR2000 CNRS, Paris 75015, France;
2Center of Bioinformatics, Biostatistics and Integrative Biology, Institut Pasteur, Paris 75015,
France; 3Department of Evolutionary Genetics, Max Planck Institute for Evolutionary
Anthropology, Leipzig 04103, Germany; 4Laboratory MIVEGEC, UMR 5290 CNRS-IRD,
Montpellier 34394, France.
5These authors contributed equally to this work
Abstract
The haemoglobin βS sickle mutation is a textbook case of natural selection maintaining a
deleterious mutation at high frequency in the human population. Homozygous individuals for this mutation develop sickle cell disease, while heterozygotes benefit from higher protection against severe malaria. Because the overdominant βS allele should be purged almost
immediately from the population in the absence of malaria, the study of the evolutionary history of this iconic mutation can provide important information about the history of human exposure to malaria. Here, we sought to increase our understanding of the origins and time depth of the βS mutation in populations with different lifestyles and ecologies, and analyzed
the diversity of the HBB gene in 479 individuals from 13 populations of African farmers and rainforest hunter-gatherers. Using an Approximate Bayesian Computation method, we estimated the age of the βS allele, explicitly accounting for population subdivision, past
demography and balancing selection. Our analyses indicate a single emergence of βS in the
ancestors of present-day agriculturalist populations ~22,000 years ago, when considering the effects of balancing selection. Furthermore, we show that rainforest hunter-gatherers have more recently acquired the βS mutation from the ancestors of agriculturalists, through
adaptive gene flow during the last ~6,000 years. Together, our results provide evidence for a more ancient exposure to malarial pressures among the ancestors of agriculturalists than previously appreciated, and suggest that rainforest hunter-gatherers have been increasingly exposed to malaria during the last millennia.
Main text
The burden imposed by the malaria (MIM:611162) parasite Plasmodium falciparum on children worldwide is paramount, with hundreds of thousands of deaths per year. As a consequence, malaria is probably among the strongest, and the most documented, selective pressure imposed by an infectious agent on the human population. In this context, balancing selection at the -globin gene HBB (MIM:141900), owing to the heterozygote advantage afforded by the βS sickle (MIM: 603903) mutation in malaria-endemic regions (i.e., the
“Haldane malaria hypothesis”),1-3 is the most iconic case of natural selection maintaining a
deleterious mutation at high frequency in humans. While βS/βS homozygotes develop
sickle-cell disease, an often-fatal anemia caused by red-sickle-cell deformities, heterozygotes benefit from higher protection — of about an order of magnitude — against life-threatening forms of malaria.4-6
The evolutionary history of the βS mutation has been the object of intense research over the
last decades; the study of this mutation can provide insight into the observed disparities in malaria susceptibility across populations and, more generally, into the history of human malaria. It has been hypothesized that malaria developed with slash-and-burn agriculture in central Africa, as the current geographic distribution of βS correlates with the dependence of
populations on agriculture.7,8 Two exclusive models have been proposed in this regard; the
multicentric model, which assumes recent, independent mutational events8-13 occurring
concomitantly with the emergence of agriculture ~3,000-5,000 years ago (ya),14 and the
unicentric model, which supports a more ancient, unique origin of the βS allele.15-17
A recent, comprehensive analysis of whole-genome sequence data for 156 βS carriers from
agriculturalist populations of the 1000 Genomes Project, the African Genome Variation Project, and Qatar has supported a unique origin of the βS allele ~7,300 ya in Africa (95%
(without selection) ancestral recombination graphs,19 while βS is known to have evolved
under balancing selection. Indeed, in the absence of any heterozygote advantage, the βS
mutation should be purged almost immediately from the population because of its strong deleterious effect at the homozygous state.18 Furthermore, most studies have focused on the history of βS among agriculturalist populations only. Defining the geographic distribution and
age of the βS mutation in rainforest hunter-gatherers20 may thus provide new insights into the
history and epidemiology of malaria in sub-Saharan Africa.
In the present study, we explored the evolutionary history of βS in populations of
agriculturalists (AGR) and rainforest hunter-gatherers (RHG), by explicitly considering population structure, demography and overdominance in our analyses. We sequenced the
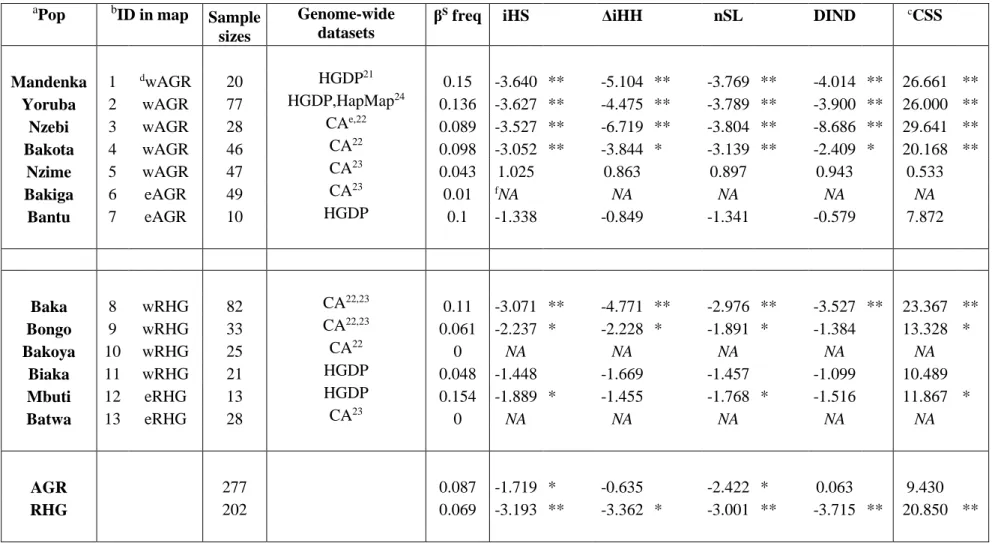
HBB gene (Figure S1A) in 423 individuals from seven AGR and six RHG populations (Table
1). Informed consent was obtained from all participants and the study was approved by the Institut Pasteur (IRB n° 2011-54/IRB/8). To investigate the history of the βS mutation (rs334)
in a genome-wide context, we merged our βS genotypes with 332,550 available SNP
genotypes obtained for 479 individuals, including the 423 sequenced individuals21-23 and 56
unrelated Yoruba from HapMap24 in whom the βS mutation was genotyped (Supplemental
Methods).
The βS mutation was, as expected, widely distributed across sub-Saharan Africans (Table 1
and Figure S1B), at frequencies that ranged from 0% (Batwa RHG and Bakoya RHG) to 15% (Mandenka AGR and Mbuti RHG).18,20 When merging the different subpopulations according
to their lifestyle, to minimize the impact of local drift and low sample sizes, the frequencies of βS were remarkably similar: 9% in AGR and 7% in RHG, with the degree of population
differentiation at rs334 being slightly, although non-significantly, lower than genome-wide expectations (FST 0 vs. 0.016; Figure S2). Although such merged frequency values depend on
exerted selective pressures of comparable intensities in AGR and RHG populations. Under the Haldane hypothesis, similar exposure to malaria results in similar βS equilibrium
frequencies and thus diminished FST (shared overdominance).25,26
To determine the time needed for βS to reach equilibrium frequencies, we simulated the
frequency trajectory of this allele with the forward-in-time simulator SLiM,27 assuming a relative fitness of each genotype 𝑤𝛽𝐴𝛽𝐴 = 1, 𝑤𝛽𝐴𝛽𝑆 = 1 + 𝑠 and 𝑤𝛽𝑆𝛽𝑆 = 1 − 𝑙. Under
overdominance (𝑠 > 0 and 𝑙 > 0), the equilibrium frequency depends only on the ratio ℎ = 𝑠 𝑙⁄ (e.g., 𝑝𝑒𝑞 = 1 − (1 + ℎ) (1 + 2ℎ)⁄ in an infinite size population, leading 𝑝𝑒𝑞 ≅ 𝑠 𝑙⁄
when 𝑝𝑒𝑞 is small). We found that equilibrium frequencies similar to those observed in the
AGR or RHG dataset (~8%) can be indeed achieved in a very short-time period (e.g., < 2,800 years assuming a generation time of 28 years18,28 and depending on the parameter l, Figure
S3). These simulations suggest that, if βS occurred earlier than ~2,800 years, its current
frequency, which has already reached an equilibrium state depending on the 𝑠 𝑙⁄ value, cannot be used to estimate its age. We thus reasoned that the age of βS could be estimated using the
long-range conservation of its associated haplotypes. If βS has recently reached its equilibrium
frequency, one would expect unusually long haplotypes associated with βS, a pattern similar
to that expected after an event of recent positive selection.29 βS haplotypes will then be
shortened by recombination as a function of the equilibrium state duration, which can be very long, e.g., HLA haplotypes have been maintained for millions of years.30
To test this prediction, we simulated the conservation of haplotypes carrying an overdominant mutation that occurred at different time depths, uniformly distributed until 100,000 ya (i.e., Plasmodium falciparum may have existed for 100,000 years in Africa).6 We
assumed a single origin of βS in the AGR or in the RHG lineages (Figure 1A,B), and set ℎ = 0.1, to simulate equilibrium frequencies equal to 𝑝𝑒𝑞 = 0.083 in each (close to the ~8%
reported to range between 50% and 90%,31 we considered high recessive lethality (𝑙 = 0.8 ) as previously assumed.18 We simulated large DNA regions containing βS, using the
pedigree-based recombination rate of 2.710-8 per generation per site observed in the HBB region.32
We also simulated the population structure and specific demographic parameters we recently inferred for these populations,33 numbers of sampled individuals in the last generation in
accordance with population sample sizes, and matched the numbers of simulated SNPs and the allele frequency spectrum to genome-wide observations. The long-range conservation of βS haplotypes was assessed after merging samples according to their AGR and RHG lifestyle
(Figure 1A-B), to avoid unwanted noises due to low sample sizes, and using four haplotype-based statistics — iHS,29 DIND,34 ΔiHH,35 and nSL36 — that were computed using 100kb and
500kb windows around βS (Supplemental Methods).
Our simulations clearly showed that haplotypes containing a βS mutation of recent origin
tend to be more conserved than haplotypes at similar frequencies evolving under neutrality, as attested by the markedly negative values of haplotype-based statistics (Figures 2 and S4). The monotonic relationship between mutation age and haplotype-based statistics indicated that these metrics are informative to estimate the age of an overdominant βS mutation. We then
assessed the long-range conservation of βS haplotypes on our empirical data (Tables 1 and
S1), by first computing the haplotype-based statistics in each population separately. We found genome-wide significant signals of selection in some AGR groups, as previously
shown,24,37,38 but also in several RHG populations (P<0.01, Figure 3, Table 1). Consistent
with our simulations, these results indicate rapid increases in frequency that are not
compatible with neutral expectations. Furthermore, they reveal that recent balancing selection has targeted the βS mutation in both AGR and RHG, highlighting the need to explicitly
To estimate the age of βS, we next computed the haplotype-based statistics by merging
population samples depending on their lifestyle, as we did in our simulations. We found more negative values for RHG than for AGR (Table 1), a difference that could reflect a more recent age of βS in RHG (Figure 2) and/or varying population sub-structure, which may have
differentially affected the AGR and RHG haplotype-based statistics. However, our
simulation-based approach considers population sub-structure, since the model used presented an excellent fit to the genome-wide levels of population differentiation (FST) observed within
and between AGR and RHG lineages.33 Simulated ages ranging from the present to ~15,000
and ~60,000 ya generated haplotype-based statistics that are compatible with those observed in the RHG and AGR data, respectively, thus indicating a more recent βS age in RHG (Figure
2).
Because haplotype-based statistics contain no information on the origin of βS, we used the
sequence-based data of the HBB gene (Table S2) to test whether the βS allele in RHG was a
new, independent mutation or the same than that present in AGR. Using simulations, we found that a single mutational origin of βS, in AGR or in RHG, better fits our data (P<0.011,
Supplemental Methods, Figure S5). We then considered that βS could have occurred in AGR
or in RHG and estimated its age independently in the two groups, using an ABC framework39
and the previous simulations (Figure 2). We used, as ABC summary statistics, the four haplotype-based metrics as well as the current βS frequency and 𝜃𝜋 computed around βS, to build posterior distributions from simulations that well match the observed βS frequency and
associated genetic diversity. Our simulations well reproduced the empirical data both in terms of βS frequencies and haplotype-based statistics (Figures S6 and S7). The estimation accuracy
was found to be higher for young mutations, as expected, and similar for the three ABC methods (Figures S8-10). Because of the very similar posterior distributions obtained across methods (Figure S9), we summarized our results by combining them into a single posterior
distribution (Supplemental Methods) without any loss of accuracy, e.g., the 90% credible intervals (CIs) computed from the combined posteriors contained the true values for ~90% of the simulations, as expected (Figures S8 and S10).
Our mean estimates indicate that the βS mutation occurred very recently in RHG, ~3,800
ya (e.g., 3,200 with 95% CI: [1,500-6,600 ya] using 500kb windows), and ~22,000 ya in AGR (e.g., 23,900 with 95% CI: [10,600-78,700 ya] using 500kb windows; see Figure 4A for all individual estimates, and Figures S11A-C and S12A-C). These estimations further support a single occurrence of βS in the ancestors of agriculturalists, as proposed by the unicentric
model18 and investigated here using our resequencing data (P<0.002, Figure S13). The same
estimates were obtained using western AGR and RHG individuals only, confirming that population subdivision did not alter our results (Figures S11D-E and S12D-E). Our results collectively support a model where the βS mutation appeared only once in the ancestors of
present-day AGR populations and was later introgressed into RHG groups through gene flow. Finally, we sought to re-estimate the age of βS with no prior information on homozygote
lethality and assuming the retained single origin model. We set l uniformly distributed between 𝑙 = 0 (𝑤𝛽𝑆𝛽𝑆 = 1) and 𝑙 = 1 (𝑤𝛽𝑆𝛽𝑆 = 0) and obtained similar, yet more robust,
estimations (Figures 4B and S14-17). The mean estimates confirmed that βS occurred first in
AGR ~24,000 ya (e.g., 23,300 with 95% CI: [13,200-73,500 ya] using 500kb windows) and was later introduced in RHG. The posterior distribution of the age of βS occurring in AGR
given the RHG data (Figures 4B and S16-17), which cannot be formally used to estimate the age of βS in RHG since it systematically overestimates the date of arrival of βS in these
groups, confirms the occurrence of βS in hunter-gatherers in the last ~6,000 years (see above)
due to increased gene flow (migration rate from AGR to RHG increased for two orders of magnitude 10,000 ya).33 Although the accuracy of demographic models inferred from genetic
robust to demography; we found that βS occurred ~9,300 ya in RHG and ~19,000 ya in AGR
when swapping empirical data and simulated demography (i.e., analyzing the RHG data using a “wrong” AGR demographic model and inversely). Our βS estimates in AGR are indeed
older than those recently obtained by Shriner and Rotimi,18 and even older when considering
their recombination rate of 1.510-8 (~37,600 years, see Figure S18). This suggests that the
use of neutral ancestral recombination graphs, known to be sensitive to large inflations of time to the more recent common ancestor due to long-term balancing selection,19 may
underestimate the age of mutations targeted by recent balancing selection. Interestingly, our estimations of lethality of ~0.7 ([95% CI: 0.2-1]), though imprecise, are in good agreement with epidemiological data related to mortality rates among βS/βS homozygotes.
Here, by combining computer simulations and population genetics theory, we have revisited the evolutionary history of the βS mutation in the context of both realistic selective
expectations and populations differing in their lifestyles and ecologies. We considered a parsimonious selection model with similar fitness values across populations, a reasonable assumption given the very similar average βS frequencies observed in AGR and RHG. Our
analyses, which show that the age and recessive lethality of an over-dominant mutation can potentially be estimated from genetic data, open new opportunities to investigate selection parameters that vary according to ecological habitats. For example, central African Bantu-speaking agriculturalists that live nearby the rainforest exhibit a lower βS average frequency
than the western African Mandenka and Yoruba, who live in more open savannah
environments (~7% vs. ~14%, respectively; Table 1). This suggests a reduced heterozygote advantage s of the βS variant among Bantu speakers, with respect to that previously assumed
in non-Bantu-speaking agriculturalists (s ~0.15).10,18 However, given that equilibrium frequencies are driven by ℎ = 𝑠 𝑙⁄ , a diminished equilibrium frequency may also indicate higher recessive lethality l among Bantu speakers. Indeed, the severity of sickle cell disease
depends on several environmental factors (e.g., climate, air quality and infection)41, which can
vary according to the lifestyle of the populations analyzed. Future investigations based on larger amounts of genetic data from populations differing in lifestyles and exposure to environmental cues, together with detailed epidemiological data, should reveal such differential selection by formally estimating h in individual populations.
An important finding of our study is the much deeper age of βS than previously
appreciated. This is in agreement with the emergence of human malaria in sub-Saharan Africa during the late Pleistocene, as suggested by the divergence of Plasmodium falciparum and its closest relative Plasmodium praefalciparum (isolated in western lowland gorillas) 40,000-60,000 ya.42 Furthermore, our age estimates and selection signals support a scenario whereby the βS mutation was introduced from AGR to RHG groups through adaptive gene flow more
recently, in accordance with the increase in migration rates between the two groups during the last 10,000 years.33 The frequency of βS in RHG, and its associated long haplotypes, are
unlikely to result from neutral, recent gene flow from AGR populations (i.e., the last hundreds of years), as RHG groups with the highest βS frequencies, i.e., the Baka and the Mbuti,
present the lowest AGR ancestry proportions due to very recent and limited episodes of admixture.23 Our findings suggest instead an increased βS heterozygote advantage in RHG,
due to an exposure to malaria that has been high enough to prevent the loss of βS and to drive
its frequency close to 8% in the past few thousands of years.
Collectively, our results support previous evidence in favor of an early occurrence of human malaria and substantial selective pressures predating the emergence of agriculture in Africa;18 i.e., the expansion of the highly anthropophilic malaria vector Anopheles gambiae43
and the emergence of Plasmodium falciparum42 during the late Pleistocene. Importantly, our
study extends this knowledge to the view that the ancestors of present-day agriculturalists have been highly exposed to malaria prior to those of rainforest hunter-gatherers, suggesting
different ecological habitats and/or population densities for these groups. Consistently with this model, the genetic diversity of present-day agriculturalists is compatible with population growth 16,000 to 22,000 ya while rainforest hunter-gatherers are known to live as small mobile groups,23,44 and increased population densities favor malaria transmission45. This also
suggests that the ancestors of agriculturalists lived in open areas where malaria is expected to be more prevalent (e.g., rainforest fringe or in savannah, as suggested for the ancestors of Bantu-speaking agriculturalists46) or manipulated their habitat by creating open areas
(archaeological evidence suggest that Homo sapiens manipulated the tropical forest for at least 45,000 years)47. More recently, the mid-Holocene climate changes created encroaching
savannah habitats in the periphery of the rainforest by at least 4,000 ya,46 and/or
agriculture-induced deforestation, known to facilitate malaria transmission,48-50 could have increased
further the exposure of rainforest hunter-gatherers to malaria, as attested by the young age of βS in these populations (the maximum posterior probabilities of the age of βS were found at
3,200 and 4,450 years, Figure 4). In light of this, our results suggest that penetration of Bantu-speaking agriculturalists in the central African rainforest starting 4,000-5,000 ya22,46 was
accompanied by both the increased prevalence of malaria among rainforest hunter-gatherer groups and the adaptive acquisition of the βS malaria-protective mutation by these
Accession Numbers
All newly generated sequences reported in this manuscript are accessible in GenBank: MK475663-MK476504.
Declaration of Interests
The authors declare no competing interests.
Acknowledgments
We thank Paul Verdu, Luis B. Barreiro and George H. Perry for providing western and eastern hunter-gatherer DNA samples. This work was supported by the Institut Pasteur, the
Centre Nationale de la Recherche Scientifique (CNRS), and the Agence Nationale de la
Recherche (ANR) grants: “IEIHSEER “CE14-0008-02, “TBPATHGEN”
ANR-14-CE14-0007-02 and “AGRHUM” ANR-14-CE02-0003-01. The laboratory of LQM has received funding from the French Government’s Investissement d’Avenir program,
Laboratoire d’Excellence “Integrative Biology of Emerging Infectious Diseases” (grant no. ANR-10- LABX-62-IBEID).
Supplemental Data
Supplemental Data include Supplemental Methods, eighteen figures and two tables, and can be found with this article online at http://dx.doi.org/XXX.
References
1. Allison, A.C. (1954). Protection afforded by sickle-cell trait against subtertian malareal infection. Br Med J 1, 290-294.
2. Allison, A.C. (1956). The sickle-cell and haemoglobin C genes in some African populations. Ann Hum Genet 21, 67-89.
3. Haldane, J.B.S. (1949). Disease and Evolution. Ric Sci 19 (Suppl. A), 68-76. 4. Ackerman, H., Usen, S., Jallow, M., Sisay-Joof, F., Pinder, M., and Kwiatkowski,
D.P. (2005). A comparison of case-control and family-based association methods: the example of sickle-cell and malaria. Ann Hum Genet 69, 559-565.
5. Hill, A.V., Allsopp, C.E., Kwiatkowski, D., Anstey, N.M., Twumasi, P., Rowe, P.A., Bennett, S., Brewster, D., McMichael, A.J., and Greenwood, B.M. (1991). Common west African HLA antigens are associated with protection from severe malaria. Nature
352, 595-600.
6. Kwiatkowski, D.P. (2005). How malaria has affected the human genome and what human genetics can teach us about malaria. Am J Hum Genet 77, 171-192.
7. Livingstone, F.B. (1958). Anthropological Implications of Sickle Cell Gene Distribution in West Africa. American Anthropologist 60, 533-562.
8. Wiesenfeld, S.L. (1967). Sickle-cell trait in human biological and cultural evolution. Development of agriculture causing increased malaria is bound to gene-pool changes causing malaria reduction. Science 157, 1134-1140.
9. Chebloune, Y., Pagnier, J., Trabuchet, G., Faure, C., Verdier, G., Labie, D., and Nigon, V. (1988). Structural-Analysis of the 5' Flanking Region of the Beta-Globin Gene in African Sickle-Cell Anemia Patients - Further Evidence for 3 Origins of the Sickle-Cell Mutation in Africa. Proc Natl Acad Sci U S A 85, 4431-4435.
10. Currat, M., Trabuchet, G., Rees, D., Perrin, P., Harding, R.M., Clegg, J.B., Langaney, A., and Excoffier, L. (2002). Molecular analysis of the beta-globin gene cluster in the Niokholo Mandenka population reveals a recent origin of the beta(S) Senegal
mutation. Am J Hum Genet 70, 207-223.
11. Kurnit, D.M. (1979). Evolution of Sickle Variant Gene. Lancet 1, 104-104.
12. Mears, J.G., Lachman, H.M., Cabannes, R., Amegnizin, K.P.E., Labie, D., and Nagel, R.L. (1981). Sickle Gene - Its Origin and Diffusion from West-Africa. J Clin Invest
68, 606-610.
13. Pagnier, J., Mears, J.G., Dunda-Belkhodja, O., Schaefer-Rego, K.E., Beldjord, C., Nagel, R.L., and Labie, D. (1984). Evidence for the multicentric origin of the sickle cell hemoglobin gene in Africa. Proc Natl Acad Sci U S A 81, 1771-1773.
14. Phillipson, D.W. (2005). African Archaeology (Cambridge University Press).
15. Flint, J., Harding, R.M., Clegg, J.B., and Boyce, A.J. (1993). Why Are Some Genetic-Diseases Common - Distinguishing Selection from Other Processes by Molecular Analysis of Globin Gene Variants. Hum Genet 91, 91-117.
16. Solomon, E., and Bodmer, W.F. (1979). Evolution of Sickle Variant Gene. Lancet 1, 923-923.
17. Stine, O.C., Dover, G.J., Zhu, D., and Smith, K.D. (1992). The evolution of two west African populations. J Mol Evol 34, 336-344.
18. Shriner, D., and Rotimi, C.N. (2018). Whole-Genome-Sequence-Based Haplotypes Reveal Single Origin of the Sickle Allele during the Holocene Wet Phase. Am J Hum Genet 102, 547-556.
19. Rasmussen, M.D., Hubisz, M.J., Gronau, I., and Siepel, A. (2014). Genome-wide inference of ancestral recombination graphs. PLoS Genet 10, e1004342.
21. Li, J.Z., Absher, D.M., Tang, H., Southwick, A.M., Casto, A.M., Ramachandran, S., Cann, H.M., Barsh, G.S., Feldman, M., Cavalli-Sforza, L.L., et al. (2008). Worldwide human relationships inferred from genome-wide patterns of variation. Science 319, 1100-1104.
22. Patin, E., Lopez, M., Grollemund, R., Verdu, P., Harmant, C., Quach, H., Laval, G., Perry, G.H., Barreiro, L.B., Froment, A., et al. (2017). Dispersals and genetic
adaptation of Bantu-speaking populations in Africa and North America. Science 356, 543-546.
23. Patin, E., Siddle, K.J., Laval, G., Quach, H., Harmant, C., Becker, N., Froment, A., Regnault, B., Lemee, L., Gravel, S., et al. (2014). The impact of agricultural emergence on the genetic history of African rainforest hunter-gatherers and agriculturalists. Nat Commun 5, 3163.
24. Frazer, K.A., Ballinger, D.G., Cox, D.R., Hinds, D.A., Stuve, L.L., Gibbs, R.A., Belmont, J.W., Boudreau, A., Hardenbol, P., Leal, S.M., et al. (2007). A second generation human haplotype map of over 3.1 million SNPs. Nature 449, 851-861. 25. Brandt, D.Y.C., Cesar, J., Goudet, J., and Meyer, D. (2018). The Effect of Balancing
Selection on Population Differentiation: A Study with HLA Genes. G3 (Bethesda) 8, 2805-2815.
26. Schierup, M.H., Vekemans, X., and Charlesworth, D. (2000). The effect of subdivision on variation at multi-allelic loci under balancing selection. Genetical Research 76, 51-62.
27. Haller, B.C., and Messer, P.W. (2017). SLiM 2: Flexible, Interactive Forward Genetic Simulations. Mol Biol Evol 34, 230-240.
28. Fenner, J.N. (2005). Cross-cultural estimation of the human generation interval for use in genetics-based population divergence studies. Am J Phys Anthropol 128, 415-423.
29. Voight, B.F., Kudaravalli, S., Wen, X., and Pritchard, J.K. (2006). A map of recent positive selection in the human genome. PLoS Biol 4, e72.
30. Leffler, E.M., Gao, Z.Y., Pfeifer, S., Segurel, L., Auton, A., Venn, O., Bowden, R., Bontrop, R., Wall, J.D., Sella, G., et al. (2013). Multiple Instances of Ancient Balancing Selection Shared Between Humans and Chimpanzees. Science 339, 1578-1582.
31. Grosse, S.D., Odame, I., Atrash, H.K., Amendah, D.D., Piel, F.B., and Williams, T.N. (2011). Sickle cell disease in Africa: a neglected cause of early childhood mortality. Am J Prev Med 41, S398-405.
32. Matise, T.C., Chen, F., Chen, W., De La Vega, F.M., Hansen, M., He, C., Hyland, F.C., Kennedy, G.C., Kong, X., Murray, S.S., et al. (2007). A second-generation combined linkage physical map of the human genome. Genome Res 17, 1783-1786. 33. Lopez, M., Kousathanas, A., Quach, H., Harmant, C., Mouguiama-Daouda, P.,
Hombert, J.M., Froment, A., Perry, G.H., Barreiro, L.B., Verdu, P., et al. (2018). The demographic history and mutational load of African hunter-gatherers and farmers. Nat Ecol Evol 2, 721-730.
34. Barreiro, L.B., Ben-Ali, M., Quach, H., Laval, G., Patin, E., Pickrell, J.K., Bouchier, C., Tichit, M., Neyrolles, O., Gicquel, B., et al. (2009). Evolutionary dynamics of human Toll-like receptors and their different contributions to host defense. PLoS Genet 5, e1000562.
35. Grossman, S.R., Shlyakhter, I., Karlsson, E.K., Byrne, E.H., Morales, S., Frieden, G., Hostetter, E., Angelino, E., Garber, M., Zuk, O., et al. (2010). A composite of multiple signals distinguishes causal variants in regions of positive selection. Science 327, 883-886.
36. Ferrer-Admetlla, A., Liang, M., Korneliussen, T., and Nielsen, R. (2014). On
Detecting Incomplete Soft or Hard Selective Sweeps Using Haplotype Structure. Mol Biol Evol 31, 1275-1291.
37. Liu, X., Ong, R.T., Pillai, E.N., Elzein, A.M., Small, K.S., Clark, T.G., Kwiatkowski, D.P., and Teo, Y.Y. (2013). Detecting and characterizing genomic signatures of positive selection in global populations. Am J Hum Genet 92, 866-881.
38. Sabeti, P.C., Schaffner, S.F., Fry, B., Lohmueller, J., Varilly, P., Shamovsky, O., Palma, A., Mikkelsen, T.S., Altshuler, D., and Lander, E.S. (2006). Positive natural selection in the human lineage. Science 312, 1614-1620.
39. Beaumont, M.A., Zhang, W., and Balding, D.J. (2002). Approximate Bayesian computation in population genetics. Genetics 162, 2025-2035.
40. Lapierre, M., Lambert, A., and Achaz, G. (2017). Accuracy of Demographic Inferences from the Site Frequency Spectrum: The Case of the Yoruba Population. Genetics 206, 439-449.
41. Tewari, S., Brousse, V., Piel, F.B., Menzel, S., and Rees, D.C. (2015). Environmental determinants of severity in sickle cell disease. Haematologica 100, 1108-1116.
42. Otto, T.D., Gilabert, A., Crellen, T., Bohme, U., Arnathau, C., Sanders, M., Oyola, S.O., Okouga, A.P., Boundenga, L., Willaume, E., et al. (2018). Genomes of all known members of a Plasmodium subgenus reveal paths to virulent human malaria. Nat Microbiol 3, 687-697.
43. Crawford, J.E., and Lazzaro, B.P. (2010). The Demographic Histories of the M and S Molecular Forms of Anopheles gambiae s.s. Mol Biol Evol 27, 1739-1744.
44. Patin, E., Laval, G., Barreiro, L.B., Salas, A., Semino, O., Santachiara-Benerecetti, S., Kidd, K.K., Kidd, J.R., Van der Veen, L., Hombert, J.M., et al. (2009). Inferring the
demographic history of African farmers and pygmy hunter-gatherers using a multilocus resequencing data set. PLoS Genet 5, e1000448.
45. Kabaria, C.W., Gilbert, M., Noor, A.M., Snow, R.W., and Linard, C. (2017). The impact of urbanization and population density on childhood Plasmodium falciparum parasite prevalence rates in Africa. Malaria J 16, 49.
46. Grollemund, R., Branford, S., Bostoen, K., Meade, A., Venditti, C., and Pagel, M. (2015). Bantu expansion shows that habitat alters the route and pace of human dispersals. Proc Natl Acad Sci U S A 112, 13296-13301.
47. Roberts, P., Hunt, C., Arroyo-Kalin, M., Evans, D., and Boivin, N. (2017). The deep human prehistory of global tropical forests and its relevance for modern conservation. Nat Plants 3, 17093.
48. Afrane, Y.A., Githeko, A.K., and Yan, G. (2012). The ecology of Anopheles
mosquitoes under climate change: case studies from the effects of deforestation in East African highlands. Ann N Y Acad Sci 1249, 204-210.
49. Guerra, C.A., Snow, R.W., and Hay, S.I. (2006). A global assessment of closed forests, deforestation and malaria risk. Ann Trop Med Parasitol 100, 189-204. 50. Walsh, J.F., Molyneux, D.H., and Birley, M.H. (1993). Deforestation - Effects on
Vector-Borne Disease. Parasitology 106, S55-S75.
51. Fagundes, N.J.R., Ray, N., Beaumont, M., Neuenschwander, S., Salzano, F.M., Bonatto, S.L., and Excoffier, L. (2007). Statistical evaluation of alternative models of human evolution. Proc Natl Acad Sci U S A 104, 17614-17619.
Figure legends
Figure 1. Simulated demography in agriculturalist (AGR) and rainforest hunter-gatherer (RHG) populations
(A,B) The long-range conservation of βS haplotypes is assessed in the lineage where the βS
mutation occurred (at frequency 1/2N), i.e., in the corresponding, merged population group. For example, in A, we computed the long-range conservation of βS haplotypes in the merged
group of AGR samples. Time is presented in thousands of years, and effective population sizes in thousands of individuals.
Figure 2. Haplotype long-range conservation provides information to estimate the age of the βS mutation
We used SLiM to simulate DNA regions around βS according to realistic demographic
parameters (Figure 1), recombination rate (2.710-8 per generation per site) and
overdominance parameters (ℎ = 0.1, 𝑝𝑒𝑞 = 0.083 and 𝑙 = 0.8). (A) Simulated long-range conservation of βS haplotypes in the AGR (red) and RHG (blue) lineages, for various bins of
βS age drawn from a uniform distribution ranging from the present to 100,000 ya (bins of
10,000 years each). For each bin, the 99% confidence intervals (red and blue dashed lines) and the average (red and blue curves) of simulated values are indicated. Four haplotype-based statistics are shown, each computed using 500kb windows around the simulated βS mutations.
The haplotype-based statistics at the simulated βS in the AGR and RHG lineages were
obtained by performing 200,000 simulations, assuming that βS occurred by mutation in either
of these lineages. The red and blue horizontal lines represent the empirical average haplotype-based statistics computed similarly at βS using our data. Note that βS haplotypes tend to be
longer than expected under neutrality, as indicated by negative haplotype-based statistics (Supplemental Methods). (B) Distributions of the corresponding haplotype-based statistics
obtained for all simulated ages (<100ky) and for simulated ages younger than 40,000 years (<40ky) and 5,000 years (<5ky) in AGR and RHG, respectively.
Figure 3. βS haplotype-based statistics observed in each population
(A,B) Colored circles and triangles indicate iHS values (Y axis, left side) and the combined selection score (CSS) (Y axis, right side), respectively, computed for the βS mutation (vertical
dashed line), in each population separately. Significantly negative and positive values of iHS and CSS, respectively, indicate that the βS haplotypes are longer than expected under
neutrality. The name of populations in which the signal was found significant, at the genome-wide level, are indicated (*P<0.05 and **P<0.01). Black circles and grey triangles indicate iHS and CSS values, respectively, computed for mutations located in the 500kb flanking regions of HBB, and exhibiting allele frequencies in the same range of variation as observed for βS, i.e., from 0 to 0.15). Values of other haplotype-based statistics for the βS mutation are
reported in Tables 1 and S1.
Figure 4. ABC estimations of the age of the βS mutation
(A,B) ABC posterior distributions of the age of βS obtained by combining three different
ABC methods (Supplemental Methods). Estimations were obtained using haplotype-based statistics computed using 100kb and 500kb windows around βS. The age corresponding to the
maximum posterior probability, the posterior average (in brackets) and the 95% CIs are indicated (95% CIs are also displayed using horizontal colored lines). The estimations obtained using each ABC method are indicated in Figures S11, S12, S16 and S17, and the model used to obtain the estimations is indicated on the right of the corresponding figures. Black dotted lines indicate the uniform prior distributions of age, from the present to 100,000 years back in the past. Note that the estimations obtained using 500kb windows in AGR have
been performed excluding the nSL statistics, to prevent estimations exceeding the prior limits, a known problem in ABC.51 (A) Estimations obtained with simulations performed according to the parameters described in the main text (ℎ = 0.1, 𝑝𝑒𝑞 = 0.083 and 𝑙 = 0.8) and used in Figure 2. The posterior distributions in red and blue were obtained using 200,000 simulations in which βS occurred in the AGR or the RHG lineage, respectively, and the haplotype-based
statistics computed in the corresponding lineage (Figure 1A, B). (B) Estimations obtained using simulations performed according to the parameters described in the main text (ℎ = 0.1, 𝑝𝑒𝑞= 0.083 and l uniformly distributed between 0 and 1). These estimations were performed
using 200,000 simulations in which βS occurred in the AGR lineage and spread by gene flow
to the RHG lineage. The long-range conservation of haplotypes with age simulated for this model can be found in Figures S14 and S15. Posterior distributions in AGR (red) and RHG (blue) were performed using the haplotype-based statistics computed in the AGR and RHG lineages, respectively. In the case of RHG, the age is slightly overestimated with respect to the estimation shown in (A), because in this single origin model, βS has to occur first in AGR
Table 1. Description of population samples, βS frequencies and haplotype-based statistics computed using 500kb windows around βS. aPop bID in map Sample sizes Genome-wide datasets
βS freq iHS ΔiHH nSL DIND cCSS
Mandenka 1 dwAGR 20 HGDP21 0.15 -3.640 ** -5.104 ** -3.769 ** -4.014 ** 26.661 **
Yoruba 2 wAGR 77 HGDP,HapMap24 0.136 -3.627 ** -4.475 ** -3.789 ** -3.900 ** 26.000 **
Nzebi 3 wAGR 28 CAe,22
0.089 -3.527 ** -6.719 ** -3.804 ** -8.686 ** 29.641 ** Bakota 4 wAGR 46 CA22 0.098 -3.052 ** -3.844 * -3.139 ** -2.409 * 20.168 ** Nzime 5 wAGR 47 CA23 0.043 1.025 0.863 0.897 0.943 0.533 Bakiga 6 eAGR 49 CA23 0.01 fNA NA NA NA NA Bantu 7 eAGR 10 HGDP 0.1 -1.338 -0.849 -1.341 -0.579 7.872 Baka 8 wRHG 82 CA22,23 0.11 -3.071 ** -4.771 ** -2.976 ** -3.527 ** 23.367 ** Bongo 9 wRHG 33 CA22,23 0.061 -2.237 * -2.228 * -1.891 * -1.384 13.328 * Bakoya 10 wRHG 25 CA22 0 NA NA NA NA NA Biaka 11 wRHG 21 HGDP 0.048 -1.448 -1.669 -1.457 -1.099 10.489 Mbuti 12 eRHG 13 HGDP 0.154 -1.889 * -1.455 -1.768 * -1.516 11.867 * Batwa 13 eRHG 28 CA23 0 NA NA NA NA NA AGR 277 0.087 -1.719 * -0.635 -2.422 * 0.063 9.430 RHG 202 0.069 -3.193 ** -3.362 * -3.001 ** -3.715 ** 20.850 **
aPopulation names. bIdentifiers used in Figure S1B. cCSS for combined selection score. d“w” and “e” stand for western and eastern, respectively,