HAL Id: hal-03093105
https://hal.archives-ouvertes.fr/hal-03093105
Submitted on 3 Jan 2021HAL is a multi-disciplinary open access
archive for the deposit and dissemination of sci-entific research documents, whether they are pub-lished or not. The documents may come from teaching and research institutions in France or abroad, or from public or private research centers.
L’archive ouverte pluridisciplinaire HAL, est destinée au dépôt et à la diffusion de documents scientifiques de niveau recherche, publiés ou non, émanant des établissements d’enseignement et de recherche français ou étrangers, des laboratoires publics ou privés.
Exceptional but vulnerable microbial diversity in coral
reef animal surface microbiomes
Marlène Chiarello, Jean-Christophe Auguet, Nicholas Graham, Thomas
Claverie, Elliott Sucré, Corinne Bouvier, Fabien Rieuvilleneuve, Claudia
Ximena Restrepo-Ortiz, Yvan Bettarel, Sébastien Villéger, et al.
To cite this version:
Marlène Chiarello, Jean-Christophe Auguet, Nicholas Graham, Thomas Claverie, Elliott Sucré, et al.. Exceptional but vulnerable microbial diversity in coral reef animal surface microbiomes. Proceed-ings of the Royal Society B: Biological Sciences, Royal Society, The, 2020, 287 (1927), pp.20200642. �10.1098/rspb.2020.0642�. �hal-03093105�
1
Please note that this is an author-produced PDF of an article accepted for publication following peer review. The definitive Proceedings of the Royal Society B: Biological Sciences
May 2020, Volume 287 Issue 1927 Pages 20200642 (10p.)
https://doi.org/10.1098/rspb.2020.0642 https://archimer.ifremer.fr/doc/00629/74121/
Archimer
https://archimer.ifremer.frExceptional but vulnerable microbial diversity in coral reef
animal surface microbiomes
Chiarello Marlène 1, * , Auguet Jean-Christophe 1, Graham Nicholas A. J. 2, Claverie Thomas 1, 3,
Sucré Elliott 1, 3, Bouvier Corinne 1, Rieuvilleneuve Fabien 1, Restrepo-Ortiz Claudia Ximena 1,
Bettarel Yvan 1, Villéger Sébastien 1, Bouvier Thierry 1
1 MARBEC, Université de Montpellier, CNRS, Ifremer, IRD, Montpellier, France
2 Lancaster Environment Centre, Lancaster University, Library Avenue, Lancaster LA1 4YQ, UK 3 Département Sciences et Technologie, Centre Universitaire de Formation et de Recherche de
Mayotte, Route nationale 3, BP53, 97660 Dembeni, France
* Corresponding author : Marlène Chiarello, email address : [email protected]
Abstract :
Coral reefs host hundreds of thousands of animal species that are increasingly threatened by anthropogenic disturbances. These animals host microbial communities at their surface, playing crucial roles for their fitness. However, the diversity of such microbiomes is mostly described in a few coral species and still poorly defined in other invertebrates and vertebrates. Given the diversity of animal microbiomes, and the diversity of host species inhabiting coral reefs, the contribution of such microbiomes to the total microbial diversity of coral reefs could be important, yet potentially vulnerable to the loss of animal species. Analysis of the surface microbiome from 74 taxa, including teleost fishes, hard and soft corals, crustaceans, echinoderms, bivalves and sponges, revealed that more than 90% of their prokaryotic phylogenetic richness was specific and not recovered in surrounding plankton. Estimate of the total richness associated with coral reef animal surface microbiomes reached up to 2.5% of current estimates of Earth prokaryotic diversity. Therefore, coral reef animal surfaces should be recognized as a hotspot of marine microbial diversity. Loss of the most vulnerable reef animals expected under present-day scenarios of reef degradation would induce an erosion of 28% of the prokaryotic richness, with unknown consequences on coral reef ecosystem functioning.
Keywords : skin microbiota, phylogenetic diversity, conservation, marine biodiversity, Octocorallia,
BACKGROUND
Coral reefs provide habitats for at least 500,000 multicellular species [1], including more than 6,000 described fish and 1,000 coral species [2,3]. These animals are covered by diverse and abundant microbes (Bacteria, Archaea, viruses and micro-eukaryotes) which all together constitute the surface microbiome [4]. Animal surface microbiomes play crucial roles for their hosts, contributing to host resistance to pathogens and environmental perturbations [5,6], and to assimilation of nutrients [4]. However, animal surface microbiomes have been assessed in less than 50 and 100 coral and fish species, respectively [4,6–10].
Large scale surveys of the marine water column demonstrated the important diversity of planktonic marine microbes [11,12]. However, these planktonic microbes are compositionally distinct from marine animal surface microbiomes, and many animal-associated microbes remain undetected in planktonic microbial communities [8,10,13]. In addition, marine animals have diverse biological traits that provide specific habitats at their surface, which ultimately favours the proliferation of microbial lineages that are different among different species [7]. Surface microbiomes and planktonic microbes form a microbial ‘metacommunity’ [14], where local communities within it (individual animal microbiomes, as well as planktonic communities) are connected by dispersal of microbes through direct contacts and through the water column. Given the distinct composition of animal surface microbiomes between species, and the diversity of animal surfaces inhabiting coral reefs, surface microbiomes may constitute an important part of the coral reef microbial metacommunity. However, the
contribution of animal surface microbiomes to the coral reef microbial diversity is currently unknown.
Coral reefs are facing increasing human pressures (including ocean warming, acidification and overfishing; [15,16]) inducing an increased risk of extinction of a significant proportion of animal diversity (up to 8% and 10% of coral and fish species; [16,17]). The documented erosion of animal biodiversity as well as the decrease of animal abundance may result in the loss of their associated microbial species. However, the effect of such erosion on microbial diversity has to date not been assessed.
In this study, we sampled surface microbiomes of abundant coral reef animals (e.g. fishes, corals, crustaceans, echinoderms, mollusks and sponges) from the same restricted area over a
short period. In so doing we avoided spatial and/or temporal variation of microbial diversity driven by environmental variability. We sampled the surface prokaryotic microbiome of 265 coral reef animals belonging to 74 different taxa, including 32 and 18 genera of teleost fishes and Anthozoa (hard and soft corals, and anemones), respectively, and 12 taxa of crustaceans, echinoderms, mollusks and sponges, from a single coral reef ecosystem (Mayotte lagoon, Indian Ocean). In order to test the hypothesis that surface microbiomes represent a major component of the coral reef microbial metacommunity, we compared the prokaryotic
diversity hosted by animals to that of the surrounding planktonic communities. Ultimately, we compared the amount of microbial diversity to global microbial diversity estimates and
estimated the erosion of microbes due to human-induced animal exinction.
METHODS
Sampling procedure
Sampling was conducted in November 2015 in Mayotte lagoon shallow (depth <10 meters) barrier and fringing coral reefs (Western Indian Ocean, Supplementary Material SM1-1 and 2). We sampled the most abundant taxa from each of the main animal groups (teleost fishes,
Anthozoa, crustaceans, echinoderms, mollusks and sponges) within a radius of 50 m around
each site (SM1-3 and 4). Sampling procedure is provided in SM1-5. Briefly, we sampled skin microbiome by collecting surface mucus or swabbing.
Fishes were identified at species level. Corals were identified at genus level. Classification of other invertebrates was made at species level when possible (for crustaceans, starfish, urchins and anemones), or at higher taxonomic levels for a few clades (one sea cucumber, comatules, hermit crabs, brittle stars and giant clams) (SM1-4). A total of 138 fishes were sampled across two sites, as well as 82 colonies of hard and soft corals, gorgonians and anemones (referred collectively as Anthozoa) belonging to 13 genera of Scleractinia, 3 Octocorallia (soft corals and gorgonians) and one anemone species. We also sampled 43 individuals of crustaceans, echinoderms, mollusks and sponges. For each of 6 days of sampling, water samples were collected and filtrated to collect prokaryotic plankton as explained in SM1-5. Prokaryotic diversity was assessed using high-throughput sequencing of the V4 hypervariable region of the 16S rDNA gene, as detailed in SM1-5.
Sequence processing and phylogenetic analyses
v3.4.3 using script provided in Supplementary Material SM1-6. 7% of the 50,237 constructed ASVs were unclassified at this step. In order to define whether they could potentially
correspond to remaining mitochondrial sequences, we mapped them onto the Genbank database (NCBI) using the BLASTn alignment tool. 7% of them showed more than 97% identity with a mitochondrial sequence and were removed before computing further analyses. Sequence number ranged from 7,074 to 56,927 across samples (SM1-4). 7,000 sequences were randomly sub-sampled within each sample in order to correct the uneven sequencing efficiency among samples using “rrarefy” function from ‘vegan’ R-package version 2.5-5 [18]. To assess the effect of rarefaction on our results, all subsequent analyses were computed on both rarefied and un-rarefied data. Analyses based on rarefied data are included in the main document, while the ones based on un-rarefied data are included in Supplementary Material SM2. These two approaches provided similar results. Zhang-Huang’s coverage estimator [19] was calculated using the ‘entropart’ R-package version 1.6-1 [20], using “coverage” function, and averaged 0.982±0.015 across all samples (0.998±0.001 before rarefaction). A phylogenetic tree was obtained by adding the ASV sequences into the
GreenGenes phylogenetic tree version 13.8 [21] using SEPP insertion tool [22] with default
parameters.
Assessing microbial biodiversity
The average surface microbiome of each fish species, Anthozoa genus, or other invertebrate taxa, was computed as the mean relative abundance of each ASV across individuals from the same taxon (SM1-4). Phylogenetic richness of each community was measured using Faith’s PD [23], using “pd” function from ‘picante’ R-package version 1.8 [24]. Phylogenetic diversity, taking into account the relative abundance of ASVs, was measured using Allen’s index [25] using our own R-function (https://github.com/marlenec/chao, q=1). The evenness of ASVs abundances was measured for each microbial sample using O [26], which is robust against richness variation [27].
Phylogenetic dissimilarities between animal taxa was assessed using the unweigthed and weighted versions of Unifrac index (U- and W-Unifrac), computed using ‘GUniFrac’ R-package version 1.1 [28] and were visualized using Principal Coordinates Analysis (PCoA) computed using ‘ape’ R-package, and boxplots computed using function “boxplot.stats” from
‘grDevices’ R-package using default parameters.
Difference in phylogenetic alpha-diversity between plankton and animal surface microbiomes was tested using Kruskal-Wallis tests (KW, 999 permutations) computed with ‘vegan’ R-package. Correlation between fish vulnerability (see “Vulnerability of microbial diversity” hereafter) and its associated microbiome diversity was assessed using Spearman’s correlation tests (“cor.test”) performed on phylogenetic independent contrasts (PIC) calculated on
diversity indices, using the fish phylogenetic tree used before [7]. Due to the lower resolution of taxonomic identification of corals in our dataset (at genus level) and the polyphyly of genera in published coral trees [29], it was not possible to compute PIC on scleratinians. Therefore, correlation between coral vulnerability and its associated microbiome diversity was performed using a simple Spearman’s correlation test.
Difference in microbial structure between plankton and animal surface microbiomes was tested using permutational multivariate ANOVAs (PERMANOVAs) performed on
dissimilarities, using “adonis” function in ‘vegan’ R-package and 999 permutations. To test if planktonic communities were more variable than surface-associated communities, a
permutation analysis of dispersion (PERMDISP) was performed on both indices among planktonic communities and among animal surface microbiomes using “betadisper” provided in ‘vegan’, with 999 permutations.
Differences between surface microbiomes associated to the three major animal groups (44 teleostean fish species, 17 anthozoan genera and 12 other invertebrates’ taxa) were tested using PERMANOVAs. The effect of animal’s taxon to its associated surface microbiome was assessed for each animal group (before averaging the microbiome per animal taxon, SM1-3 and 4) using separated PERMANOVAs.
Lastly, in order to identify prokaryotic clades that are different between plankton and animal surface microbiomes, and consistent enriched in all water samples or animal taxa, we
performed a LEfSe analysis [30] using water samples and animal taxa as subclasses, with
all-against-all parameter and p-value threshold for significance of 0.05. Then, to identify
biomarkers for each animal group (teleostean fishes, Anthozoa and other vertebrates), a LEfSe analysis was performed using these groups as main classes, and the different animal taxa belonging to these groups (fish species, anthozoan genera and other invertebrates’ taxa) as subclasses, using the same parameters.
Contribution of surface microbiomes to total microbial diversity
We used two approaches to assess the importance of planktonic vs. animal-associated prokaryotic diversity to total coral reef microbial diversity. We first computed the
phylogenetic richness of ASVs that were unique to plankton or to animal surfaces. We then compared the diversity of planktonic and animal surface microbiomes, by randomly picking from 1 to 74 animal taxa and 1 to 35 planktonic samples and then computing the total ASV and phylogenetic richness for each sampling depth. This procedure was performed 100 times. To get a conservative estimation of the total sampled + un-sampled prokaryotic species
richness in our dataset, we first curated the ASVs in our dataset, removing all unclassified ASVs that could not match any sequence in Genbank database. The remaining ASVs were then grouped into 97%-identity Operational Taxonomic Units (OTUs) using “pick_otus.py” function provided in QIIME version 1.9 [31], with default de novo usearch parameter, and OTUs found in less than 2 animal taxa were removed. We obtained 20,021 OTUs from 37,758 curated ASVs. Then, each animal taxon was considered as an independent sampling unit to count the occurrence of each OTU (i.e. the number of sampling units where the OTU was recovered). Estimates of OTU richness were calculated using the estimators provided in ‘SpadeR’ R-package [32] using “ChaoSpecies” function and type 2 incidence frequency data option.
Vulnerability of microbial diversity
To assess the vulnerability of reef microbial diversity to the loss of macro-organisms, we simulated an extinction scenario combining the effects of global warming and overfishing. Macro-organisms taxa were removed proportionally to their respective vulnerability to heat stress for hard corals, and to habitat loss (due to coral bleaching) plus fishing for fishes. Vulnerability of scleractinian coral genera to global warming was based on their bleaching response in the Western Indian Ocean [33]. The genus Isopora, for which we had no data, was excluded from the extinction scenario. Similarly, no data was available for
non-scleratinian Anthozoa and for all other invertebrates. There were therefore excluded from the scenario. Vulnerability to fishing [34] was obtained from Fishbase (http://www.fishbase.org/, 2017). Vulnerability to habitat loss due to global change in coral reefs was computed as in Graham et al. [35] using data from Fishbase.org and expert knowledge for input variables. All vulnerability indices are provided in SM1-7, and the script used to simulate such animal diversity extinction and subsequent losses of microbial taxonomic and phylogenetic diversity is available online (https://github.com/marlenec/MicroErosion).
We assessed the vulnerability of prokaryotic diversity hosted by the 44 fish species and 12 genera of scleractinian corals included in the scenario by simulating loss of the 1 to 100% most vulnerable taxa according to their individual vulnerability. At each level of extinction,
the percentage of remaining microbial diversity was compared to the one obtained from a random loss of the same number of scleractinian corals and fishes, computed 100 times. Deviation from this random loss was assessed by computing a P-value, calculated as the rank of the mean diversity value in the 100 replicates of the extinction scenario, among the
increasingly sorted diversity values of all 100 replicates of the random scenario. We considered that the deviation from the random scenario was significant when P<0.05, meaning that the diversity value in the observed community was lower than the 5% lowest diversity values following the random loss of animal taxa.
RESULTS AND DISCUSSION High diversity of animal microbiomes
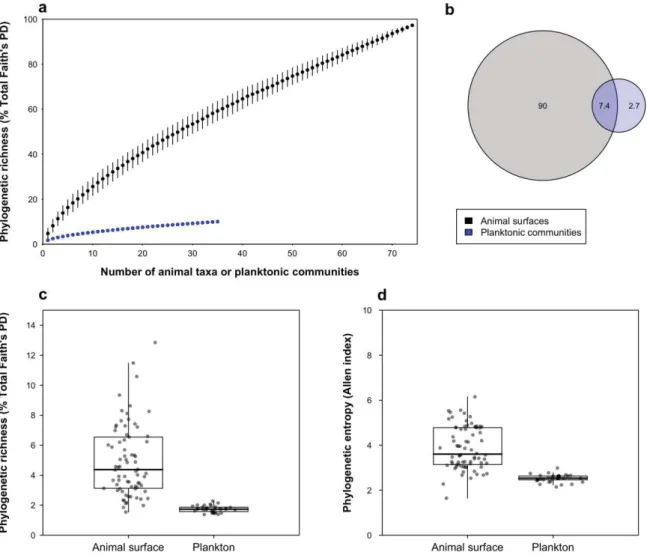
In our entire dataset made of 74 animal taxa and 35 samples of plankton, prokaryotic diversity hosted by animal surfaces contributed to 95% of total phylogenetic richness (Faith’s PD) on rarefied data (Figure 1a and b; un-rarefied data in SM2-1). Individual fish and Anthozoa samples contained slightly more ASVs than 200-mL planktonic samples (SM2-2). A recent study found on average 5 times more 97%-identity bacterial Operational Taxonomic Units (OTUs) in 1L of seawater than in coral mucus [36]. Such different results may be due to the contrasting volume of coral microbiome vs. seawater compared, a coral surface of 15-20 cm2
(see SM1-5) to 0.2 L water samples in our study vs. ~2cm2 to 1L of seawater in this former
study. Similarly, differences in the protocols used (i.e. biomolecular methods and data analysis pipelines) may explain such discrepancies.
Average surface microbiome recovered from each animal taxon (fish species, coral genus, or other invertebrate taxon) was phylogenetically richer and more diverse than a 200-mL water sample (KW on Faith’s PD and Allen’s index on rarefied and un-rarefied data, P<0.001), with one animal taxon hosting on average 4.9±2.4% of the total branch length of the phylogenetic tree grouping all ASVs recovered in the rarefied dataset, while one 200-mL water sample contained on average only 1.7±0.2% of the total branch length (Figure 1c and d; un-rarefied data in SM2-1). Additionally, 35 randomly chosen average animal microbiomes reached ca. 8-fold higher phylogenetic richness than our 35 water samples (Figure 1a), indicating that at a similar sampling effort, animal taxa host higher prokaryotic diversity compared to seawater. When considering un-rarefied data, the gap between both types of communities was narrower (SM2-1). Similar results were obtained based on ASV richness (SM2-3).
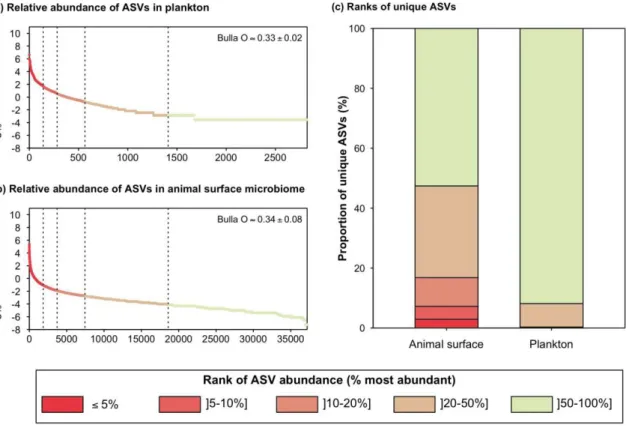
ASVs unique to animal surfaces (i.e. not detected in plankton) made more than 85% of total phylogenetic richness (Figure 1b, un-rarefied data in SM2-1), demonstrating that most of the prokaryotic phylogenetic richness was associated to animal microbiomes. 16.8% of such ASVs were abundant to moderately abundant on animal surfaces, i.e. belonging to the top 20% most abundant ASVs (Figure 2; un-rarefied data in SM2-4). By contrast, only 0.3% of the ASVs unique to plankton belonged to the 20% most abundant ASVs in planktonic samples. These results suggest that a significant portion of animal microbiome is specialized to host-associated lifestyle and may not thrive in the water column, while the most abundant planktonic prokaryotes were also capable to colonize animal skin. Such transient colonization of animal surface microbiomes may be a result of water contamination [37], or may permit host adaptation to environmental fluctuations [38].
Bacterial composition
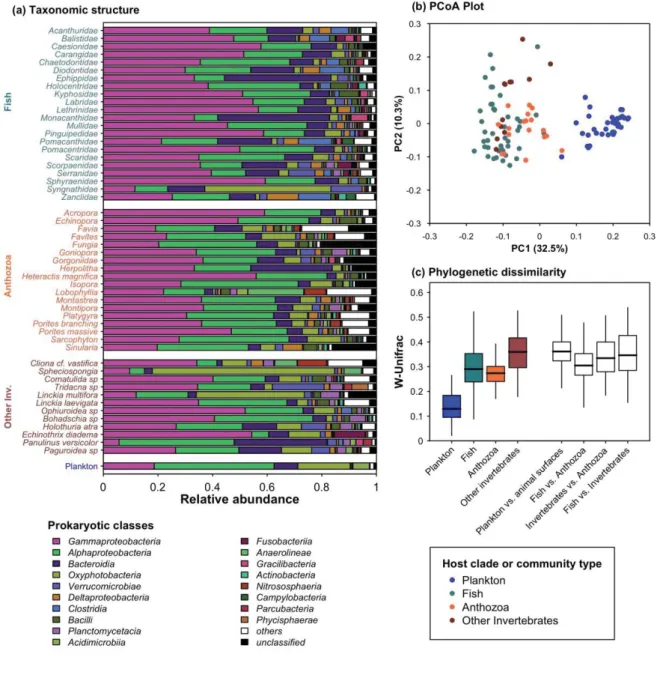
Bacteria dominated communities, accounting for 99.1±1.8% of sequences. The 18 dominant bacterial classes in animal microbiome are depicted in Figure 3a. 72% of them were also detected among the dominant classes in the whole microbiome of corals [39–41], and 61% and 50% were also detected on temperate fish skin and on tropical fish gills, respectively [42,43]. Two classes, Gracilibacteria and Campylobacteria, were not reported to be
associated to animals in the aforementioned studies. Gracilibacteria belongs to the Candidate Phyla Radiation (CPR), containing ultra-small bacteria that are recovered from diverse environments and have a probable symbiotic lifestyle [44]. Campylobacteria contained mostly the genus Arcobacter in our study (up to 8% of abundance). This genus usually inhabits the human or animal gastrointestinal system, though free-living strains have been isolated in various environments [45]. This genus has been isolated from coral disease lesions [46,47]. It has also been recovered from corals exposed to fish farm effluents and in
thermally-stressed corals [48,49]. Here, while the corals were apparently healthy and sampled far from coastal cities (SM1-1), the high temperatures at the time of sampling (SM1-2), together with a potential contamination of the lagoon by human faeces due to the absence of effluent treatment in Mayotte [50] may explain the presence of this genus.
Structure of prokaryotic communities recovered on animal surfaces was significantly distinct from plankton (PERMANOVA on W-Unifrac on rarefied data, P=0.001, R2=0.29, Figure 3a,
b and c, un-rarefied data and U-Unifrac in SM2-5 and 6). Plankton was mostly enriched in
Prochlorochoccus and Synechococcus), and the actinobacterial family Actinomarinaceae
(Figures 3a and SM2-6 and 7). All these clades are abundant and widely distributed marine photoautotrophs and photoheterotrophs displaying small cell sizes and genomic reduction [51–55], that may be selected by the very oligotrophic conditions of surface ocean [56]. The presence of such taxa on our sites suggests that the reefs were well preserved from coastal eutrophication at the time of sampling.
By contrast, animal surfaces were mostly enriched in Gammaproteobacteria (especially
Endozoicomonas), Firmicutes (especially Clostridia), Betaproteobacteriales (especially Burkholderiaceae), the alpha-proteobacterial Rhizobiales and Sphingomonadaceae, and Verrucomicrobia. Such clades have been previously identified in temperate and tropical
marine fish skin, gut and gill microbiomes [42,43,57–61], and at the surface or inside marine invertebrates [9,58,62,63]. Endozoicomonas, especially, is associated to a wide range of hosts, from fish to hard and soft corals, sponges and tunicates, and is hypothesized to play a
significant role in host’s nutrition and health [58]. Particularly, Endozoicomonas genomes show enrichment in several functions that may help to cooperate with various types of hosts (e.g. protein secretion and carbohydrate transport), but also potential functional specialization depending on their hosts [64], that might explain the ubiquity of such genus on the wide diversity of animals studied here. To confirm this hypothesis, such taxonomic assessment of animal-associated microbiomes should be completed by studies assessing the functions that are necessary for bacteria to thrive on marine hosts.
High dissimilarity between animal microbiomes
The high phylogenetic diversity of animal surface microbiomes was paired with a 2.3 times higher variability among those microbiomes than among planktonic samples (PERMDISP on W-Unifrac on rarefied data, P<0.001, Figure 3c and SM2-5). The three major animal groups sampled, i.e. teleostean fishes, Anthozoa and other invertebrates, hosted significantly different prokaryotic communities at their surface, with the distinction between such groups explaining between 5% and 11% of variability (PERMANOVAs, P<0.001, SM2-8). However no
significant biomarker was identified using LEfSe analysis for each of these groups, indicating that there is no consistently enriched bacterial clade in all animal taxa of these groups, as highlighted by the high dissimilarity between taxa within each group (Figure 3b and c, SM2-5).
Among each main animal group, there was a significant effect of animal taxon on surface-associated microbiome structure and composition (PERMANOVAs, SM2-8). Interestingly, while the larger animal groups explained up to 11% of microbiome dissimilarity, the effect of such smaller taxa explained from 34% (for coral genera) to 49% (for fish species) of surface microbiome variability (PERMANOVAs on rarefied data, P<0.001; SM2-8).
While the species-specificity of marine animal skin microbiome has already been reported [7], here we report that this interspecific variability within a clade is as high as between different clades that diverged ~800 Mya (Figures 3c and SM2-5, divergence time estimate between Teleostei and Anthozoa according to http://www.timetree.org/). This finding suggests that the correlation between host phylogenetic relationships and microbiome composition, a pattern called ‘phylosymbiosis’, that has been evidenced in numerous animal models including microbiomes of tropical fish skin, sponges and coral skeleton [7,36,65], may be unobservable at deeper phylogenetic level due to the very large phenotypic differences between the hosts that would saturate this signal.
Exceptional reef microbial diversity
As a consequence of the coupled high diversity and high variability of animal surface
microbiomes, the prokaryotic diversity sampled on animal surface microbiomes in this study is far from reaching an asymptote (Figures 1a, SM2-1, SM2-3). We estimated that the total sampled and un-sampled bacterial diversity associated to the subset of reef animals we sampled would range from 8,700 to more than 20,000 97%-identity bacterial OTUs, respectively on rarefied and un-rarefied data (SM2-9).
Recent estimate of world’s bacterial diversity predicted that there exists 0.8–1.6 million prokaryotic OTUs worldwide [66]. Our richness estimates correspond to 0.5% to 2.5% of such global diversity. This is striking, given that coral reefs occupy less than 0.1% of surface worldwide, with southwestern Indian Ocean coral reefs making 1.8% of that surface (0.001% of global surface, www.reefbase.org/). Here, we based our estimates on carefully curated ASVs grouped as 97%-identity OTUs, which prevented any overestimation of prokaryotic richness at a local scale [67]. In addition, we only sampled a <7% subset of animal diversity in Mayotte’s lagoon, hosting more than 700 fish species [68], 57 soft corals [69], 22 sea cucumbers [70], more than 200 scleractinian species and subspecies, 13 Asteroideae, 36 ascidians, 56 bivalves and 23 Ophiuroideae [71]. We also did not sample any species from other phylogenetically contrasted clades such as sharks and rays, sea turtle and mammal,, and vegetal species inhabiting Mayotte’s lagoon. Likewise, we did not sample the microbes living
within the tissue and skeleton of corals nor those living in fish guts. Our claim is that coral reef communities, just as they host a large portion of marine macrobial diversity compared to their surface [1], may also support a significant proportion of global marine prokaryotic diversity. More extensive sampling on the thousands of coral reef animals on different coral reefs will allow refining the estimates provided here.
Vulnerability of reef microbial diversity
The loss of an animal species due to environmental disturbances at a given location induces the loss of its associated unique microbial diversity. We classified fish species and
scleratinian genera depending on their respective vulnerability, to the combined overfishing and habitat loss in the case of fish, and ocean warming in the case of corals (see Methods and SM1-7). There was no correlation between animal vulnerability and microbial diversity at its surface (Spearman correlation tests, P>0.05). Microbial diversity erosion following
macroscopic extinction scenarios revealed that the loss of the 50% most vulnerable coral and fish species for which we had vulnerability data would induce a loss of ca. 28 to 29% of ASVs (SM2-10) and 23% of phylogenetic richness (Figure 4a and SM2-11). Such lower phylogenetic erosion indicates a moderate phylogenetic redundancy between animal surface-associated ASVs. The slope of microbial diversity extinction was only slightly steeper with increasing loss of macroscopic species (Figure 4b and SM2-11). Accordingly, levels of prokaryotic diversity loss were not significantly different from that expected under a random extinction scenario, because the most vulnerable animal species and less vulnerable ones host partially redundant prokaryotic diversity.
To our knowledge, no quantified vulnerability measures exist for invertebrates other than sessile Anthozoa, so we did not include them in our extinction scenario. In our dataset,
microbiomes of invertebrates other than Anthozoa showed the highest diversity and variability (Figure 3c, SM2-2, SM2-5), suggesting that the loss of such warming-sensitive taxa [72], as well as those targeted by humans [73], would induce a more severe erosion of coral reef microbial diversity than the one simulated here. Our results should be further completed by an assessment of the functional erosion that may result from anthropic activities, as such unique phylogenetic diversity in animal microbiomes may also host unique microbial functions in coral reef ecosystems [74]. Finally, our scenario did not account for potential direct effects of anthropic stressors (warming, acidification) that could alter the diversity and functions of microbiomes [75].
CONCLUSIONS
Reef animals macro-organisms host a high and unique diversity of microbes at their surface. Hence, the thousands species living in coral reef ecosystems may support a substantial part of marine microbial diversity. For now, roles of animal surface microbiomes for ecosystem functioning are only partially described, but could be essential (e.g. production and
degradation of dimethylsulfoniopropionate, a crucial molecule in sulphur cycling; [4]). Future studies should investigate to which extent these unique and vulnerable microbial lineages present on animals contribute to coral reef functioning and possible consequence of their loss in the Anthropocene.
Acknowledgements
We thank Emily Darling and Jérémie Vidal-Dupiol for helping us identify hard corals, and Frederic Ducarme for his help identifying echinoderms.
Data accessibility
Sequence data is available in the NCBI Sequence Read Archive database under the biosample numbers SRS2702344-SRS2702519 and SRS4077375-SRS4077501. Bacterial ASV table and associated metadata and sequences are available on DRYAD repository
(https://doi.org/10.5061/dryad.wh70rxwjw).
Funding
This project was funded by the TOTAL Foundation (MICMAC projet BIO-2015-135-49, #138295). The funders had no role in study design, sampling and analysis decision to publish, or preparation of the manuscript.
REFERENCES
1. Fisher R, O’Leary R, Low-Choy S, Mengersen K, Knowlton N, Brainard RE, Caley JM. 2015 Species Richness on Coral Reefs and the Pursuit of Convergent Global
Estimates. Current Biology 25, 500–505. (doi:10.1016/j.cub.2014.12.022) 2. Knowlton N. 2008 Coral reefs. Current Biology 18, R18–R21.
(doi:10.1016/j.cub.2007.11.018)
3. Kulbicki M et al. 2013 Global Biogeography of Reef Fishes: A Hierarchical
Quantitative Delineation of Regions. PLOS ONE 8, e81847. (doi:10.1371/journal.pone.0081847)
4. Bourne DG, Morrow KM, Webster NS. 2016 Insights into the Coral Microbiome: Underpinning the Health and Resilience of Reef Ecosystems. Annual Review of
Microbiology 70, 317–340. (doi:10.1146/annurev-micro-102215-095440)
5. Krediet CJ, Ritchie KB, Alagely A, Teplitski M. 2013 Members of native coral microbiota inhibit glycosidases and thwart colonization of coral mucus by an opportunistic pathogen. ISME J. 7, 980–990. (doi:10.1038/ismej.2012.164)
6. Glasl B, Herndl GJ, Frade PR. 2016 The microbiome of coral surface mucus has a key role in mediating holobiont health and survival upon disturbance. ISME J 10, 2280– 2292. (doi:10.1038/ismej.2016.9)
7. Chiarello M et al. 2018 Skin microbiome of coral reef fish is highly variable and
driven by host phylogeny and diet. Microbiome 6, 147. (doi:10.1186/s40168-018-0530-4)
8. Larsen A, Tao Z, Bullard SA, Arias CR. 2013 Diversity of the skin microbiota of fishes: evidence for host species specificity. FEMS Microbiol. Ecol. 85, 483–494. (doi:10.1111/1574-6941.12136)
9. Carlos C, Torres TT, Ottoboni LMM. 2013 Bacterial communities and species-specific associations with the mucus of Brazilian coral species. Scientific Reports 3, 1624. (doi:10.1038/srep01624)
10. Chiarello M, Paz-Vinas I, Veyssière C, Santoul F, Loot G, Ferriol J, Boulêtreau S. 2019 Environmental conditions and neutral processes shape the skin microbiome of European catfish (Silurus glanis) populations of Southwestern France. Environmental
Microbiology Reports 11, 605–614.
11. Sunagawa S et al. 2015 Structure and function of the global ocean microbiome. Science 348, 1261359. (doi:10.1126/science.1261359)
12. Vargas C de et al. 2015 Eukaryotic plankton diversity in the sunlit ocean. Science
348, 1261605. (doi:10.1126/science.1261605)
13. Troussellier M, Escalas A, Bouvier T, Mouillot D. 2017 Sustaining Rare Marine Microorganisms: Macroorganisms As Repositories and Dispersal Agents of Microbial Diversity. Front Microbiol 8. (doi:10.3389/fmicb.2017.00947)
14. Cleary DFR et al. 2019 The sponge microbiome within the greater coral reef
microbial metacommunity. Nature Communications 10, 1644. (doi:10.1038/s41467-019-09537-8)
15. Hughes TP et al. 2017 Global warming and recurrent mass bleaching of corals. Nature 543, 373–377. (doi:10.1038/nature21707)
16. Hughes TP, Bellwood DR, Connolly SR, Cornell HV, Karlson RH. 2014 Double Jeopardy and Global Extinction Risk in Corals and Reef Fishes. Current Biology 24, 2946– 2951. (doi:10.1016/j.cub.2014.10.037)
17. McCauley DJ, Pinsky ML, Palumbi SR, Estes JA, Joyce FH, Warner RR. 2015 Marine defaunation: Animal loss in the global ocean. Science 347, 1255641.
18. Dixon P. 2003 VEGAN, a package of R functions for community ecology. Journal of
Vegetation Science 14, 927–930. (doi:10.1111/j.1654-1103.2003.tb02228.x)
19. Zhang Z, Huang H. 2007 Turing’s formula revisited*. Journal of Quantitative
Linguistics 14, 222–241. (doi:10.1080/09296170701514189)
20. Marcon E, Hérault B. 2014 entropart: An R Package to Measure and Partition Diversity.
21. DeSantis TZ et al. 2006 Greengenes, a Chimera-Checked 16S rRNA Gene Database
and Workbench Compatible with ARB. Appl. Environ. Microbiol. 72, 5069–5072. (doi:10.1128/AEM.03006-05)
22. Janssen S et al. 2018 Phylogenetic Placement of Exact Amplicon Sequences
Improves Associations with Clinical Information. mSystems 3. (doi:10.1128/mSystems.00021-18)
23. Faith DP. 1992 Conservation evaluation and phylogenetic diversity. Biological
Conservation 61, 1–10. (doi:10.1016/0006-3207(92)91201-3)
24. Kembel SW, Cowan PD, Helmus MR, Cornwell WK, Morlon H, Ackerly DD, Blomberg SP, Webb CO. 2010 Picante: R tools for integrating phylogenies and ecology.
Bioinformatics 26, 1463–1464. (doi:10.1093/bioinformatics/btq166)
25. Allen B, Kon M, Bar-Yam Y. 2009 A New Phylogenetic Diversity Measure
Generalizing the Shannon Index and Its Application to Phyllostomid Bats. The American
Naturalist 174, 236–243. (doi:10.1086/600101)
26. Bulla L. 1994 An Index of Evenness and Its Associated Diversity Measure. Oikos
70, 167–171. (doi:10.2307/3545713)
27. Mouillot D, Wilson JB. 2002 Can We Tell How a Community Was Constructed? A Comparison of Five Evenness Indices for Their Ability to Identify Theoretical Models of Community Construction. Theoretical Population Biology 61, 141–151.
(doi:10.1006/tpbi.2001.1565)
28. Chen J, ORPHANED M. 2012 Package ‘GUniFrac’.
29. Huang D, Roy K. 2015 The future of evolutionary diversity in reef corals.
Philosophical Transactions of the Royal Society B: Biological Sciences 370, 20140010.
(doi:10.1098/rstb.2014.0010)
30. Segata N, Izard J, Waldron L, Gevers D, Miropolsky L, Garrett WS, Huttenhower C. 2011 Metagenomic biomarker discovery and explanation. Genome Biology 12, R60. (doi:10.1186/gb-2011-12-6-r60)
31. Caporaso JG et al. 2010 QIIME allows analysis of high-throughput community
sequencing data. Nature Methods 7, 335–336. (doi:10.1038/nmeth.f.303)
32. Chao A, Ma KH, Hsieh TC, Chiu CH. 2016 SpadeR (species-richness prediction and diversity estimation in R): an R package in CRAN. Program and user’s guide published at
http://chao. stat. nthu. edu. tw/wordpress/software_download
33. McClanahan TR, Ateweberhan M, Graham NAJ, Wilson SK, Sebastin CR, Guillaume MMM, Bruggemann JH. 2007 Western Indian Ocean coral communities: bleaching responses and susceptibility to extinction. Mar Ecol Prog Ser 337, 1–13.
(doi:10.3354/meps337001)
34. Cheung WWL, Pitcher TJ, Pauly D. 2005 A fuzzy logic expert system to estimate intrinsic extinction vulnerabilities of marine fishes to fishing. Biological Conservation
124, 97–111. (doi:10.1016/j.biocon.2005.01.017)
35. Graham NAJ et al. 2011 Extinction vulnerability of coral reef fishes. Ecology Letters 14, 341–348. (doi:10.1111/j.1461-0248.2011.01592.x)
36. Pollock FJ, McMinds R, Smith S, Bourne DG, Willis BL, Medina M, Thurber RV, Zaneveld JR. 2018 Coral-associated bacteria demonstrate phylosymbiosis and
cophylogeny. Nature Communications 9, 4921. (doi:10.1038/s41467-018-07275-x) 37. Sweet MJ, Bulling MT. 2017 On the Importance of the Microbiome and Pathobiome in Coral Health and Disease. Front. Mar. Sci. 4.
(doi:10.3389/fmars.2017.00009)
38. Hester ER, Barott KL, Nulton J, Vermeij MJ, Rohwer FL. 2016 Stable and sporadic symbiotic communities of coral and algal holobionts. ISME J 10, 1157–1169.
(doi:10.1038/ismej.2015.190)
39. Sharp KH, Pratte ZA, Kerwin AH, Rotjan RD, Stewart FJ. 2017 Season, but not symbiont state, drives microbiome structure in the temperate coral Astrangia poculata.
Microbiome 5, 120. (doi:10.1186/s40168-017-0329-8)
40. Apprill A, Weber LG, Santoro AE. 2016 Distinguishing between Microbial Habitats Unravels Ecological Complexity in Coral Microbiomes. mSystems 1.
(doi:10.1128/mSystems.00143-16)
41. Quigley KM, Roa CA, Torda G, Bourne DG, Willis BL. In press. Co-dynamics of Symbiodiniaceae and bacterial populations during the first year of symbiosis with Acropora tenuis juveniles. MicrobiologyOpen n/a, e959. (doi:10.1002/mbo3.959) 42. Minniti G, Hagen LH, Porcellato D, Jørgensen SM, Pope PB, Vaaje-Kolstad G. 2017 The Skin-Mucus Microbial Community of Farmed Atlantic Salmon (Salmo salar). Front.
Microbiol. 8. (doi:10.3389/fmicb.2017.02043)
43. Pratte ZA, Besson M, Hollman RD, Stewart FJ. 2018 The gills of reef fish support a distinct microbiome influenced by host-specific factors. Appl. Environ. Microbiol.
(doi:10.1128/AEM.00063-18)
44. Méheust R, Burstein D, Castelle CJ, Banfield JF. 2019 The distinction of CPR bacteria from other bacteria based on protein family content. Nat Commun 10, 1–12. (doi:10.1038/s41467-019-12171-z)
45. Pérez-Cataluña A, Salas-Massó N, Diéguez AL, Balboa S, Lema A, Romalde JL, Figueras MJ. 2018 Revisiting the Taxonomy of the Genus Arcobacter: Getting Order From the Chaos. Front. Microbiol. 9. (doi:10.3389/fmicb.2018.02077)
46. Sunagawa S, DeSantis TZ, Piceno YM, Brodie EL, DeSalvo MK, Voolstra CR, Weil E, Andersen GL, Medina M. 2009 Bacterial diversity and White Plague Disease-associated community changes in the Caribbean coral Montastraea faveolata. ISME J 3, 512–521. (doi:10.1038/ismej.2008.131)
47. Meyer JL, Castellanos-Gell J, Aeby GS, Häse CC, Ushijima B, Paul VJ. 2019 Microbial Community Shifts Associated With the Ongoing Stony Coral Tissue Loss Disease
Outbreak on the Florida Reef Tract. Front Microbiol 10. (doi:10.3389/fmicb.2019.02244)
48. Garren M, Raymundo L, Guest J, Harvell CD, Azam F. 2009 Resilience of Coral-Associated Bacterial Communities Exposed to Fish Farm Effluent. PLOS ONE 4, e7319. (doi:10.1371/journal.pone.0007319)
49. Shiu J-H, Keshavmurthy S, Chiang P-W, Chen H-J, Lou S-P, Tseng C-H, Hsieh HJ, Chen CA, Tang S-L. 2017 Dynamics of coral-associated bacterial communities acclimated to temperature stress based on recent thermal history. Sci Rep 7, 1–13.
(doi:10.1038/s41598-017-14927-3)
50. Gourbesville Ph, Thomassin BA. 2000 Coastal environment assessment procedure for sustainable wastewater management in tropical islands: the Mayotte example. Ocean
& Coastal Management 43, 997–1014. (doi:10.1016/S0964-5691(00)00072-7)
51. Burkill PH, Leakey RJG, Owens NJP, Mantoura RFC. 1993 Synechococcus and its importance to the microbial foodweb of the northwestern Indian Ocean. Deep Sea
(doi:10.1016/0967-0645(93)90057-T)
52. Dupont CL et al. 2012 Genomic insights to SAR86, an abundant and uncultivated
marine bacterial lineage. ISME J 6, 1186–1199. (doi:10.1038/ismej.2011.189) 53. Ghai R, Mizuno CM, Picazo A, Camacho A, Rodriguez-Valera F. 2013
Metagenomics uncovers a new group of low GC and ultra-small marine Actinobacteria.
Sci Rep 3, 1–8. (doi:10.1038/srep02471)
54. Grébert T et al. 2018 Light color acclimation is a key process in the global ocean
distribution of Synechococcus cyanobacteria. PNAS 115, E2010–E2019. (doi:10.1073/pnas.1717069115)
55. Kent AG, Dupont CL, Yooseph S, Martiny AC. 2016 Global biogeography of Prochlorococcus genome diversity in the surface ocean. ISME J 10, 1856–1865. (doi:10.1038/ismej.2015.265)
56. Giovannoni SJ, Cameron Thrash J, Temperton B. 2014 Implications of streamlining theory for microbial ecology. ISME J 8, 1553–1565.
(doi:10.1038/ismej.2014.60)
57. Chiarello M, Villéger S, Bouvier C, Bettarel Y, Bouvier T. 2015 High diversity of skin-associated bacterial communities of marine fishes is promoted by their high variability among body parts, individuals and species. FEMS Microbiology Ecology , fiv061. (doi:10.1093/femsec/fiv061)
58. Neave MJ, Apprill A, Ferrier-Pagès C, Voolstra CR. 2016 Diversity and function of prevalent symbiotic marine bacteria in the genus Endozoicomonas. Appl Microbiol
Biotechnol 100, 8315–8324. (doi:10.1007/s00253-016-7777-0)
59. Egerton S, Culloty S, Whooley J, Stanton C, Ross RP. 2018 The Gut Microbiota of Marine Fish. Front. Microbiol. 9. (doi:10.3389/fmicb.2018.00873)
60. Sullam KE, Essinger SD, Lozupone CA, O’connor MP, Rosen GL, Knight R, Kilham SS, Russell JA. 2012 Environmental and ecological factors that shape the gut bacterial communities of fish: a meta-analysis. Molecular Ecology 21, 3363–3378.
(doi:10.1111/j.1365-294X.2012.05552.x)
61. Wang C, Sun G, Li S, Li X, Liu Y. 2018 Intestinal microbiota of healthy and
unhealthy Atlantic salmon Salmo salar L. in a recirculating aquaculture system. J. Ocean.
Limnol. 36, 414–426. (doi:10.1007/s00343-017-6203-5)
62. Cooney RP, Pantos O, Tissier MDAL, Barer MR, O´Donnell AG, Bythell JC. 2002 Characterization of the bacterial consortium associated with black band disease in coral using molecular microbiological techniques. Environmental Microbiology 4, 401–413. (doi:10.1046/j.1462-2920.2002.00308.x)
63. Maravić A, Skočibušić M, Šprung M, Šamanić I, Puizina J, Pavela-Vrančić M. 2012 Occurrence and antibiotic susceptibility profiles of Burkholderia cepaciacomplex in coastal marine environment. International Journal of Environmental Health Research 22, 531–542. (doi:10.1080/09603123.2012.667797)
64. Neave MJ, Michell CT, Apprill A, Voolstra CR. 2017 Endozoicomonas genomes reveal functional adaptation and plasticity in bacterial strains symbiotically associated with diverse marine hosts. Sci Rep 7, 1–12. (doi:10.1038/srep40579)
65. Easson CG, Thacker RW. 2014 Phylogenetic signal in the community structure of host-specific microbiomes of tropical marine sponges. Front Microbiol 5.
(doi:10.3389/fmicb.2014.00532)
66. Louca S, Mazel F, Doebeli M, Parfrey LW. 2019 A census-based estimate of Earth’s bacterial and archaeal diversity. PLOS Biology 17, e3000106.
(doi:10.1371/journal.pbio.3000106)
Methods on 16S rRNA Gene Bacterial Community Analysis of Dairy Products. mSphere 3. (doi:10.1128/mSphere.00410-18)
68. Wickel J, Jamon A, Pinault M, Durville P, Pascale C. 2014 Composition et structure des peuplements ichtyologiques marins de l’île de Mayotte (sud-ouest de l’océan
Indien). Société Française d’Ichtyologie
69. Schleyer MH, Benayahu Y. 2016 The soft coral fauna (Octocorallia: Alcyonacea) of Mayotte. Mar Biodiv , 1–8. (doi:10.1007/s12526-016-0621-z)
70. Eriksson H, Byrne M, de la Torre-Castro M. 2012 Sea cucumber (Aspidochirotida) community, distribution and habitat utilization on the reefs of Mayotte, Western Indian Ocean. Marine Ecology Progress Series 452, 159–170. (doi:10.3354/meps09665)
71. In press. INPN - National Inventory of Natural Heritage. Inventaire National du
Patrimoine Naturel. See https://inpn.mnhn.fr/accueil/index (accessed on 13 November
2018).
72. Przeslawski R, Ahyong S, Byrne M, Wörheide G, Hutchings P. 2008 Beyond corals and fish: the effects of climate change on noncoral benthic invertebrates of tropical reefs. Global Change Biology 14, 2773–2795. (doi:10.1111/j.1365-2486.2008.01693.x) 73. Polovina JJ, Haight WR, Moffitt RB, Parrish FA. 1995 The Role of Benthic Habitat, Oceanography, and Fishing On the Population Dynamics of the Spiny Lobster, Panulirus Marginatus (Decapoda, Palinuridae), in the Hawaiian Archipelago. Crustaceana 68, 203– 212. (doi:10.1163/156854095X00106)
74. Martiny JBH, Jones SE, Lennon JT, Martiny AC. 2015 Microbiomes in light of traits: A phylogenetic perspective. Science 350, aac9323. (doi:10.1126/science.aac9323)
75. Zaneveld JR et al. 2016 Overfishing and nutrient pollution interact with
temperature to disrupt coral reefs down to microbial scales. Nat Commun 7, 11833. (doi:10.1038/ncomms11833)
Competing interests
The authors declare that they have no competing interests.
Authors’ contribution
MC, TB and SV contributed to the conceptualization of the study. MC, CB, NAJG, TB, and SV contributed to the methodology. MC, J-CA, CB, TC, CXRO, FR, ES, and SV helped in the investigation. MC conducted the analyses and writing of the original draft. MC, J-CA, YB, CB, TC, NAJG, FR, ES, TB, and SV contributed to writing, reviewing, and editing of the manuscript. TB, MC and SV helped in the acquisition of funding. TB and SV supervised the study. All authors read and approved the final manuscript.
FIGURES
Figure 1. Phylogenetic diversity of reef microbial communities
(a) Accumulation curves showing the phylogenetic richness (Faith’s PD, expressed in
percentage of maximum PD of the entire dataset) obtained from animal surface microbiomes and planktonic communities, depending on the number of randomly selected planktonic communities or animal taxa, represented as the mean ± the standard deviation across 100 random subsamples. (b) Venn diagram representing the percentage of phylogenetic richness unique to animal surface microbiomes after pooling all animal taxa and to planktonic
communities, and shared between both compartments. (c and d) Boxplots of (c) Percentage of PD and (d) phylogenetic diversity (Allen’s index) recovered from animal surface
microbiomes and plankton. The same figure based on un-rarefied data is provided in SM2-1. Accumulation curves and Venn diagram based on ASV-richness are provided in SM2-3.
Figure 2. Abundance of ASVs in animal surface microbiomes and plankton.
(a and b) Average rank-abundance curves obtained from surface microbiomes of (a) animal surface microbiomes and (b) planktonic communities. Vertical dotted lines represent 5, 10, 20 and 50% threshold for most abundant ASVs. The average evenness of ASVs abundances (Bulla’s O) in each compartment is indicated on the corresponding plot. (c) Rank of
abundances of ASVs unique to animal surface microbiomes or to plankton within respective microbial communities. The same figure based on un-rarefied data is provided in SM2-4.
Figure 3. Dissimilarity in taxonomic and phylogenetic structure of microbial communities from plankton or animal surfaces
(a) Dominance of 18 prokaryotic classes for animal surface microbiomes (averaged by fish families, Anthozoa genera and other invertebrates’ taxa) and for plankton (averaged across all 35 planktonic communities). (b) Microbial communities are plotted on the two first axes of a PCoA computed on W-Unifrac. (c) Intra-and inter-group W-Unifrac. Results based on un-rarefied data and on U-Unifrac are provided in SM2-5 and 6.
Figure 4. Vulnerability of coral reef microbial phylogenetic richness to loss of fishes and scleratinian corals.
(a) Mean (±SD) of remaining prokaryotic phylogenetic richness on the studied coral reef for a given proportion of animal taxa lost according to the simulated erosion scenario (100
replicates). When 100% of coral and fish species included in the scenario are lost, the
remaining microbial phylogenetic richness corresponds to the one of prokaryotic communities associated to plankton and animal taxa that were not included in the extinction scenario (i.e. 24% of taxa, corresponding to Isopora, soft corals, gorgonians, anemone and all
non-anthozoan invertebrates). Scenario simulating a random loss of fishes and corals (i.e. species removed independently from their vulnerability) is illustrated with the grey area representing the range of remaining phylogenetic richness among 100 replicates.
(b) Mean (solid line) ± SD (shaded area) of slopes of phylogenetic richness loss calculated at each level of extinction on all 100 replicates. The same analyses based on un-rarefied data and on ASV richness are provided in SM2-10 and 11.