HAL Id: hal-02737983
https://hal.inrae.fr/hal-02737983
Submitted on 2 Jun 2020HAL is a multi-disciplinary open access archive for the deposit and dissemination of sci-entific research documents, whether they are pub-lished or not. The documents may come from teaching and research institutions in France or abroad, or from public or private research centers.
L’archive ouverte pluridisciplinaire HAL, est destinée au dépôt et à la diffusion de documents scientifiques de niveau recherche, publiés ou non, émanant des établissements d’enseignement et de recherche français ou étrangers, des laboratoires publics ou privés.
Distributed under a Creative Commons Attribution| 4.0 International License
Conceptual basis, formalisations and parameterization of
the STICS crop model, second edition
Nicolas Beaudoin, Dominique Ripoche, L. Strullu, Bruno Mary, Marie Launay,
Joël Léonard, Patrice Lecharpentier, François Affholder, Patrick Bertuzzi,
Samuel Buis, et al.
To cite this version:
Nicolas Beaudoin, Dominique Ripoche, L. Strullu, Bruno Mary, Marie Launay, et al.. Conceptual basis, formalisations and parameterization of the STICS crop model, second edition. iCROPM2020 Symposium - Crop Modelling for The Future, Feb 2020, Montpellier, France. 73 p. �hal-02737983�
1
6-7 January 2020 – Montpellier
BOOK OF ABSTRACTS
XII
th
Stics users seminar
https://www6.paca.inrae.fr/stics_eng/
2
XII
th
Stics users seminar
Book of abstracts
Montpellier
6-7 January 2020
Scientific committee
François Affholder - CIRAD/AIDA
Eric Justes - CIRAD/PERSYST
EPS Stics Team
Gatien Falconnier - CIRAD/AIDA
Guillaume Jégo – AFFC
Organization committee
François Affholder - CIRAD/AIDA
Michel Giner - CIRAD/AIDA
Brigitte Giudicelli - CIRAD/AIDA
Anne-Laure Fruteau de Laclos -
CIRAD/AIDA
Remi Vezy - CIRAD/AMAP
Krishna Naudin - CIRAD/AIDA
3
EDITORIAL
The STICS team is happy to invite you to the 12
thStics users seminar.
This seminar is a side-session of the iCROPM symposium that gathers eminent
crop modelers from all around the globe. The iCROPM will focus on advances in
crop modelling in general, with a great diversity of models and views on crop
modelling. This seminar will focus more specifically on the Stics model and on
the scientists community familiar to, or interested in the way the model (i)
conceptualizes and simulates cropping systems (ii) has evolves over the past
years to account for an increasing range of cropping systems properties. It offers
a unique opportunity to take advantage of the great diversity of the views and
expertise of the scientists coming to Montpellier this week.
We chose to host the seminar at the Agropolis campus in Montpellier, at the
French agricultural research and international cooperation organization CIRAD
that works for the sustainable development of tropical and Mediterranean
regions. It is not mere coincidence - it underlies our will to strengthen the ability
of the Stics model to deal with issues at stake in tropical environments. This is
also reflected in the program and the list of participants.
We truly hope you will enjoy this Stics2020 seminar, and that it will offer you the
opportunity to connect and exchange with new people on your favorite topic as
well as on other challenges you want to undertake for the future.
4
Thursday 6th February 2020
Talk (min) Discussion (min) Speaker8:00 - 9:00 Registration - CIRAD - Registration desk at Alliot Amphitheater
Chair: E. Justes
9:00 - 9:15 Welcome speeches 15
JP. Laclau (CIRAD) + P. Cellier (INRAE) + STICS team head
9:15 - 10:40 Session 1: News from the last STICS workshop
News and propects for the STICS team and network 20 5
E. Justes, D. Ripoche, M. Launay and S. Buis.
The Red Book of STICS, towards version 2 2 - N. Beaudoin
The genesis of STICS v10 and new formalisms implemented in the next standard version 20 5 L. Strullu
SticsRpacks: a set of packages for managing Stics from R 15 5 S. Buis S. & P. Lecharpentier
10:40 - 11: 00 Coffee break
11:10 - 12:30 Session 2: New formalisms and crop calibration for crop diagnosis Chair:
G. Falconnier Development of a new formalism for the establishment of grain yield and protein for determinate growing plants in a dedicated research version of STICS
15 5 N. Beaudoin or B. Dumont Assessment of the impact of water stress on soybean yield in Canada using STICS 15 5 G. Jégo
Comparison of sugarcane STICS model calibrations to simulate growth response to climate variability
15 5 M. Christina
Use of the STICS model for simulating physiological and soil evolution in the Champagne vineyard under different scenarios
15 5 C. Demestihas
12:30 - 14:00 Lunch break (Agropolis International - Vanille room)
14:00 - 15:30 Session 3: Modelling intercropping with STICS Chair: G. Louarn
How to model crop-weed competition for soil resources: Connecting the STICS soil submodel to
the FLORSYS weed dynamics model 15 5 N. Colbach
Improving the intercropping version of the STICS model for simulating inter-specific competition 15 5 R. Vezy Calibration and Evaluation of the STICS Intercrop Model for Two Cereal-Legume Mixtures 15 5 K. Paff
5
Modelling the agronomic performance of millet-cowpea intercropping under the semi-arid
environment of Senegal. 12 3 Y. Senghor
Calibration of STICS soil-crop model for sorghum crop mixed with cowpea bean to evaluate the
performance of this crop-system in sub-Saharan Africa 12 3 A. Traoré
15:30 - 16: 00 Coffee break
16:00 - 17:30 Session 4: Methods and new tools for modelling with STICS Chair: F. Affholder
AgGlob: Workflow for simulation of agronomic models at a global scale 15 5 H. Raynal
Preliminary coupling of STICS (v9.1) to PEcAn ecological informatics toolbox, and its comparison
to BASGRA 15 5 I. Fer
A global optimization tool for assimilation of leaf area index into STICS crop model 15 5 M. Mesbah STICS on SIWAA: A STICS Tool set deployed on the SIWAA Galaxy Web platform 12 3 P. Chabrier A new method for sensitivity analysis of models with dynamic and/or spatial outputs 12 3 S. Buis
17:30 End of the 1st day
17:30 - 19: 00 Free time and Transfer to Montpellier social dinner place with public transports 19:00 - 23 :00 Social dinner – Villa mont-riant - Montpellier - 6 boulevard vieussens
Friday 7th February 2020
9:00 - 10:00 Session 5: Environmental impact of cropping systems and soil C&N dynamics Chair: I. Garcia de Cortazar
Verification and long-term simulations of STICS crop model to predict and analyze growing
seasons N2O fluxes of spring wheat in eastern Canada 15 5 E. Pattey
Modelling decomposition and N2O emissions of mulches varying in quantity and quality 15 5 B. Chaves
Modelling short and long-term nitrogen and carbon budgets of agro-ecological cropping systems
with a dedicated STICS research version 15 5 N. Beaudoin
10:00 - 10:50 short talks (presentation of posters)
STICS ability to simulate long-term soil organic matter dynamics in crop-grassland rotations 5 2 A.I. Graux (A. Cadero) Simulation of switchgrass biomass production in Eastern Canada with the STICS model 5 2 G. Jégo
6
Modelling the impact of soil and climatic variability on sugarcane growth response to mineral
and organic fertilisers 5 2 M. Chaput
Impact of corn root growth parameters on soil moisture, evapotranspiration and crop growth in
STICS model 5 2 E. Pattey (S. Saadi)
Impacts of observed and projected climatic constraints on rainfed wheat yield under a typical
Mediterranean condition 5 2 C. Yang
Coupling Sentinel-2 images and STICS crop model to map soil hydraulic properties 5 2 K. Lammoglia
10:50 - 11:10 Coffee break
11:10 - 12:30 Session 6: Regional and large scale simulations using STICS Chair: E. Pattey
Estimate demand for irrigation water and nitrogen fertilizers in Europe at different scales 15 5 PA Jayet
Regional-scale coupled modelling of water pollution by nitrate from agricultural sources: the
Seine-Normandy hydrosystem case study 15 5 N. Gallois
Simulating innovative cropping systems aiming at producing biomass while reducing greenhouse
gas emissions in the Hauts-de-France region 15 5 F. Ferchaud
New crop fertilization strategies after introduction of anaerobic digesters in a territory and their consequences on carbon and nitrogen dynamics in soils: case study of the Versailles plain
15 5 C.Launay
12:20 - 14:00 Lunch break (Agropolis International - Vanille room)
14:00 - 14:45 Session 7: Scenario simulations using STICS Chair: M. Launay
To maximize multiple ecosystem services without dis-service for water, the management of cover crops has to be climate and soil specific. A simulation approach using STICS model.
15 5 N. Meyer
Simulating soil organic carbon dynamics in long-term bare fallow and arable experiments with
STICS model 15 5 F. Ferchaud (H. Clivot)
Participative approach with STICS for evaluation of nitrogen management scenarios in organic
farming systems 5 2 N. Beaudoin
14:45 - 15:30
Invited conference: The “business” of developing and delivering a systems model – the APSIM
experience 30 10 PJ Thorburn
15:30 - 16:00 Concluding session: Conclusion and General discussion on STICS team governance 15 20
STICS team head: E. Justes, D. Ripoche, M. Launay and S. Buis
7
Content
Session 1: News from the last STICS workshop ... 9
Conceptual basis, formalisations and parameterization of the STICS crop model, second edition ... 9
The genesis of STICS v10 ... 11
SticsRpacks: a set of packages for managing Stics from R ... 13
Session 2: New formalisms and crop calibration for crop diagnosis ... 15
Development of a new formalism for the establishment of grain yield and protein for determinate growing plants in a dedicated research version of STICS ... 15
Assessment of the impact of water stress on soybean yield in Canada using STICS ... 18
Comparison of sugarcane STICS model calibrations to simulate growth response to climate variability ... 20
Use of the STICS model for simulating physiological and soil evolution in the Champagne vineyard under different scenarios ... 22
Session 3: Modelling intercropping with STICS ... 24
How to model crop-weed competition for soil resources: Connecting the STICS soil submodel to the FLORSYS weed dynamics model ... 24
Improving the intercropping version of the STICS model for simulating inter-specific competition 26 Calibration and Evaluation of the STICS Intercrop Model for Two Cereal-Legume Mixtures ... 28
Modelling the agronomic performance of millet-cowpea intercropping under the semi-arid environment of Senegal ... 30
Calibration and evaluation of the STICS soil-crop model for sorghum-cowpea intercrop in sub-Saharan Africa ... 32
Session 4: Methods and new tools for modelling with STICS ... 33
AgGlob: Workflow for simulation of agronomic models at a global scale ... 33
Preliminary coupling of STICS (v9.1) to PEcAn ecological informatics toolbox, and its comparison to BASGRA ... 35
A global optimization tool for assimilation of leaf area index into STICS crop model ... 37
STICS on SIWAA: A STICS Tool set deployed on the SIWAA Galaxy Web platform ... 39
A new method for sensitivity analysis of models with dynamic and/or spatial outputs ... 42
Session 5: Environmental impact of cropping systems and soil C&N dynamics ... 44
Verification and long-term simulations of STICS crop model to predict and analyze growing seasons N2O fluxes of spring wheat in eastern Canada ... 44
Modelling decomposition and N2O emissions of mulches varying in quantity and quality ... 46
Modelling short and long-term nitrogen and carbon budgets of agro-ecological cropping systems with a dedicated STICS research version ... 48
STICS ability to simulate long-term soil organic matter dynamics in crop-grassland rotations... 50
8 Modelling the impact of soil and climatic variability on sugarcane growth response to mineral and organic fertilisers ... 54 Impact of corn root growth parameters on soil moisture, evapotranspiration and crop growth in STICS model ... 55 Impacts of observed and projected climatic constraints on rainfed wheat yield under a typical Mediterranean condition ... 57 Session 6: Regional and large scale simulations using STICS ... 59 Estimate demand for irrigation water and nitrogen fertilizers in Europe at different scales ... 59 Regional-scale coupled modelling of water pollution by nitrate from agricultural sources: the Seine-Normandy hydrosystem case study ... 61 Simulating innovative cropping systems aiming at producing biomass while reducing greenhouse gas emissions in the Hauts-de-France region ... 64 New crop fertilization strategies after introduction of anaerobic digesters in a territory and their consequences on carbon and nitrogen dynamics in soils: case study of the Versailles plain. ... 66 Session 7: Scenario simulations using STICS ... 68 To maximize multiple ecosystem services without dis-service for water, the management of cover crops has to be climate and soil specific. A simulation approach using STICS model... 68 Simulating soil organic carbon dynamics in long-term bare fallow and arable experiments with STICS model ... 70 Participative approach with STICS for evaluation of nitrogen management scenarios in organic farming systems ... 72
9
Session 1: News from the last STICS workshop
Conceptual basis, formalisations and parameterization of the STICS crop model,
second edition
Beaudoin N.1, Ripoche D.2, Strullu L.3, Mary B.1, Launay M.2, Léonard J.1, Lecharpentier P.2, Affholder
F.4, Bertuzzi P.2, Buis S. 5, Casellas E.6, Constantin J.7, Dumont B.8, Durand J.L.9, Garcia de
Cortazar-Atauri I.2, Ferchaud F.1, Graux A.I. 10, Jego G.11, Le Bas C.12, Levavasseur F. 13, Louarn G.9, Mollier A. 14,
Ruget F.4, Justes E.5
1 INRAE AgroImpact, France - 2INRAE, US Agroclim, Avignon, France - 3ASAE, REIMS cedex, France -4
CIRAD, Montpellier, France - 5 INRAE UMR EMMAH Avignon - 6 INRAE MIAT RECORD Castanet-Tolosan,
France - 7 INRAE UMR AGIR Castanet-Tolosan, France - 8 Université de Liège Gembloux Agro-Bio Tech,
Belgique - 9 INRAE UR P3F Lusignan, France - 10 INRAE UMR PEGASE Rennes, France - 11 Agriculture et
Agroalimentaire Canada, Québec - 12INRAE US InfoSol Orleans, France - 13 INRAE UMR ECOSYS Grignon,
France - 14 INRAE UMR ISPA Bordeaux, France.
*nicolas.beaudoin@inra.fr
Keywords : deterministic model, cropping system, agro-ecology, environment, use, coupling.
Introduction
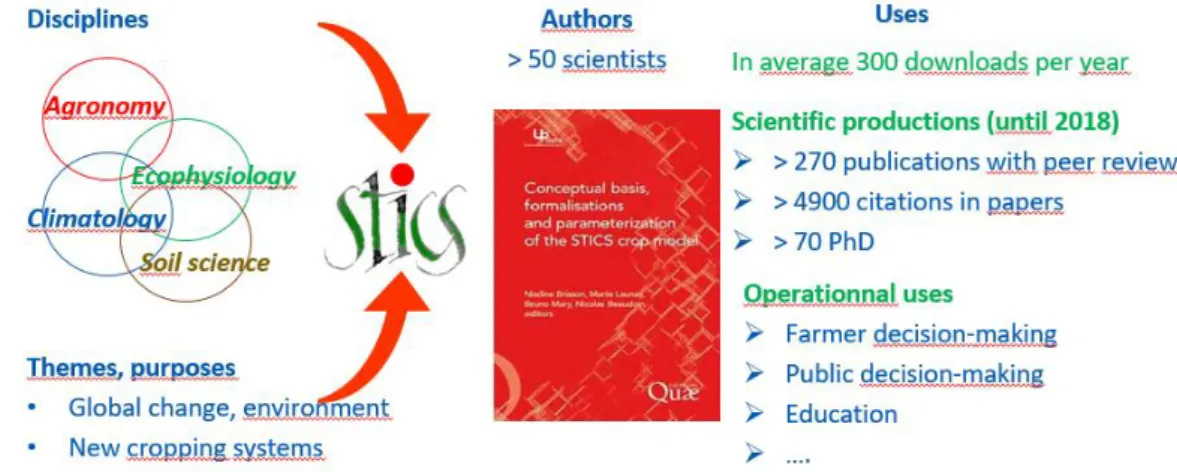
Since its creation in 1996, STICS has evolved to respond to emerging issues (Beaudoin et al., 2019). The need to make the formalisms of the model accessible to a large community of users has led to the publication of the book "Conceptual basis, formalizations and parameterization of the STICS crop model", under the guidance of Nadine Brisson. The draft of the so-called red book was presented to the STICS seminar in Reims in 2007, then the book was published by Quae Eds in early 2009. This book was original because it is the only existing publication concerning an international crop model that describes exhaustively the model formalisms and a rare synthesis of disciplines in the service of knowledge and action on cultivated fields (Figure 1).
.
Figure 1: Diagram of the crossing of disciplines and scientific and technical productions allowed by STICS . The limits of the 2009 edition lie in its paper format which does not allow a concomitant update to the evolution of the code. The challenge of the new project is to reinforce the dynamics of interaction between the evolution of the model, represented by the STICS Project Team (EPS), and the pluralistic community of users of STICS. The objective of the EPS is to propose a scalable version of the book
10 giving it the status of key and up to date reference, and giving to the use of the model, a potentially unlimited life.
Material and methods
The design logic of the book builds on the achievements of the previous one: - description of all the formalisms of the STICS model, with the interaction processes between, crop, soil, climate and crop management at the plot scale; -detail of the construction hypotheses and equations of the model, illustrated by graphs; - display of operational information.
The new edition will bring novelties of substance and form. It will present the new processes introduced since 2008 (N2O emission processes, snow module, nitrogen perennial reserve, root
turn-over, specificities of grassland … ). It will display intercropping processes over all the chapters, devote two chapters to helping user involvement and extending model capabilities for various applications (Table 1). Mathematical equations will be written in an academic way and can be directly tested via R Markdown to ensure reproducibility. A dematerialized edition will be available free of charge for each new version. Besides, there will be possible to print it on demand (with fees).
The project management is entrusted by the EPS to an editorial committee, which is composed of 6 members. On a technical level, the project has been submitted to QUAE Eds, who are interested in its dynamic and innovative character. The writing is organized in a modular way at the level of each chapter which is coordinated by 2 persons. It will rely on the 2009 writing and will seek new contributors, the list of which will be drawn at the chapter level. The writing is planned for the first semester 2020 for publication at the end of the year 2020.
Table 1: List of planned chapters and novelties. References
Beaudoin N., et al. (2019). Modélisation du fonctionnement des agro-écosystèmes: l’épopée STICS, in une agronomie pour le XXI siècle, Richard G., Stengel P., Lemaire G., Cellier P., Valceschini E cords, Quae Eds, pp 128-149.
Brisson N., Launay M., Mary B., Beaudoin N. (2009). Conceptual basis, formalisations and parameterization of the STICS crop model, Editions QUAE, INRA, Versailles.
11
The genesis of STICS v10
Loïc Strullu1, Nicolas Beaudoin1, Gaëtan Louarn2, Bruno Mary1 1 INRA UR AgroImpact, Laon, France
2 INRA UR P3F, Lusignan, France
Mots clés : plantes pérennes, flux de C et N dans les systèmes de culture, Keywords : perennial crops, C and N fluxes in cropping systems
Introduction
STICS model was initially developed to simulate crop yields, water and nitrogen fluxes in plants and soils. It was applied to annual crops and grasslands. Its main environmental goal was the protection of water resources. Recently, new challenges appeared concerning the carbon sequestration in agricultural soils, the emission of greenhouse gases and the production of renewable energy from biomass with dedicated perennial crops. This lead to new model developments allowing the simulation of new processes in diversified cropping systems including annual and perennial crops. Perennial differ from annual crops due to their ability to recycle C and N from one year to another. The slow and permanent turnover of their root system and perennial organs plays a key role for C and N recycling in soils. We have developed a new version (v10) of STICS model in order to simulate new processes and increase the genericity of the model under diversified cropping conditions.
Results
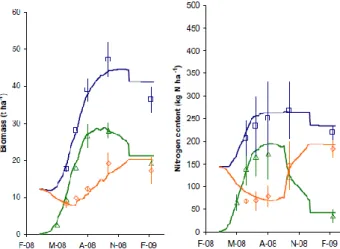
The model has been developed, parameterized and calibrated for three perennial crops (Miscanthus, Lucerne and Switchgrass) during 4 years in the research units AgroImpact (Laon) and P3F (Lusignan). This work was realized with the supervision of members of the EPS team thanks to a steering committee. The first step, consisted in the conceptualization of new formalisms to simulate C and N cycling in perennial crops and to improve the genericity of the STICS model. After the validation of the new formalisms allowing the simulation of C and N fluxes at the scale of the growing season (Figure 1; Strullu et al., 2014), we analyzed the model behaviour under long term simulations.
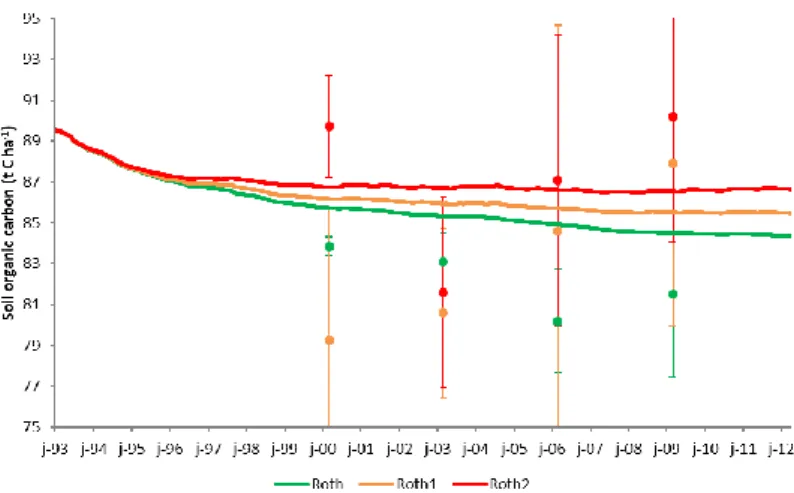
When we tried to realize the simulation of successive regrowth of a perennial crop on the long term, the model simulated both a decrease of soil organic carbon and nitrogen stocks and an accumulation of mineral nitrogen in the soil. These results were in contradiction with experimental observations and literature. After a review of the literature, we decided to implement the simulation of the turnover of root system and perennial organs in the model, allowing the simulation of C and N recycling in soils. The new research version was evaluated against long term experiments with independent data (Figure 2). The model was then used to realize a yield gap analysis to study the effect of water and N stresses on Miscanthus biomass production (Strullu et al., 2015).
Figure 1: Simulation of biomass and nitrogen fluxes in perennial organs (orange), aboveground organs (green) and aboveground + perennial organs (blue) of Miscanthus.
12 Figure 2: Simulation of soil organic carbon under Miscanthus on the long term at Rothamsted: comparison of 3 treatments. Roth: without N fertilization; Roth1: with 60 kg N ha-1 y-1; Roth 2: with 120 kg N ha-1 y-1.
The final step of this work consisted in evaluating the genericity of the model which was applied to other perennial crops like Switchgrass and Lucerne. We improved the genericity of the formalisms describing the C and N partitioning between organs by including structural and reserve compartments. Additional formalisms were required for simulation of Lucerne in order to take into account specificities concerning the effect of photoperiod on biomass and N partitioning (Figure 3; Strullu et al., 2020).
Figure 3: Simulated versus observed aboveground biomass (left) and its N concentration (right) at harvest in function of growing season. Sp = spring; Su = Summer; Au = autumn.
The detail of these new formalisms applied both to annual and perennial crops on the long term will be given in an updated version of the STICS red book (version v10) which will come out in 2020. Références bibliographiques
Strullu L., Beaudoin N., Garcia de Cortàzar Atauri I., Mary B. 2014. Simulation of biomass and nitrogen dynamics in perennial organs and shoots of Miscanthus × giganteus using the STICS model. Bioenerg. Res. DOI 10.1007/s12155-014-9462-4
Strullu L., Ferchaud F., Yates N., Shield I., Beaudoin N., Garcia de Cortàzar Atauri I., Besnard A., Mary B. 2015. Multisite yield gap analysis of
Miscanthus × giganteus using the STICS model. Bioenerg. Res. DOI 10.1007/s12155-015-9625-y
Strullu L., Beaudoin N., Thiébeau P., Julier B., Mary B., Ruget F., Ripoche D., Rakotovololona L., Mary B. 2020. Simulation using the STICS model of C&N dynamics in alfalfa from sowing to crop destruction. European Journal of Agronomy DOI 10.1016/j.eja.2019.125948
13
SticsRpacks: a set of packages for managing Stics from R
Samuel Buis1, Patrice Lecharpentier2, Rémi Vezy3, Michel Giner4
1 INRA, UMR EMMAH, Avignon, France, 2 INRA, US Agroclim, Avignon, France, 3 CIRAD, UMR AMAP,
Montpellier, France, 4 CIRAD, UPR AIDA, Montpellier, France
Keywords: R, model simulations, parameter estimation, uncertainty and sensitivity analysis Introduction
The SticsRpacks project has been initiated end 2018 to develop tools for piloting the STICS model via the high-level language R. These tools aim at:
- easily performing operations that are not provided in JavaSTICS: e.g. production of various graphs, statistical processing, link with databases ...,
- automating these operations using scripts,
- reducing the computation time required to perform simulations.
It is composed of a set of R packages. These packages are addressed to Stics users and developers and will be used in its automatic test and performance evaluation system (Buis et al. 2016). Methodological packages are developed in a generic way to be coupled with other crop models.
SticsRfiles, SticsOnR and CroptimizR
First versions of the packages SticsRfiles, SticsOnR and CroptimizR (Fig. 1) will be released for the Stics 2020 seminar. Other packages may be developed later (e.g. IdeSticsR).
Figure 1. Architecture of the SticsRpacks packages. ApsimOnR and SQonR are external packages / functions. Development of IdeSticsR package has not yet started.
They will include functions for:
- converting XML input files (JavaStics) into text input files (Stics) ; replacing (getting) parameters and option codes values in (from) XML and text files ; getting simulated and observed variables values from Stics output and observation files (SticsRfiles package)
- generating Stics input files from JavaStics working directory ; running Stics simulations from JavaStics or Stics input files with possible forcing of input parameters / option codes and parallelization of the simulations (SticsOnR package)
- multi-step parameter estimations with frequentist (multi-start Nelder-Meade simplex, Nelder and Mead (1965)) or bayesian (DREAM, Vrugt (2016)) methods, with possible simultaneous estimation of specific and varietal parameters on multi-varietal datasets (CroptimizR package)
Development tools
IdeSticsR
R interface to IDE-SticsSticsOnR
Simulation managementSticsRFiles
IO files managementCroptimizR
UA, SA, Parameter optimization
ApsimOnR, SQonR, …
14 SticsRpacks is a collaborative and opensource project. Source code versioning is handled in gitHub (https://github.com/SticsRPacks). A common coding style has been adopted. Automatic documentation is performed using Roxygen2. Websites are generated using pkgdown (see https://sticsrpacks.github.io/SticsOnR/, https://sticsrpacks.github.io/SticsRfiles/, https://sticsrpacks.github.io/CroptimizR/). User documentation is provided through function help and vignettes available on the packages websites. Automatic tests (including CRAN checks and unit tests) are performed using testthat and Travis.
Conclusion and perspectives
The development of the packages included in SticsRpacks just began. Other features are already planned and future versions should include additional functions for:
- downloading (uploading) USMs from (to) the IDE-Stics database (Beaudoin et al. 2015) - converting (Stics input) text files into (JavaStics input) XML files,
- generating new USMs by combining existing climate, soils, plant and management files, - analyzing crop models inputs and outputs (diagnosis, statistical criteria, graphics), including
comparison with observations,
- probabilistic uncertainty analysis (multiple distributions and sampling methods) and sensitivity analysis (screening, importance measures, Multivariate Sensitivity Analysis, graphical Sensitivity Analysis, methods for dependent factors),
- other parameter estimation methods (e.g. evolutionary algorithm, Hamiltonian MCMC) and objective function criteria / likelihoods,
- selection of parameters to estimate,
- taking into account prior information and constraints (e.g. inequality constraints) on estimated parameters and output variables,
- evaluating the predictive performance in parameter estimation process (cross validation …).
In addition to Stics, CroptimizR has already been coupled with ApsimX and SiriusQuality crop models. Its genericity will make it possible to evaluate multiple calibration approaches on different crop models and pool crop modelling team efforts to provide relevant methods for users of those models.
References
Buis, S., Coucheney, E., Launay, M., Lecharpentier, P., Mary, B., et al. (2016). Multicriteria evaluation of the stics soil-crop model and implementation of an automated evaluation system. iCROPM International Crop Modelling Symposium "Crop Modelling for Agriculture and Food Security under Global Change", Mar 2016, Berlin, Germany. 441 p.
Nelder, J. A. and Mead, R. (1965). A simplex method for function minimization, The Computer Journal 7, p. 308-313.
Vrugt, J. A. (2016). Markov chain Monte Carlo simulation using the DREAM software package: Theory, concepts, and MATLAB implementation. Environ. Model. Softw. , 75, 273-316.
Beaudoin, N. ; Armas-Herrera, C. ; Le Bas, C. ; Buis, S. ; Garcia De Cortazar Atauri, I. ; Ruget, F. ; Ripoche, D. ; Launay, M. (2015) Création de IDE-STICS (base de données intercontinentale pour l'évaluation de STICS). Xe séminaire des utilisateurs et concepteurs du modèle Stics Mar 2015, Rennes, France, France, 102p.
15
Session 2: New formalisms and crop calibration for crop diagnosis
Development of a new formalism for the establishment of grain yield and protein
for determinate growing plants in a dedicated research version of STICS
Chlebowski Florent1, Dumont Benjamin2, Vitte Guillaume3, Meurs Rémi4, Rosso Pablo5, Nendel Class5,Beaudoin Nicolas1
1 INRA, UR 1158 AgroImpact, Site de Laon, 180 rue Pierre-Gilles de Gennes, 02000 Barenton-Bugny, France 2 Gembloux Agro-Bio Tech – Université de Liège, 5030 Gembloux, Belgique
3 INRA, UR 1158 AgroImpact, Site d’Estrées-Mons, 80203, Péronne, France 4 Centre Pilote Céréales et Oléo-Protéagineux, 5030 Gembloux, Belgique
5 Leibniz Centre for Agricultural Landscape Research (ZALF), 15374 Müncheberg, Germany Keywords: grain yield, grain protein, formalism, sink/source, cereal crops
Introduction
The actual formalism of the STICS model (v9.1) for the prediction of grain yield, for determinate growing plants, consists in calculating a daily accumulation of biomass in grains by applying a progressive "harvest index" to the total biomass. This formalism brings a relative robustness in the yield prediction. According to the reference time unit used, it will give a higher weight to the use of carbohydrates produced after flowering (thermal time) or to remobilization (calendar time) for grain yield elaboration. This hinders the complexity and the dynamic of the different mechanisms that contribute to C accumulation in grain, especially within climate change context (Launay et al., 2010). Material and methods
In a dedicated research version of STICS, we developed a new formalism that aims to consider grains as a sink, following Launay et al. (2010). The formalism to predict grain number was kept as the one used for determinate growing plants in STICS (v9.1). We replaced the formalism of total yield elaboration, and the a posteriori computation of the weight of one grain, by the filling of individual grains. The daily growth function of each grain proposed here corresponds to the derivative function of grain biomass growth evolution according to thermal time (Robert et al., 1999).
The lone source of water-soluble carbohydrate (WSC) is the temporal reserves, which are feed by remobilizations and the addition of neoformed carbohydrates during the reproductive phase. Although temporal reserves are not explicitly located in STICS, we know that the WSC are transported from the source to the sink through the phloem (Lemoine et al., 2013). We have therefore linked the flow of transpiration, due to stoma present in the leaves and spikelets, to estimate a daily flux. Knowing there is a maximal WSC concentration in phloem, we then introduce a daily limitation in the WSC availability for grains. Finally, the N content in grains is linked to the Nitrogen Internal Efficiency (NIE) as mentioned by Gastal et al. (2015).
Three experimental sites devoted to varying crop species (s. barley, w. barley and w. wheat), with treatments differing by N application and irrigation in the same site-year, were studied. These three experimental sites are the SOERE ACBB “Grandes cultures” (Estrées-Mons, France), Gembloux (Belgium) and Münchebger (Germany). We only used simulations with good aboveground biomass estimation to validate our formalism, since in our dataset we have no measure of temporal reserves.
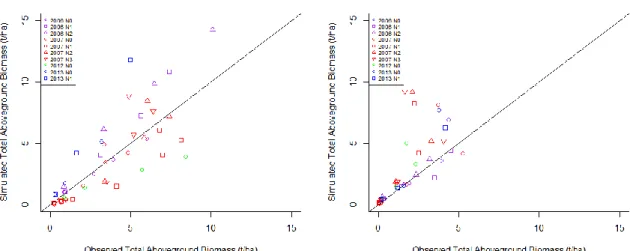
16 Results and discussion
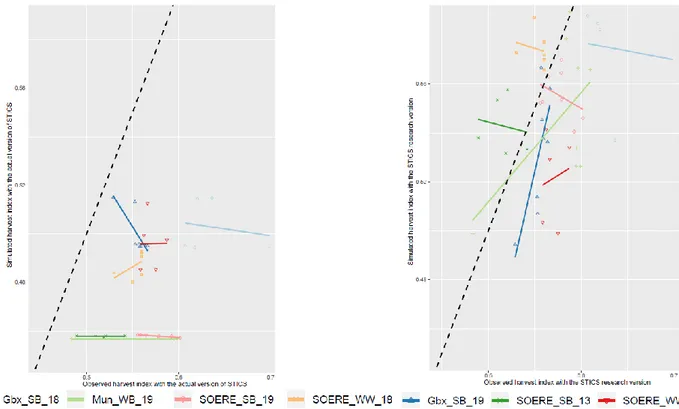
The comparison between model outputs shows a better prediction of grain yield and nitrogen content with the new formalism (Table 1). Focusing on the harvest index (HI) outputs between the actual formalism and the new one (Figure 1) shows a significant difference on either barley or wheat crops. The current formalism is not so robust since for a same year and a same site, the mean HI is underestimated and the variability of simulated HI is almost null. Using the new formalism improved both the performance of the mean prediction and a better account of the HI variability according to crop management. Especially, the new formalism was able to simulate the exceptional weather condition in 2018 with a high remobilization of neoformed carbohydrates during reproductive phase. Besides the performance of production criteria, this research version is expected to better predict the C:N ratio of crop residues, which strongly influences soil mineral N availability and humus storage.
Figure 1. Comparison of the observed (x axis) and the simulated (y axis) harvest index between the actual (left) formalism and the new one (right). Group of datasets from Gembloux (Gbx, Belgium), Müncheberg (Mun, Germany) and Estrées-Mons (SOERE, France). SB, WB & WW stand for s. barley, w. barley and w. wheat respectively. Numbers 13, 15, 18 & 19 are the harvest year. Lines represent linear regressions.
Table 1. Efficiency of the model with the actual formalism and the new one on some variables during crop cycle Aboveground biomass Aboveground N amount Grain yield Grain N amount
Actual formalism 0.83 0.49 0.33 0.15
New formalism 0.83 0.49 0.54 0.56
Acknowledgement: We thank the Barley-IT project, funded by the EIT Climate-KIC, and the experimenters for the datasets. We thank the SPW-DGO3 (Wallonie, Belgique) for its financial support to the CePiCOP actions’ and research program, which provided historic records for model evaluation.
17 Gastal F., Lemaire G., Durand J.-L., Louarn G. 2015. ‘Chapter 8 - Quantifying Crop Responses to Nitrogen and
Avenues to Improve Nitrogen-Use Efficiency’. In Crop Physiology (Second Edition), 161–206. San Diego: Academic Press. https://doi.org/10.1016/B978-0-12-417104-6.00008-X
Lemoine R. et al. 2013. ‘Source-to-Sink Transport of Sugar and Regulation by Environmental Factors’. Frontiers in Plant Science 4. https://doi.org/10.3389/fpls.2013.00272
Launay M., García de Cortázar-Atauri I., Guillaume S., Brisson N., Justes E., Gate P., Ruget F., Guerif M. 2010. Evaluation des formalismes du rendement des plantes déterminées. Cas du blé tendre et du blé dur. Séminaire STICS, 2010.
Robert N., Huet S., Hennequet C., Bouvier A. 1999. ‘Methodology for Choosing a Model for Wheat Kernel Growth’. Agronomie 19 (5): 405–17. https://doi.org/10.1051/agro:19990507
18
Assessment of the impact of water stress on soybean yield in Canada using STICS
Guillaume Jégo1, René Morissette1, Elizabeth Pattey2
1 Agriculture and Agri-Food Canada, Quebec City Research and Development Centre, Canada 2 Agriculture and Agri-Food Canada, Ottawa Research and Development Centre, Canada
Keywords: soybean, yield, water stress, evapotranspiration Introduction
In Canada, soybean is grown mainly in Ontario and Quebec, without irrigation (Statistics Canada, 2019). Within one production region, average annual yields can vary considerably from year to year (up to about 60% variation in some regions, FADQ 2019). Several biotic and abiotic factors may explain these interannual variations, but it is difficult to assess the extent to which each factor contributes to these variations. However, it is likely that the intensity and temporal distribution of precipitation plays a major role within the abiotic factors. The use of long climate series (> 30 years) is one way to better understand the effect of climate variations on the yield of crops such as soybean. Since little or no experimental data are generally available over such a long period, the use of a crop model calibrated and validated for the region of interest is a relevant solution for this type of approach.
The objectives of this work are to 1) verify the performance of the STICS model in simulating the water balance of a soybean field (soil water stock and evapotranspiration); and 2) use the verified model to evaluate the impact of water stress on yield losses.
Materials and methods
Prior to this work, 22 data sets from the Ottawa area (Canada) were used to calibrate and validate soybean phenology, growth and yield processes in the STICS model (v 9.0). Of these 22 datasets, four (years 1997, 1999, 2008 and 2016) included evapotranspiration and soil moisture measurements. These four datasets were therefore used to evaluate the model’s performance in simulating two of the main components of the water balance of an agricultural field during the growing season (Apr–Oct), cumulative evapotranspiration flux per 10-day period and temporal variation in soil moisture.
Once the model’s performance was verified, several series of simulations over long periods (50 years) were carried out. Four sites located in Ontario (ON) and Quebec (QC) with significant climate gradients were selected for the study: London (ON), Ottawa (ON), Saint-Hubert (QC) and Quebec City (QC) from the site with the longest growing season (212 days) to the one with the shortest season (183 days). For each of these sites, independent simulations (not successive) were carried out using the historical climate years from 1960 to 2009 (50 years) for the three main soil types in each region. Finally, in order to better assess the impact of water stress, simulations were carried out with or without irrigation. A total of 1,200 simulations were carried out (4 sites × 3 soils × 50 years × 2 irrigation practices). Simulated yields for the St-Hubert site without irrigation were compared to the yields measured by La Financière Agricole du Québec (FADQ) between 1995 and 2009 to verify the performance of the model in simulating the average yield of a region and its interannual variability. Then, the simulation results were analyzed by site and then by site/soil.
Results and discussion
The soil water stock (resmes variable) is generally well-simulated, with a normalized root mean square error (NRMSE) of about 15% and a very low bias (1%). Soil water distribution is also well simulated, with NRMSEs between 12.6% and 33.8%. The highest NRMSE was obtained for the top soil layer (0–
19 10 cm). For decadal evapotranspiration, the model’s performance was slightly worse, with a NRMSE of 35% for the 4 years combined. This lower performance of the model is particularly noticeable for 1999, with an overestimation of evapotranspiration (bias of 43.2%). For the other 3 years, the NRSME was close to or less than 30%, and the bias less than 20%. Overall, the model performance is therefore satisfactory, and it can be used to assess the impact of water stress on soybean yields.
The simulated average yield over the 1995–2009 period at the St-Hubert site is close to the average yield measured by the FADQ in this region (2.8 and 2.4 t ha-1, respectively). The model’s slight
overestimation can be explained by its inability to take biotic factors into account. However, the interannual variability seems to be well reproduced by the model, with predicted yields ranging from 2.1 to 3.2 t ha-1 and from 2.0 to 2.9 t ha-1 for the measurements. The comparison of treatments with
and without irrigation shows that on average water stress could reduce soybean yield by between 4.4% and 12.5%, depending on the site. The largest reductions are in Ottawa and St-Hubert (-8.5% and -12.5%, respectively), and the smallest are in London and Quebec (approximately -4.4%). As expected, the largest water stress yield reductions are simulated for the most sandy soils (sandy loam; yield reduction from -8.5% to -13.9%), since these soils have a lower available water capacity than loamy soils (loam, clay loam and silty clay loam). It should be noted that the impact of water stress seems very significant on the heavy clays of the St-Hubert region (-16.8%), which are also characterized by a relatively low available water capacity. Finally, the simulation results indicate that the interannual variability of yields due to water stress would represent about 28% of the total variability related to abiotic stresses taken into account by the model, with significant spatial disparities. Analysis of the standard deviation of simulated yields over 50 years indicates that water stress could represent nearly 45% to 48% of the variability in Ottawa and St-Hubert and only 8% to 13% in Quebec and London. For these two sites, temperature variations seem to be the cause of most of the interannual variability. Temperatures are often sub-optimal in Quebec City, and conversely there is a more significant frequency of days with temperatures above the optimum growth range in London, especially during the grain filling period.
Conclusion
The model was able to correctly reproduce two of the main components of the water balance of a soybean field in eastern Canada. Its use with long climate series on four sites and different soil types confirmed that water stress played a major role in the interannual variability of yields for two of the sites studied (Ottawa and St-Hubert). For the other two sites, most of the interannual variability in yields is probably explained by temperature.
References
La Financière agricole du Québec (FADQ), Assurance récolte – Rendements réels. Accessed Nov. 2019 https://www.fadq.qc.ca/statistiques/assurance-recolte/rendements-reels/ [French only] Statistics Canada, Census of Agriculture 2016. Accessed Nov. 2019.
20
Comparison of sugarcane STICS model calibrations to simulate growth response to
climate variability
Christina Mathias*1, Chaput Maxime1,2,3, Strullu Loïc4, Versini Antoine2, Soulié Jean-Christophe1,3 1CIRAD, UPR AIDA, F-97408, Saint-Denis, La Réunion, France, mathias.christina@cirad.fr
2CIRAD, UPR Recyclage et Risque, F-97408, Saint-Denis, La Réunion, France 3Université de la Réunion, Saint-Denis, La Réunion, France
4ASAE, 2 esplanade Roland Garros, Reims, France
Mots clés : canne à sucre, La Reunion, calibration, ICSM Keywords : Sugarcane, Reunion island, calibration, ICSM
Introduction:
The key role of crop models is to help understand and predict the effects and interactions between climate, soil, management, species facilitation and competition on crop development and yield. Several process-based sugarcane models have been developed, such as DSSAT-Canegro, Canesim, Mosicas, or APSIM-Sugar, which differ through the nature of input parameters and constituent process algorithms. Assuming that the choice of model should be questioned each time according to the desired application, we present here the calibration of a new growth model for sugar cane (STICS). This model is particularly suitable for studies on species associations or the agrosystem's response to the supply of organic matter residues.
In the present study, we present and compare three different calibrations of the sugarcane crop growth in STICS, each of which can be applied to a different situation and objectives:
Cane stalk conceptualized as a grain, in order to simulate sugar yield (STICS v9): “Sugarcane_grain”
Cane stalk conceptualized as a stem, in order to simulate fresh cane yield variability (STICS v9): “Sugarcane_stem”
Cane with perennial reserves, in order to simulate multiple regrowth (STICS vX): “Sugarcane_regrowth”
Methods:
The database used for calibration consisted in 8 trials performed in the ICSM projects. These trials, described in Jones et al. 2019, included 2 years of sugarcane monitoring in four countries (Reunion, South Africa, Zimbabwe and USA) and followed the same measurement protocols. Additionally, 6 trials performed in Reunion between 1994 and 1997, used for the initial sugarcane prototype calibration, were used.
In the present study, we choose to parameterized the sugarcane species using field measurements or measurements in the literature as a priority. In cases where this information was not available, the model parameters were calibrated. The calibration was performed using an R package (Rgenoud) with a genetic algorithm and a RRMSE like scored function. The trials available in the ECOFI database (Christina et al., 2019) were used as a set of validation. This database includes 95 trials (1988-2018) performed with the R570 variety in Reunion Island.
21 An illustration of STICS simulations on the ICSM trials is presented in Figure 1. All three calibrations (“Sugarcane_grain”, ”Sugarcane_stem” and “Sugarcane_regrowth”) satisfactorily simulated the leaf area index, and carbon allocation to aerial, leaf and stalk dry mass in the ECOFI trials. The “Sugarcane_grain” was currently the only one accurately simulating sugar yield in the cane stalk, but it failed to simulate fresh cane yield, which is an essential information for farmers and sugar industries. The “Sugarcane_stem” was the most accurate calibration to simulate fresh cane yield and thus should be applied to yield forecast studies. Finally, the “Sugarcane_regrowths” had strong potential, while simulating fresh cane yield and potentially sugar yield (still under development). Additionally, the possibility to simulate multiple regrowth with STICS vX could make it possible to assess the yield decline with ratoon age commonly observed by farmers as the evolution of soil organic matter in function of agricultural practices.
Perspectives
The potential applications of the STICS model for sugarcane simulations will be discussed with two focus on sugarcane / legume associations, and sugarcane response to organic residue applications. Références bibliographiques
Christina et al., 2019. ECOFI: a database of sugar and energy cane field trials. ODJAR, in press.
Jones et al., 2019. Exploring process-level genotypic and environmental effects on sugarcane yield using a international experimental dataset. Field Crop Research, 244 : 107622.
22
Use of the STICS model for simulating physiological and soil evolution in the
Champagne vineyard under different scenarios
Constance Demestihas1, Camille Dumortier1, Sébastien Debuisson1, Iñaki Garcia de Cortazar Atauri2 1 Comité Champagne, 5 rue Henri Martin, 51200 Epernay, France
2 INRA Avignon, Unité de Service 1116 AGROCLIM, 84914 Avignon, France
Keywords : vine, physiological balance, soil water and nitrate content, Champagne vineyards
Introduction
These last few years, the champagne vineyard appears as a real case study for the evolution of nitrogen and water availability. In fact, among other nitrogen stress indicators, the must nitrogen has been decreasing since the 2000s. The combination of restricted mineral fertilizers and herbicide use, the growing variability of spring rainfall, the increasing thermal stress as well as the soil type heterogeneity are only a few underlying factors that trigger loss of physiological balance in the vineyards. The use of crop modelling approaches in order to accurately follow the nitrogen, carbon and water cycles within the vine and the soil, especially for future scenarios, appears necessary. The first part of the study consists in validating the STICS model parameterization for vine (Garcia de Cortázar-Atauri, 2006) under the Champagne vineyard conditions. The second part formalizes the use of the STICS model for the Champagne industry.
Materials and Methods
The STICS model v9 was used in this study. Two dataset were mobilized for this study. The first dataset was obtained using the “réseau vigueur” which is a network of 6 plots representing champagne’s vineyards variability in terms of soil, climate and viticultural practices. A large set of physiological and soil measures are operated since 2017. The second is a historical database on the experimental station of the Comité Champagne in Plumecoq which provides leaf water potential and leaf area data. The validation and parameter optimization processes were operated using the EvalR and Optimistics tools of the STICS interface, in a specific non-interchangeable order: first on soil and then on physiology parameters, mostly water in fruits. The simulations were validated at each step with observed data using mostly the root mean square error.
Results and perspectives
Optimization of 5 parameters and validation of the model in the Champagne vineyards
Observed and simulated leaf water potential at Plumecoq showed at first a very high RMSE as the subsoil chalk, not considered by the model, positively impacted the vine water status. We therefore modelized this chalk by adding two hypothetical horizons with a wilting point at 25% and a field capacity at 40%. We then optimized, under this chalk subsoil context, 4 soil parameters: pebbles (cailloux), soil humidity at field capacity (HCCF), initial root density (densinitial) and the depth of root obstruction (obstarac), enabling to reach lower RMSE for leaf water potential and leaf area.
The next step consisted in optimizing the harvest date, thus the yield simulation, through water status in fruits with two parameters: H2Ograinmax (maximum water content in berries at harvest) drawn out of brix degrees values at harvest and deshydbase (phenological rate of evolution of fruit water) which was optimized on Pinot Noir variety, using the observed harvest dates. The harvest dates RMSE decreased a lot, the leaf area index appeared very well simulated with an RMSE of 0.66, but the yield simulation remained unsatisfactory (RMSE of 1.25) impacting the aboveground nitrogen content as well (RMSE of 23.49) (fig.1).
23 Figure 1: Comparison of simulated and observed data for leaf area (lai), aboveground biomass (masec), yield (mafruit) and aboveground nitrogen content (qnplante) on the “réseau vigueur” database in 2018 and 2019 on 42 unit simulation model
(USM). The use of the STICS model in Champagne
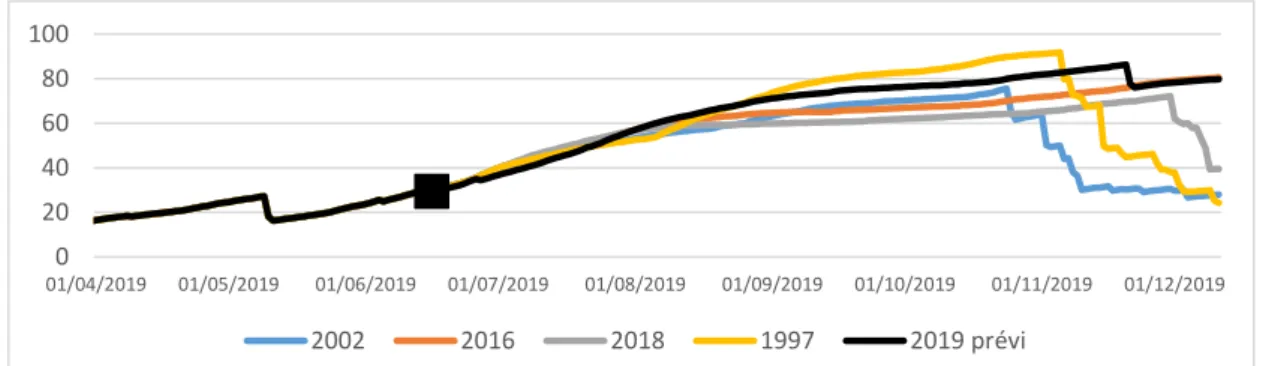
Predictive climate scenarios for 2019 were created from the 15th of June and onwards in a given type
of soil (fig. 2). Decadal mean climatic data (‘2019 prévi’) was compared to past climatically “extreme” vintages (1997, 2002, 2016 and 2018) in order to see the range of values the nitrate content in soil could reach as well as the period of nitrate retention in the first 30 cm during autumn, a crucial timing for vine reserve storage.
The use of the STICS model in the champagne vineyards is not to predict yields or harvest dates but rather to foresee the evolution of some important soil and vine indicators impacting the vine physiological balance yearly and through hypothetical future scenarios. The perspective of a web intranet portal is explored by the Comité Champagne providing information about leaf area, phenology, soil water and nitrate status using Champagne’s meteorological station network and soil typology.
Figure 2: Nitrates dynamic simulated by the STICS model, in kg/ha within the first 30 cm of soil. References
Garcia De Cortázar-Atauri, I., 2006. Adaptation du modèle STICS à la vigne (Vitis Vinifera L.). Utilisation dans le cadre d’une étude d’impact du changement climatique à l’échelle de la France. 0 20 40 60 80 100 01/04/2019 01/05/2019 01/06/2019 01/07/2019 01/08/2019 01/09/2019 01/10/2019 01/11/2019 01/12/2019 2002 2016 2018 1997 2019 prévi
24
Session 3: Modelling intercropping with STICS
How to model crop-weed competition for soil resources:
Connecting the STICS soil submodel to the F
LORS
YSweed dynamics model
Nathalie Colbach1, Nicolas Beaudoin2, Sébastien Guyot1, Jean Villerd1, Delphine Moreau1 1 Agroécologie, AgroSup Dijon, INRA, Univ. Bourgogne, Univ. Bourgogne Franche-Comté, F-21000 Dijon 2 Agroimpact, INRA, F-02000 LaonKeywords : weed, competition, nitrogen, water, cropping system, multicriteria evaluation, crop diversification
Introduction
Weeds are harmful for crop production but essential for biodiversity. Process-based weed dynamics models are crucial to synthesize knowledge on weed dynamics and crop-weed interactions, apply this knowledge to cropping-system design and transfer it to stakeholders. Such models can also help to analyse the effects of crop diversification (longer rotation with more species, cover crops, crop mixtures) which crucial for agroecological crop production. Indeed, the processes driving crop-weed interactions are the same for crop-crop interactions in crop mixtures and crop rotations. Plant-plant competition for soil resources plays a key role in these interactions. This paper illustrates how we connected the soil submodel of STICS (Brisson et al., 2009) to provide soil-resource inputs for the weed dynamics model FLORSYS and then how we used the resulting "model complex" for simulations.
Connecting the STICS soil submodel to the weed dynamics model
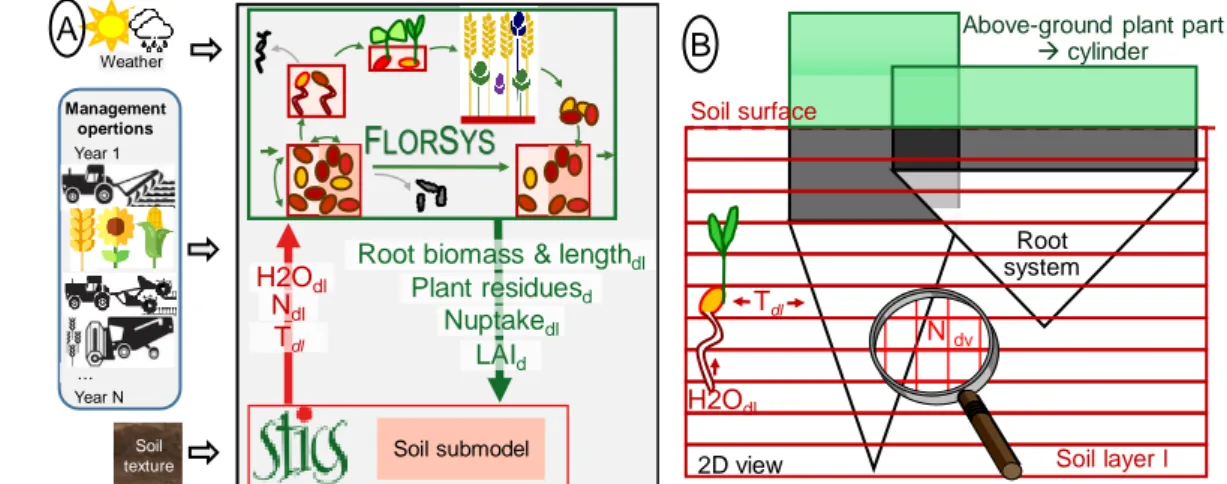
FLORSYSFLORSYS (Colbach et al., 2014; Colbach et al., in revision) is a virtual field for which the user enters a list of cultural operations lasting for several years (crop succession including cover crops and crop mixtures, all management techniques), together with daily weather, soil properties and a regional weed species pool (Figure 1). These inputs drive the biophysical processes in the field at a daily time step, with a 3D individual-based representation of the canopy. FLORSYS focuses on processes leading to (1) plant emergence and establishment of crop and weed species with diverse ecological requirements (which allows for crops sown in different seasons and in mixtures where timing determines the fate of a species); (2) the functioning of heterogeneous crop-weed canopies including diverse plant ages, morphologies and shade responses (as in crop mixtures); (3) carryover effects in terms of, e.g., weed seed bank, soil organic matter or water content on future cropping seasons (which is crucial for crop rotations). The detailed biophysical model outputs are aggregated into indicators of crop production and weed (dis)services to easily compare cropping systems. Figure 1 illustrates how this model was connected to the STICS soil submodel. The source code of the two models remains sufficiently separate to allow easily connecting future versions of STICS to FLORSYS.
Evaluation and design of multi-performant cropping systems with simulations
First, we simulated virtual farm-field networks based on farm surveys from different regions and stakeholders to identify weed-suppressive crop ideotypes and cropping-system types that reconcile low yield loss with low herbicide use. The simulations showed that, compared to crop species with a high yield loss due to weeds, low-loss crops present a larger plant width per unit biomass in unshaded conditions, thinner leaves to increase leaf area, chiefly from flowering onwards, and etiolate when
25 shaded by neighbour plants, with taller plants per unit plant biomass and even thinner larger leaves. Three "winning" cropping-system types were identified: maize monocultures and 2 types with diverse rotations (different species, both winter and summer crops, intercropping, temporary grassland) and/or crop mixtures, combined with well-reasoned tillage (stale seed bed, occasional ploughing). FLORSYS was also used to assess cropping systems designed by scientists or farmers in workshops. Farmers appreciated the model's ability to (1) predict weed (dis)services over several years, (2) determine probabilities of success or failure of innovative strategies as a function of past field history and weather scenarios, (3) identify biophysical explanations of cropping system performance, (4) fine-tune cropping systems to local conditions. The workshops led to major take-home messages on agroecological weed management for farmers, e.g., assess crops at the rotation scale, weather and inadequate crop management can cancel out the effects of beneficial techniques, weed floras do not disappear but change…
Figure 3. Connecting the STICS soil submodel to the 3D individual-based FLORSYS weed dynamics model. A. Each day d, STICS provides water potential, nitrogen availability and temperature for each soil layer l. These drive seed and plant processes in FLORSYS, together with weather and cropping-system inputs. FLORSYS returns canopy information to STICS to calculate soil variables for the next day. B. In FLORSYS, soil temperature and water potential drive seed germination and pre-emergent growth, soil temperature drives root-system growth. Available nitrogen is distributed inside soil voxels (3D pixels) in each soil layer and extracted by the roots inside each voxel.
Conclusion
This study showed how a STICS submodel was connected to a 3D individual-based multiannual weed dynamics model. The resulting "model complex" can simulate contrasting cropping systems with different soils, weather scenarios and weed floras. This is essential to establish rules for weed management depending on the production situation and cropping system.
Funding:INRA, CoSAC (ANR-15-CE18-0007), EU H2020 ReMIX (N 727217) and IWMPRAISE (N 727321), Casdar RAID funded by the French Ministry in charge of Agriculture and Food.
References
Brisson N., Launay M., Mary B. & Beaudoin N. (2009) Conceptual basis, formalisations and parameterization of the STICS crop model. éditions Quae
Colbach N., Biju-Duval L., Gardarin A., Granger S., Guyot S. H. M., Mézière D., Munier-Jolain N. M. & Petit S. (2014) The role of models for multicriteria evaluation and multiobjective design of cropping systems for managing weeds. Weed Research 54:541–555.
Colbach N., Colas F., Cordeau S., Maillot T., Moreau D., Queyrel W. & Villerd J. (in revision) The FLORSYS crop-weed canopy model as a tool to optimise crop diversification European Journal of Agronomy.
Tdl Ndl H2Odl Management opertions Year 1 … Year N Weather Soil texture
F
LORS
YS Soil submodel LAId Nuptakedl Root biomass & lengthdlPlant residuesd A Soil layer l B Soil surface Tdl N dv H2Odl
Above-ground plant part cylinder
Root system
26
Improving the intercropping version of the STICS model for simulating inter-specific
competition
Rémi Vezy 1,2,3*, Sebastian Munz4, Noémie Gaudio5, Marie Launay6, Kirsten Paff1,2, Patrice
Lecharpentier6, Dominique Ripoche6, Eric Justes,2,7
1 SYSTEM, Univ Montpellier, CIRAD, INRA, IRD, Montpellier SupAgro, Montpellier, France 2 INRA, UMR SYSTEM, Montpellier, France
3 Current address: CIRAD, UMR AMAP, F-34398 Montpellier, France. remi.vezy@cirad.fr 4 Institute of Crop Science, University of Hohenheim, Stuttgart, Germany
5 Univ. Toulouse, INRAE, UMR AGIR, F-31320, Castanet-Tolosan, France 6 INRA, US1116 AgroClim, Avignon, France
7 CIRAD, Persyst department, Montpellier, France
Keywords : soil-crop model; wheat; pea; interspecific competition; intercropping; ecological intensification
Introduction
The STICS model has been previously adapted to simulate crops grown in bi-specific mixtures (Brisson et al., 2004; Launay et al., 2009), but the model evaluation showed inconsistencies regarding light interception, plant height, frost damage and leaf senescence for intercrops as partly already identified by Corre-Hellou et al. (2009). The main objective of our work was to update the intercrop version of STICS by fixing code issues and by adding new formalisms to integrate a computation of plant height and a new formalism of the equivalent plant density to better represent the competition between the two crops. A second objective was to evaluate the relevance of these changes compared to the previous version using a comprehensive dataset of field measurements.
Materials and Methods
The new computation of plant height uses an allometric equation from the aboveground biomass that enhances the range of possible relationships while being robust and parameter scarce. A new option was included for the equivalent plant density, a concept first included by Brisson et al. (2004) to consider the interspecific competition between two species. The code of the model was also revised to remove some bugs, mainly for the computation of frost damage and leaf senescence, that were found for the intercrop version. The model STICS was then evaluated using observations from durum wheat and winter pea grown either in sole crop or bi-specific intercrop in Auzeville (France) for three years in 2007, 2010 and 2011. The new parameters were calibrated using the sole crop data, except those only used for intercropping, for which two parameters were calibrated using data of intercrops. Then, the simulated leaf area index (LAI), aboveground biomass and plant height were compared to measurements at different growth stages for each species, either in the two sole crops or in intercrop, in order to evaluate the improvement with respect to the previous model version.
Results and discussion
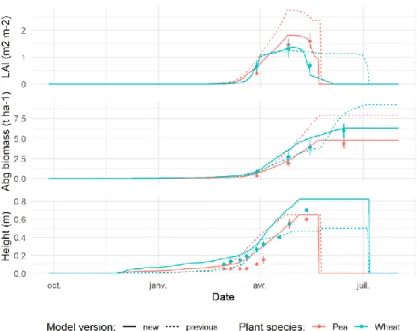
The simulations from the new STICS-intercrop version were closer to the observations compared with the previous version of the model for the targeted output variables, i.e. LAI, aboveground biomass and plant height for the three wheat-pea intercrop experiments (Fig. 1). The RMSE was lower by 15.8 % on average for the two species and the three variables, and the model efficiency increased from -0.27 to 0.53 showing that the new formalisms improved the simulation of the intercropping system. The model is currently being tested more extensively using different N-treatments, species and pedoclimates to define its validity domain, with preliminary results presented in Paff et al. (2020). A
27 new R package that uses the STICS intercrop version was designed and used to perform simulations and analysis (Vezy et al., 2019). See the SticsRPacks project for more information (Buis et al., 2020). Conclusion
New formalisms were implemented in the STICS-intercrop version to model bi-specific intercrops with a relatively simple conceptual approach simulating competition for light capture between two intercropped species. The new version successfully simulated LAI, aboveground biomass and plant height for both wheat and pea grown either in sole- or in intercropping.
Acknowledgements
This work was funded by the ReMIX project, a EU's Horizon 2020 Program.
Figure 4. Simulated (lines) and observed (symbols) leaf area index (LAI), aboveground biomass, and plant height for pea (red) and wheat (blue) grown in mixture simulated with the previous (straight) and new (dotted) STICS-intercrop version. References
Brisson, N., Bussière, F., Ozier-Lafontaine, H., Tournebize, R. and Sinoquet, H., 2004. Adaptation of the crop model STICS to intercropping. Theoretical basis and parameterisation. Agronomie, 24(6-7): 409-421. Buis, S., Lecharpentier, P., Vezy, R. and Giner, M., 2020. SticsRpacks: a set of packages for managing Stics from
R, STICS model workshop - side-event of ICROPM, Montpellier.
Corre-Hellou, G., Faure, M., Launay, M., Brisson, N. and Crozat, Y., 2009. Adaptation of the STICS intercrop model to simulate crop growth and N accumulation in pea–barley intercrops. Field Crops Research, 113(1): 72-81.
Launay, M. et al., 2009. Exploring options for managing strategies for pea–barley intercropping using a modeling approach. European Journal of Agronomy, 31(2): 85-98.
Paff, K. et al., 2020. Calibration and Evaluation of the STICS Intercrop Model for Two Cereal-Legume Mixtures, ICROPM, , 3-5 February 2020, Montpellier.
Vezy, R., 2019. VEZY/sticRs: Parameter optimization (Version 1.1.0). Zenodo. http://doi.org/10.5281/zenodo.3233968
28
Calibration and Evaluation of the STICS Intercrop Model for Two Cereal-Legume
Mixtures
Kirsten Paff1,2, Sebastian Munz3, Rémi Vezy4, Noémie Gaudio5, Laurent Bedoussac5, Éric Justes1,2,6 1INRA, UMR SYSTEM, F-34398 Montpellier, France, email: kirsten.paff@inra.fr
2SYSTEM, Univ Montpellier, CIRAD, INRA, IRD, Montpellier SupAgro, Montpellier, France 3Institute of Crop Science, University of Hohenheim, 70599 Stuttgart, Germany
4 CIRAD, UMR AMAP, F-34398 Montpellier, France 5 INRA, UMR AGIR, 31326 Castanet-Tolosan, France 6 CIRAD, PERSYST Department, 34398 Montpellier, France
Mots clés : Intensification écologique ; modèle de culture ; Pois ; Orge ; Blé dur Introduction
STICS is a soil-crop model capable of simulating crops in succession (Brisson et al., 2003).
Intercropping occurs when multiple species are grown simultaneously on the same field. There has been a growing interest in adapting this traditional technique for modern agriculture as a way of ecological intensification, especially for combining leguminous and cereal crops in order to reduce N inputs and potential environmental damage through N losses. Intercropping adds complexity to the system by adding inter-species competition. Crop models are useful tools for analyzing complex systems, as they allow the user far more control over individual variables than is possible in field experiments. A first version of the STICS intercrop model was created by Brisson et al. (2004) and was recently improved by Vezy et al. (2020). The aim of this study was to calibrate and evaluate this improved STICS-Intercrop model by simulating a winter and a spring intercrop mixture: durum wheat-winter pea and barley-spring pea.
Materials and Methods
The data set used for modelling comprised of four years of wheat (Triticum turgidum L.) and pea (Pisum sativum L.) field data from Auzeville, France with multiple levels of nitrogen fertilizer, and four years of barley (Hordeum vulgare L.) and pea field data from Angers, France (Corre-Hellou, 2005), which in some years included two levels of nitrogen fertilizer and two different plant densities of the intercrops. The sole crop trials were used for calibration and the intercrop trials for evaluation, except for a subset of intercrop data that was used to calibrate the parameters unique to the intercrop model. The assumption was that parameters common to both sole and intercropping, such as plant-soil interactions and phenology, would be the same for both. The optimization method used for calibration was based on Wallach et al. (2011). The parameters were broken down into 15 groups (16 for pea to include nitrogen fixation) for calibration, each corresponding to a different process.
Results and Discussion
The root mean square error (RMSE) for shoot biomass was 1.92 t/ha for winter pea and 1.37 t/ha for durum wheat. The RMSE for grain yield was 1.84 t/ha for spring pea and 1.15 t/ha for barley. Overall the model captured the dominancy of one species quite well, however the accuracy has to be increased. The phenology and height were correctly simulated. Some of the discrepancies could be due to biological stresses that STICS does not capture. The modelling efficiency is likely to improve because the model calibration process is still ongoing, especially for the pea-wheat simulations. Conclusions
The intercrop version of the STICS model was recently improved. An automatic calibration was performed in this study using two different crop mixtures, several years and multiple nitrogen