Remote Sensed Land Surface Temperature Anomalies
for Earthquake Prediction
Mebrouk Bellaoui
1,2,a*, Abdelatif Hassini
3, Kada Bouchouicha
1,21Laboratoire d’Analyse et d’Application des Rayonnements (LAAR), Département de Génie
Physique, Faculté de Physique, Université des Sciences et de la Technologie d’Oran Mohamed Boudiaf (USTOMB), B.P. 1505, El-MNaouar, Oran, 31000, Algeria
2Unité de Recherche en Energies Renouvelables en Milieu Saharien, URER-MS, Centre de
Développement des Energies Renouvelables, CDER, 01000 Adrar, Algeria
3Institut de Maintenance et Sécurité Industrielle, Laboratoire LISDD, Université d’Oran 2 Mohamed
Ben Ahmed, Oran, Algeria
Keywords: Thermal anomaly; Earthquake; RST; MODIS satellite data; LST; Ambient temperature
Abstract. Thermal anomaly Detection prior to earthquake events has been widely confirmed by
researchers over the past decade. In this paper, we use robust satellite technique approach (RST) on a collection of six years of MODIS satellite data, representing land surface temperature (LST) images to predict 21st May 2003 Boumerdes Algeria earthquake. The thermal anomalies results were compared with the ambient temperature variation measured in three meteorological stations of Algerian National Office of Meteorology (ONM) (DELLYS-AFIR, TIZI-OUZOU, and DAR-EL-BEIDA). The results confirm the importance of robust satellite technique as an approach highly effective for prediction and monitoring the earthquakes.
Introduction
Earthquake prediction is an area of intense scientific research; there have been many geophysical and geochemical phenomena that can be considered by the scientists as an earthquake precursor.
The current situation in earthquake space research assumes that this disastrous natural phenomenon highly correlates to Earth’s deformation, surface temperature growth, gas and aerosol exhalation, and electromagnetic disturbances in the ionosphere [1].
The available measurements of temperature and the applicability of remote sensing in monitoring temperature changes have increased the potential of their use as a precursor.
Using thermal detection to predict earthquakes was first proposed by the scientists in the early eighties. The uses of satellite thermal Infrared measurements as earthquake predictors have been proposed. The correlations between solid Earth processes and atmosphere/ocean Dynamics prior to strong earthquakes was evident, specifically for a thermal anomaly LST pattern that is apparently related to pre-seismic activity [2].
Many attempts to define the thermal anomaly and detect the pre-seismic anomalous thermal infrared signal were made. The connection of thermal fluctuations and seismic activity is not official and possible connection associated to other causes (metrological, observational), [3–5].
AVHRR (Advanced Very High Resolution Radiometer located on board NOAA satellite) data used first to study the relationships between soil surface temperature increase “anomalies” and earthquake occurrence. After, many studies have been done, using variations types of Geo-Stationary and Polar Satellites data. [6], using METEOSAT TIR satellite data, began to study several earthquake occurred in China. Tronin et al. In [7,8] analysing a sequence of AVHRR TIR data, identifying the presence of positive pre-seismic TIR anomalies. Huang et al., using thermal infrared data provided by MODIS sensor studied the relation between thermal anomalies and seismic activity around the epicentre of the Sichuan (China) earthquake (occurred on May 12, 2008: MS~8.0) [9]. The results showed that the temperature became higher 3-5 degree prior to the earthquake and the anomaly disappeared after the earthquake.
All rights reserved. No part of contents of this paper may be reproduced or transmitted in any form or by any means without the written permission of Trans Tech Publications, www.ttp.net. (#94163086, University of Michigan Library, Media Union Library, Ann Arbor, USA-09/07/17,10:58:12)
Remote sensing methods are widely used for investigations in seismo-active regions, principally through the application of satellite imagery of the Earth's surface in the visible- and near-infrared (IR) part of the spectrum with high spatial resolution [10-14].
The RST approach proposed by Tramutoli et al. (1998) is described to identify space-time signal. A statistical definition of thermal infrared anomaly is given and proposed as a suitable tool for satellite thermal infrared surveys in seismically active regions [5]. This approach was used by a number of researchers to study the existence of space-time anomalies before the seismic events; RST was successfully applied for several earthquakes, in all continents of the world. 6th April 2009 Abruzzo earthquake (Italy) [15], 20 September 1999 Chi-Chi earthquake (Taiwan) [16]. RST applications have been already successfully implemented by using validation/confutation approach, dedicated to determine existence of thermal infrared anomaly.
Many seismic events which have been studied by applying the RST approach. Firstly, Tramutoli in the case of Irpinia-Basilicata earthquake (Novembre 23, 1980:M ~6.9) applied robust satellite technique with NOAA AVHRR Data. In the case of the Athens earthquake (septembre 7, 1999), [17] demonstrated the possibility to reach S/N ratios up to 1.5 by using daily analysis. Corrado et al. established the relation between TIR anomalies and earthquake of medium-low intensity occurred in Greece and Turkey [18]. The connection between thermal anomaly and earthquake was confirmed in several applications [5 ,15, 16 ,19 , 20] .
Algeria is a North African country situated in a seismically active region; there are eventually/in average five of moderately severe earthquake every year. The most severe earthquake occured in recent twenty years was the Boumerdes earthquake of May 21st, 2003 (M=6.8). That disastrous event resulted in more than 2266 casualties. In addition, 10261 people injured and 200000 left homeless. The Reports indicate that more than 1243 buildings were completely or partially destroyed. Infrastructures were predictably damaged in Algiers, Boumerdes, réghaia and Thénia .
This event is addressed in [21] with METEOSAT Data. In this paper, we apply the Robust satellite technique method to EOS MODIS (Moderate Resolution Imaging Spectroradiometer) data around the epicentre of Boumerdes earthquake in Algeria, in order to study the existence of thermal anomaly before the earthquake occurrence, and the connection with the seismic events. MODIS satellite data is characterized with its low spatial resolution (1 km), and MODIS products are all archived and available.
In this work, Six years (from 2000 to 2005) of daily MODIS land surface temperature have been analysed and pre-processed. In order to characterize the thermal infrared signal behaviour, the results will be discussed and completed with analysis of the variations of air temperature measurements of three stations around the epicentre of earthquake of 21st May 2003 Boumerdes (Algeria).
Materials and Methods
1.1 Study area
Geographical location of the study area and sites considered in this study are presented in Figure (1).
Fig. 1. Location of the main-shock epicentre and meteorological stations
1.2 Data
Our study uses two kinds of data: (i) Satellite data is obtained from MODIS satellite, and (ii) Observed data which consists of ambienttemperature.
2.2.1 Satellite data
MODIS data for this work mainly comes from the website of NASA (http://earthexplorer.usgs.gov), MODIS image space resolution is 1 km x 1 km.
Compared to other available data, the advantages of using MODIS data can be summarized as follows:
- A high spectral resolution
- MODIS sensor have a set of internal calibration and radiometric calibration sensor (http://modis-sr.ltdri.org).
- The geometric and atmospheric corrections performed to high precision for this product - These data are available through the Land Processes Distributed Active Archive Center (LP
DAAC) of NASA.
The product is tile-based and grid in the sinusoidal projection (ISIN) of Integerized which provides daily values of temperature and emissivity by-pixel to the spatial resolution of 1km (The exact grid size at 1km spatial resolution is 0.928km by 0.928km) [22]. This product requires further pre-processing before they can be used in the sequel: Reprojection and mosaicking, quality assessment and extracting LST data. See Fig. 2.
Fig. 2. Diagram of the preprocessing steps: calculate LST image from MODIS HDF image [23]
We covered thought this research the event of 2003 Boumerdes Earthquake (Magnitude Mw= 6.8) occurred on May 21 at 19:44:21 local time in northern Algeria. It having its epicentre at 3.71 E 36.90 N. We used daily night time LST (Land surface temperature) data for all north of Africa region, for the period (2000-2005), extracted from the 1 km spatial resolution gridded v.4 MOD11A1 LST product.
The tile is labelled from top to bottom and from left to right starting at 00. A tile contains 1200 x 1200 grids. Two tile (h17v05 and h18v05) neighbours are mosaiced together in order to study all the north of Algeria. Example of LST data used is represented in Fig. 3.
Fig. 3. LST image 30/06/2015 Algeria east tile (a) and west tile (b)
2.2.2 Observed Data
In order to study the connection between thermal anomaly and ambient temperature variations, the
air temperature derived from meteorological stations around the earthquake epicentre has been taken into account.
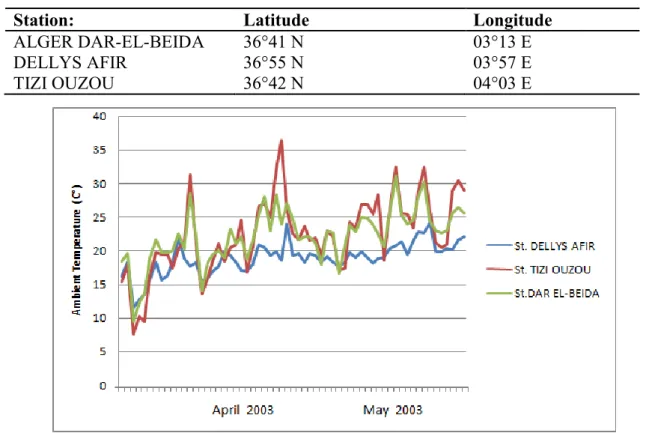
Fig. 4, shows ambient temperature measurement of three meteorological stations (DELLYS AFIR, TIZI OUZOU, and ALGER DAR-EL-BEIDA) around earthquake epicentre (longitude 03.71, latitude 36.90) (Table 1).
Table 1. Meteorological stations around Boumerdes earthquake epicentre
Station: Latitude Longitude
ALGER DAR-EL-BEIDA 36°41 N 03°13 E
DELLYS AFIR 36°55 N 03°57 E
TIZI OUZOU 36°42 N 04°03 E
Fig. 4. Ambient temperature measurement variations of three meteorological stations 3. Methodology
3.1 Thermal anomaly definition
The Thermal infrared radiance is computed from satellite data using four parameters as follows [5]:
( ) [ ( ) ( ) ( ) ( )] (1)
Where,
( ) Is Spectral emissivity, and ( ) is Spectral transmittance, and ( ) is Surface
temperature, and ( ) is Satellite zenithal angle.
3.2 Robust satellite technique (RST)
RST technique is an approach based on Robust AVHRR Technique (RAT), was first proposed by [24] and used for monitoring the environmental disasters like volcanoes, floods, forest fires and seismic activities. Due to its simplicity and efficiency, this approach knew wide acceptance from the community. It has been used to detect thermal anomaly before earthquake by [5,15, 16, 20, 21 25].
The RAT (Robust AVHRR Technique) approach is an automatic change-detection scheme that identifies signal anomalies in the space-time domain as deviations from a normal state that has been preliminarily identified (and usually given in terms of time average and standard deviation) on the basis of satellite observations collected during several years, under similar observational conditions for each image pixel [26]. The RST approach is based on a multi-temporal analysis of historical data set of satellite observations acquired in similar observational conditions (e.g., same month of the year, same hour of the day, same sensor, etc.) [20].
Anomalous thermal Infrared patterns are identified by using a specific index, RETIRA (Robust Estimator of TIR Anomalies to be computed on the image at hand as in the equation below [5,16]:
( ) ( ) ( ) ( ) (2)
Where r represents location coordinates on a satellite image, t is the acquisition time of image, and ( ) ( ) ( ), is the value of the difference between the punctual value of the land brightness temperature T( ) At the location r ≡ (x,y) and acquisition time t, and its spatial average T ≡ (t) over the area of interest;
( ) and ( ) are the time average value and the standard deviation of ( ) obtained for each location r ≡ (x,y) using cloud free records belonging to a homogeneous data set of observations collected in different years in similar (same month, same time of the day, etc.) observational conditions.
( ) ∑ ( ) (3) ( ) √ ∑ ( ( ) ( )) (4) For its application to seismic area monitoring, different variables have been used:
( ) [
( )
( ) ( ) ( ) ( ) ( ) ( )
Where T(r,t) is simply the TIR radiance at the sensor, LST is a specific product of satellite data analysis, which is expected to give , an estimate of the surface temperature corrected by the variable contribute of water vapour in the atmosphere [27, 28].
T(t) and LST(t) are spatial averages of T(r,t) and LST(r,t) computed in place on the image at hand considering cloud- free pixel only.
4. Results and discussion
The different steps of process from data post-processing, to all computations and spatial mapping were performed via a proper computer program in MATLAB® software [29].
( ) And ( ) are computed at the same time and location of the day for all, both are two
reference images, which represent the expected normal behaviour of the signal at each location (r) of the scene in the same observational conditions of the image. See Fig. 5.
( ) May 2003 ( )
Fig. 5. Reference fields of investigated area for the month of May and April calculated during
period 2000-2005
( ) ( ) : Represent the signal to be investigated for its possible relation with seismic
activity.
( ) : Local natural or observational variability of signal including all sources of variability as
historically observed at the same site in similar observational conditions (sensor, time of day, month...etc).
RETIRA index ( ) was computed for all cloud free pixels using six years (2000-2005) of
MODIS data.
3.1 Validation
We analysed the resulting images by applying RETIRA index to identify the correlation between time, location and magnitude of earthquake and existence of thermal anomalies.
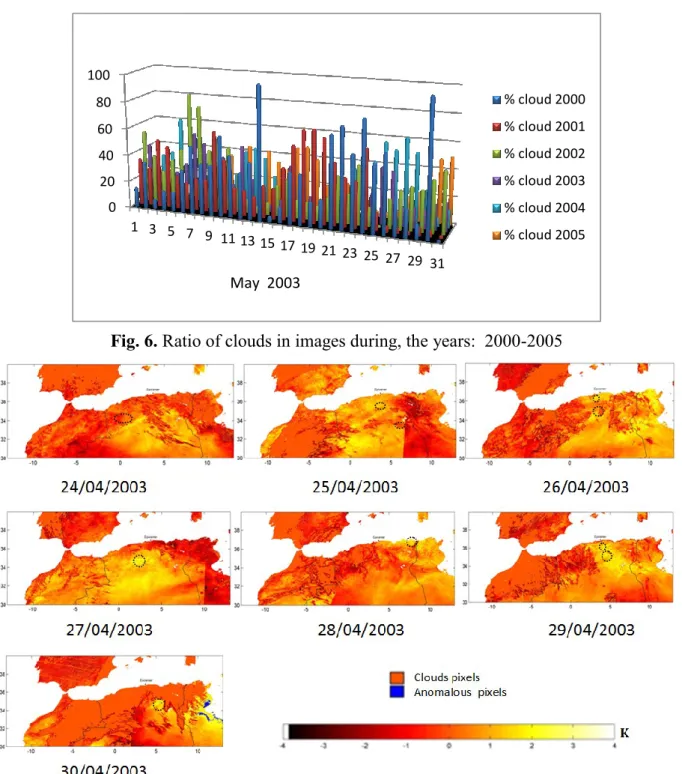
In Fig. 6, we present the ratios of clouds in images during, the period of study. All very cloudy images don’t take into consideration. (i.e. greater than 70% cloudy pixels in land surface of the image).
In the validation period, all collected images are accepted because there is no image with more than 70% cloudy pixels. See Fig. 6.
Where ( ) >2.5, the pixel considered as anomalous, and coloured by blue.
For The distance of thermal anomalies about to the epicentre, we consider Dobrovolsky distance: The zone of effective manifestation of the precursor deformation is a circle with the centre in the epicentre. The radius of the circle was calculated from the equation: where M is
the magnitude [30].
After observation and analysis of results, we identify many locations with RETIRA index
( ) and those pixels may be considered as thermal anomaly.
- Firstly the last week of April from 24, to 30 April 2003 (i.e one month before the main shock of Boumerdes earthquake) anomalous pixels around the epicentre earthquake (see, Fig. 7).
- The first four days of May, we identify a thermal anomaly in Bechar* region but, it is too far from the epicentre of the earthquake of 21st may 2003. Therefore, we don’t take it into consideration because the distance is greater than Dobrovolsky distance.
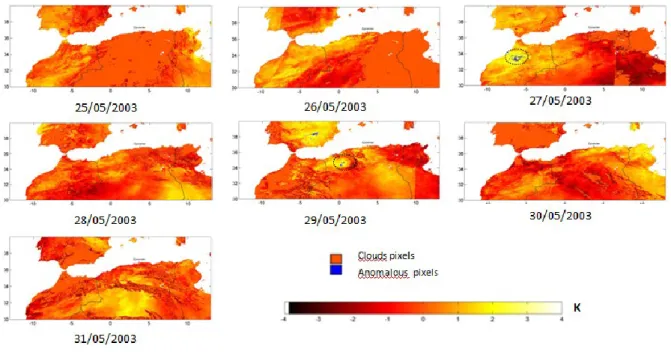
- Two weeks before, the Boumerdes earthquake we observe a sequence of thermal anomalies Appear and disappear around the epicentre region (on 6, 8, 11, 12 and 15 of the months of earthquake) and they are close to the epicentre, two days before the earthquake, see Fig. 8. - After the shock, a new anomaly appeared in 24 and 29 May (three and eight days after the
main shock respectively).This is depicted in Fig. 8.
* Béchar is located in the north-western region of Algeria, roughly 800 kilometres of the epicentre.
K
( ) April 2003
K
Fig. 6. Ratio of clouds in images during, the years: 2000-2005
Fig. 7. Results of RETIRA index computation on the investigated area in April 2003. Anomalous
pixels with ( ) > 2.5 depicted with blue and circled
0 20 40 60 80 100 1 3 5 7 9 1113 15 17 19 21 23 25 27 29 31 % cloud 2000 % cloud 2001 % cloud 2002 % cloud 2003 % cloud 2004 % cloud 2005 May 2003
Fig. 8. Results of RETIRA index computation on the investigated area in May 2003. Anomalous
Fig. 8. Continued
The analysis of ambient temperature of three stations in the month of the earthquake occurrence, prior to the events shows that an augmentation in temperature in the same time of thermal anomaly was detected before the earthquake especially in Tiziouzou stations, see Fig. 9.
Fig. 9. Variations of ambient temperature in two meteorological station (Dar Al-Beida and Tizi
ouzou) and temperature increase detected before 21st May 2003 earthquake boumerdes (Algeria) Fig. 9 represents the variations of ambient temperature in two meteorological stations during two months (April and May 2003). The measurements values in TIZI OUZOU and Dar EL-beida station represented with red and blue curve respectively. The earthquake day is represented as vertical line. It must be noted that, usually no registered increased temperature in this period.
It can be seen that we have augmentation in temperature three times before the earthquake day. From 11 to 13 April at the first time, secondly from 24 to 30 April and two days before the earthquake events. All recorded increased values were greater than 30 degrees. Therefore the observed increase in temperature considered as thermal anomaly.
These observations coincide with the results obtained by applying robust satellite technique with MODIS satellite data. The same period of thermal anomaly detected by RST in the validation phase have been observed in ambient temperature variations.
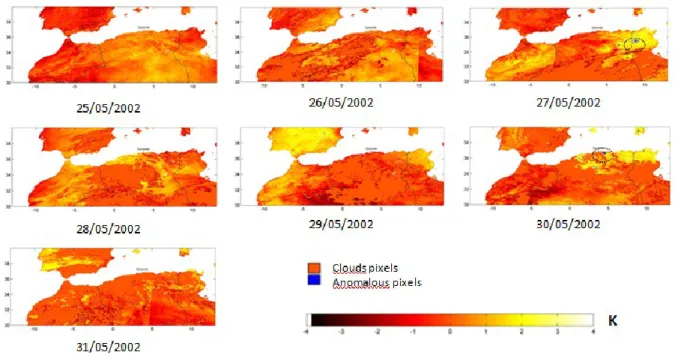
3.2 Confutation phase
According to Table 2, no earthquake is greater than 5 in magnitude which reported in the period 2000-2003. We analysed the result of RETIRA index to identify existence of possible TIR anomalies in the seismic region of Boumerdes 21st May 2003 earthquake.
Table 2. Large and Moderate Earthquakes with Thrust Mechanism along the Tell Atlas [31]
In order to examine the reliability of the analysed results for the Boumerdes earthquake, we use the same procedure to perform a confutation analysis on a relatively seismically unperturbed period: but in different years (April and May 2002)
- Two images (06/05/2002 and 07/05/2002) have been removed, a cause the cloud average percent is (>70%).
With the same conditions and RETIRA index ( ) have been used to identify
anomalous pixels in the images.
In fig. 10, the appearance of anomalous pixels observed in four times:
- First, in 15/05/2002 we observe anomalies appear in the western region (morocco) in the borders of Atlantic Ocean but they are not persistent (only one day).
- Second time, on 24/05/2002 in the same region.
- The third appearance of anomalies, in 27/05/2002 in the eastern region (Tunisia).
- Finally, the anomalies appear in the region of epicentre earthquake of 21st May 2003 Boumerdes (not persistent).
After the analysis of those results, we conclude that:
- The appearance of anomalies in the confutation phases is not persistent and it is in isolated area. So, it is possible that other causes contribute to form those anomalous pixels. The RETIRA index is not protected from the abrupt occurrence of signal outliers related to very
llocal† natural / observational conditions.
† According to Tramutoli (1998)[24] the double l is used hereafter to specify not only a certain place (r) but also a
certain time (t).
location Date Longitude Latitude(deg) Mw
Orléansville 9 Sep 1954 1.47 36.28 6.7 El asnam 10 Oct 1980 1.36 36.18 7.3 Tipaza 29 Oct 1989 2.92 36.84 5.9 Mascara 18 Aug 1994 -0.03 35.40 5.7 Ain Temouchent 22 Dec 1999 -1.45 35.34 5.7
Beni ourtilane 10 Nov 2000 4.69 36.71 5.7
Zemmouri 21 May 2003 3.65 36.83 6.8
07/05/2003 13/05/2003
Fig. 10. Results of RETIRA index computation on the investigated area in May 2002. Anomalous
Fig. 10. Continued 5. Conclusion
In this paper, we used MODIS data from 2000 to 2005, to build a database of MODIS land surface temperature (LST) images. By using this data and robust satellite approach,we seeks to detect thermal anomalies before the 2003 Boumerdès earthquake. In the same context, the anomalies detected are completed by the analysis of the temperature evolution in neighbouring meteorological stations. The daily mean air temperatures in three nearest stations to the epicenter of Boumerdès earthquake were used.
In the validation phase, we detected a thermal anomaly persisting for a week during the month preceding the earthquake (from 24 April to 30 April) and in the month of earthquake, two days before the events; For the confutation phase the appearance of anomalies is not persistent and it is in isolated areas.
The analysis of the ambient temperature of three stations in the month of the earthquake occurrence and the thermal anomalies detected with Robust Satellite Technique, prior to the earthquake shows that augmentation in temperature in the same time of thermal anomaly detected before the earthquake especially in Tiziouzou (Algeria) stations.
We note that, the connection between time and location of thermal anomaly was detected by robust satellite technique approach in side, and the variation of ambient temperature in other side, decrease in coastal zone because the ambient temperature in this area influenced by the maritime climate, more than other areas, so it is important to complete thermal anomalies precursors with robust satellite approach in regions far from the sea, with analysis of ambient temperature in order to predict the earthquake events.
Acknowledgements
The authors thank the Algerian Meteorological Office for generously providing in-situ ambient temperature measurements. In addition, the authors would like to thank National Aeronautical and Space Administration (NASA) for providing LST datasets on public domains which made this earthquake precursor study possible.
10/05/2002 01/05/2002
References
[1] A. A. Tronin, “Remote sensing and earthquakes : A review,” vol. 31, pp. 138–142, 2006. [2] D. Ouzounov and F. Freund, “Mid-infrared emission prior to strong earthquakes analyzed by
remote sensing data,” Adv. Sp. Res., vol. 33, no. 3, pp. 268–273, 2004.
[3] V. Tramutoli, , G. di bello, N. Pergola, s. pisctelli, “Robust satellite techniques for romte sensing ” Annals of geophysics 44(2), 167-177, 2001.
[4] V. T, R. C, C. F, N. G, M. L, and N. P, “From visual comparison to Robust Satellite Techniques : 30 years of thermal infrared satellite data analyses for the study of earthquake preparation phases,” vol. 56, no. June, pp. 167–202, 2015.
[5] V. Tramutoli, V. Cuomo, C. Filizzola, N. Pergola, and C. Pietrapertosa, “Assessing the potential of thermal infrared satellite surveys for monitoring ˙ zmit ) earthquake , seismically active areas : The case of Kocaeli ( I,” vol. 96, pp. 409–426, 2005.
[6] Z. Qiang, S. Province, and S. S. Bureau, “I Pure and Applied Geophysics Thermal IR Anomaly Before the Datong Earthquake,” vol. 149, pp. 159–171, 1997.
[7] A. A. Tronin, M. Hayakawa, and O. A. Molchanov, “Thermal IR satellite data application for earthquake research in Japan and China,” vol. 33, pp. 519–534, 2002.
[8] A. A. Tronin, “Temperature variations related to earthquakes from simultaneous observation at the ground stations and by satellites in Kamchatka area,” vol. 29, pp. 501–506, 2004. [9] J. Huang, F. Mao, W. Zhou, and X. Zhu, “Satellite thermal IR associated with Wenchuan
earthquake in China using MODIS data,” Proceeding 14th World Conf. Earthq. Eng., no. l, pp. 12–17, 2008.
[10] D. Ouzounov, N. Bryant, T. Logan, S. Pulinets, and P. Taylor, “Satellite thermal IR phenomena associated with some of the major earthquakes in 1999 – 2003,” vol. 31, pp. 154– 163, 2006.
[11] S. Saraf, A.K., Rawat, V., Banerjee, P., Choudhury, S., Panda, S.K., Dasgupta, S., J. D. Das, “ Satellite detection of earthquake thermal infrared precursors in Iran”, Natural Hazards pp. 119–135, 2008.
[12] S. K. Panda, S. Choudhury, A. K. Saraf, and J. D. Das, “International Journal of Remote MODIS land surface temperature data detects thermal anomaly preceding 8 October 2005 Kashmir earthquake,” no. November 2014, pp. 37–41, 2005.
[13] M. Akhoondzadeh, “Anomalous TEC variations associated with the powerful Tohoku earthquake of 11 March 2011,” Nat. Hazards Earth Syst. Sci., vol. 12, no. 5, pp. 1453–1462, 2012.
[14] M. Akhoondzadeh, “An Adaptive Network-based Fuzzy Inference System for the detection of thermal and TEC anomalies around the time of the Varzeghan, Iran, (Mw=6.4) earthquake of 11 August 2012,” Adv. Sp. Res., vol. 52, no. 5, pp. 837–852, Sep. 2013.
[15] N. Pergola et al., “Using RST approach and EOS-MODIS radiances for monitoring seismically active regions : a study on the 6 April 2009 Abruzzo earthquake,” pp. 239–249, 2010.
[16] N. Genzano, C. Filizzola, R. Paciello, N. Pergola, and V. Tramutoli, “Robust Satellite Techniques (RST) for monitoring earthquake prone areas by satellite TIR observations: The case of 1999 Chi-Chi earthquake (Taiwan),” J. Asian Earth Sci., vol. 114, pp. 289–298, 2015. [17] C. Filizzola, N. Pergola, C. Pietrapertosa, and V. Tramutoli, “Robust satellite techniques for
seismically active areas monitoring: a sensitivity analysis on September 7, 1999 Athens’s earthquake,” Phys. Chem. Earth, Parts A/B/C, vol. 29, no. 4, pp. 517–527, 2004.
[18] R. Corrado, R. Caputo, C. Filizzola, N. Pergola, C. Pietrapertosa, and V. Tramutoli, “Seismically active area monitoring by robust TIR satellite techniques: a sensitivity analysis on low magnitude earthquakes in Greece and Turkey,” Nat. Hazards Earth Syst. Sci., vol. 5, no. 1, pp. 101–108, 2005.
[19] N. Genzano, C. Aliano, C. Filizzola, N. Pergola, and V. Tramutoli, “A robust satellite technique for monitoring seismically active areas: The case of Bhuj–Gujarat earthquake,”
Tectonophysics, vol. 431, no. 1, pp. 197–210, 2007.
[20] A. Eleftheriou et al., “Long-Term RST Analysis of Anomalous TIR Sequences in Relation with Earthquakes Occurred in Greece in the Period 2004–2013,” Pure Appl. Geophys., vol. 173, no. 1, pp. 285–303, Jan. 2016.
[21] C. Aliano, R. Corrado, C. Filizzola, N. Pergola, and V. Tramutoli, “Robust Satellite Techniques (RST) for Seismically Active Areas Monitoring: the Case of 21st May, 2003 Boumerdes/Thenia (Algeria) Earthquake,” in 2007 International Workshop on the Analysis of
Multi-temporal Remote Sensing Images, 2007, pp. 1–6.
[22] Z. Wan, “MODIS Land Surface Temperature Products Users ’ Guide,” no. March, 2007. [23] U. Okyay, “Evaluation of Thermal Remote Sensing for Detection of Thermal Anomalies As
Earthquake Precursors, A Case Study for Malatya-Pütürge-Doğanyol (Turkey) Earthquake. July 13, ” , (Master Thesis). New University of Lisbon, 2012.
[24] V. Tramutoli, “Robust AVHRR Techniques ( RAT ) for Environmental Monitoring : theory and applications .,” vol. 3496, no. September, 1998.
[25] P. Xiong, X. Shen, and X. Gu, “Satellite detection of IR precursors using bi-angular advanced along-track scanning radiometer data : a case study of Yushu earthquake,” vol. 28, pp. 25–36, 2015.
[26] T. Lacava, E. V. Di Leo, N. Pergola, and V. Tramutoli, “Space–time soil wetness variations monitoring by a multi-temporal microwave satellite records analysis,” Phys. Chem. Earth,
Parts A/B/C, vol. 31, no. 18, pp. 1274–1283, 2006.
[27] G. Di Bello et al., “Robust satellite techniques for volcanicand seismic hazards monitoring,”
Ann. Geophys., vol. 47, no. 1, 2004.
[28] V. Tramutoli et al., “A decade of RST applications to seismically active areas monitoring by TIR satellite observations,” vol. 1, no. 1, 2013.
[29] F. Edition, Scientifi c Computing with MATLAB and Octave. .
[30] I. P. Dobrovolsky, S. I. Zubkov, and V. I. Miachkin, “Estimation of the size of earthquake preparation zones,” Pure Appl. Geophys. PAGEOPH, vol. 117, no. 5, pp. 1025–1044, 1979. [31] S. Belabbès, C. Wicks, Z. Çakir, and M. Meghraoui, “Rupture parameters of the 2003
Zemmouri ( M w 6.8), Algeria, earthquake from joint inversion of interferometric synthetic
aperture radar, coastal uplift, and GPS,” J. Geophys. Res., vol. 114, no. B3, p. B03406, Mar. 2009.

![Fig. 2. Diagram of the preprocessing steps: calculate LST image from MODIS HDF image [23]](https://thumb-eu.123doks.com/thumbv2/123doknet/15047588.693608/4.892.317.641.120.534/fig-diagram-preprocessing-steps-calculate-image-modis-image.webp)

![Table 2. Large and Moderate Earthquakes with Thrust Mechanism along the Tell Atlas [31]](https://thumb-eu.123doks.com/thumbv2/123doknet/15047588.693608/11.892.128.770.231.422/table-large-moderate-earthquakes-thrust-mechanism-tell-atlas.webp)