W
ORKING
P
APERS
SES
F
A C U L T É D E SS
C I E N C E SE
C O N O M I Q U E S E TS
O C I A L E SW
I R T S C H A F T S-
U N DS
O Z I A L W I S S E N S C H A F T L I C H EF
A K U LT Ä TU
N I V E R S I T É D EF
R I B O U R G| U
N I V E R S I T Ä TF
R E I B U R G5.2013
N° 442
Does Bilateral Trust Affect
International Movement of Goods
and Labor?
Does Bilateral Trust Affect International
Movement of Goods and Labor?
∗
Eva Spring
†and Volker Grossmann
‡April 30, 2013
Abstract
Trust in the citizens of a potential partner country may affect the decision to trade with or to migrate to a foreign country. This paper employs panel data to examine the causal impact of such bilateral trust on international trade and migration patterns. We apply instrumental variables (IV) approaches that cap-ture the exogenous variance of bilateral trust separately with eight indicators of genetic (“somatic") distance between country-pairs. These indicators work equally well at the first stage. However, second-stage results very much depend on the exact measure employed as instrument. Overall, we find little evidence that bilateral trust affects international movements of goods and labor. More generally, we highlight the potential fragility of IV estimations even when the instruments seem plausible on theoretical grounds and when standard statistical tests confirm their validity.
Key words: Bilateral trust; International migration; International trade; Instrumental variables; Somatic distance.
JEL classification: F10; F22; Z10.
∗Acknowledgements: We are grateful to Francesc Ortega and Giovanni Peri for providing us with their unique dataset on bilateral gross immigration flows and to Luigi Guiso, Paola Spaienza, and Luigi Zingales for sending us their measure of press coverage. We also thank Joseph Falkinger, Joshua Angrist, Manuel Arellano, Bo Honoré, and Mark Watson as well as seminar participants at the Synergia workshop "Inequality and International Trade" 2012 in Hurden and the Young Swiss Economist Meeting 2013 in Bern for valuable comments and suggestions.
†University of Fribourg. Address: University of Fribourg, Departement of Economics, Bd. de Pérolles 90, F410, CH-1700 Fribourg, Switzerland. Phone: +41 (0)26 300 93 82. Email: [email protected].
‡University of Fribourg; CESifo, Munich; Institute for the Study of Labor (IZA), Bonn. Address: University of Fribourg, Department of Economics, Bd. de Pérolles 90, G424, CH-1700 Fribourg, Switzerland. Phone: +41 (0)26 300 93 83. Email: [email protected]
1
Introduction
The study of the effects of trust for international trade is rooted in the general notion that economic exchange is often characterized by asymmetric information which can lead to opportunistic behavior. To prevent this type of behavior, contracts define the obligations of all implied parties. However, contracts are by nature incomplete as it is too costly to take into account or even know all contingencies when establishing them. Furthermore, it can be difficult to monitor and enforce contracts, especially in international trade where the commercial partners are established in different jurisdic-tions (Rodrik, 2000). As a result, successful trade opportunities might not be realized, unless the parties trust each other (Akerlof, 1970; Arrow, 1972; Putnam, 1993; Grief, 1993, 2000; Coleman, 1994; Kallock, 1994; Fukuyama, 1995; Paldam, 2000). When trade partners are confident that they will not be cheated on, they divert less resources to negotiate, monitor, and enforce contracts (Knack and Keefer, 1997; Dyer and Chu, 2003). By mitigating these transaction costs, the trust citizens of the country importing goods have towards citizens of their partner country, denoted by "Destination-to-Source (DtS) trust", may enhance profitability of trade opportunities and thereby increase the volume of international trade.
In fact, empirical evidence by Guiso, Sapienza, and Zingales (2009, henceforth GSZ) suggests that DtS trust has a significant and economically important causal effect on international trade. To address endogeneity concerns, GSZ isolate the exogenous vari-ation of bilateral trust with two measures of cultural proximity of country-pairs, an indicator of genetic ("somatic") distance and a measure of religious similarity. By do-ing so, their instrumental variables (IV) estimations overturn the result of estimatdo-ing a standard gravity-type trade regression with trust as an additional regressor via OLS. The significant point-estimates of the IV coefficients on bilateral trust are more than five times larger than their insignificant OLS counterparts. This increase might simply reflect the reduction of the bias that distorts the OLS coefficient of the potentially en-dogenous trust variable. Nevertheless, it could equally indicate that there is a problem
with the instrumentation strategy, statistical tests notwithstanding.1
First, this paper reconsiders the relationship between trust and international trade
by using seven alternative measures of somatic distance to the one used by GSZ.2 In
fact, the researcher has a large degree of freedom when constructing an indicator of somatic distance. All of our indicators measure physical dissimilarities between the "average" individual of two countries. They exploit the notion that individuals who look less alike tend to trust each other less. At the same time, physical dissimilarities per se should not have an impact on trade in a way other than through their effect on bilateral trust.
We find that all of our alternative measures of somatic distance are highly corre-lated with the endogenous trust variable in a similar fashion than the somatic distance variable originally used by GSZ. Moreover, there is no indication of weak identification problems. It should thus not matter for consistent estimates which somatic distance measure we choose to instrument bilateral trust with. Using the indicator of GSZ, we find that an increase of one standard deviation in instrumented DtS trust increases aggregated export flows on average by 24 percent, which basically replicates their orig-inal finding. However, the coefficients of bilateral trust become insignificant as soon as we do not use the original indicator by GSZ. With all of our seven alternative indi-cators, the size of coefficients on instrumented bilateral trust in the trade regressions declines considerably, sometimes even becoming negative. Moreover, the coefficients on the alternative instruments are never significantly different from zero in the reduced form where trade flows are regressed on them. Generally, this suggests that the en-dogenous variable has no effect on the dependent variable (Angrist and Pischke, 2009). 1For instance, as discussed by GSZ themselves, religion may shape institutions and thus may affect international trade and other forms of international economic exchange not only through the trust channel. In this case, religious similarity should not be used as an instrument. Therefore, we define an alternative specification including religious similarity as a regressor, focusing on somatic distance measures as instruments.
2Three of them are made available in the online-appendix of the paper by GSZ (Guiso et al., 2008a), but are not used in the published version of the paper. Our sensitivity analysis is motivated by the following statement by Murray (2006, p. 119): "If the parameter estimates using different instruments differ appreciably and seemingly significantly from one another, the validity of the instruments becomes suspect."
In sum, contrary to what has been suggested by GSZ, we conclude that a causal effect of bilateral trust on international trade is not supported by the data.
Motivated by this surprising result, second, we re-run our regressions by using
international migration rather than trade as dependent variable at the second stage.3
Potentially, trust in the citizens of a host country may have an impact on the decision to migrate to a foreign country. Generally, in the absence of important barriers to migration, individuals only migrate to a foreign country if expected migration benefits exceed expected migration costs (Roy, 1951; Sjaastad, 1962; Anderson, 1979; Borjas, 1987, 1989; Grogger and Hanson, 2011). Both benefits and costs may be monetary, such as a higher income in the host country or physical moving costs. They can also be of social or psychological nature. However, forming expectations on such migration costs and benefits is difficult. Migrants are generally not fully aware of the social, political, institutional, and cultural environment of potential host countries. In such a context, their decision to migrate may also rely on the trust they have in citizens of the destination country. This bilateral trust, which we refer to as "Source-to-Destination (StD) trust", might change the way expectations on costs and benefits of moving abroad are formed. Thus, there is reason to believe that StD trust directly affects international migration by changing its expected net return. Likewise, the trust that citizens from the destination country grant citizens from the source country, the DtS trust, may play a role in the migration decision. For instance, it may affect immigration policies towards specific countries or regions.
We measure international migration by the gross immigration flows taken from a unique panel data set established by Ortega and Peri (2009, 2011). The pattern which emerges from estimating the relationship between these migration flows and bilateral trust is very similar to our results for trade. When using the original somatic distance indicator by GSZ as instrument, we find that bilateral trust has a significant and positive effect on international migration. More precisely, the results suggest that an increase in StD trust or DtS trust of one standard deviation increases immigration 3GSZ studied the effect of trust on investment flows, in addition to trade flows, but did not consider migration.
flows on average by 67 percent and 53 percent, respectively. However, when using the seven alternative and equally valid measures of somatic distance as instruments, we are unable to find a significant and quantitatively important effect of trust on migration flows.
This paper is part of a growing literature that analyzes the role of trust for economic outcomes. Prior research suggests various channels through which trust influences
economic activity.4 Comparing Italian regions, Putnam (1993) finds that trust increases
participation in social activities, facilitates cooperation, and improves the effectiveness
of institutions.5 More recently, empirical studies show that trust fosters economic
development and growth also through its positive effect on total factor productivity (Bjornskov, 2010), on financial development (Guiso et al., 2004, 2008b), and on the rate of investment (Knack and Keefer, 1997; Zak and Knack, 2001. Algan and Cahuc (2010) and Tabellini (2010) find a causal effect of inherited and historically determined trust on economic growth. These studies exploit the variation of generalized trust across countries (proposed by the World Values Surveys) to identify its role for differential economic outcomes. By contrast, we are concerned with the effects of bilateral trust on bilateral movement of goods and labor between two countries. To the best of our knowledge, none has yet examined the impact of trust on international migration patterns, a gap that we want to fill in this study.
Our paper hence also contributes to the literature on the determinants of interna-tional migration. Since Ravenstein (1885) presented his law of migration, economists devoted considerable energies to study the migration decision. Many empirical papers analyzing migration patterns such as Clark, Hatton and Williamson (2007), Peder-sen, Pytlikova and Smith (2008), Mayda (2010), Beine, Docquier and Ozden (2011), Grogger and Hanson (2011), and Beine and Parons (2012) are based on the income 4As already asserted by Arrow (1972, p. 357): “Virtually every commercial transaction has within itself an element of trust, certainly any transaction conducted over a period of time. It can be plausibly argued that much of the economic backwardness in the world can be explained by the lack of mutual confidence."
5On trust and institutions, see also La Porta et al. (1997), Alesina and La Ferrara (2000), Bjornskov (2006), Tabellini (2008, 2010), Bloom, Sadun and Reeen (2009), and Aghion, Algan, Cahuc, and Shleifer (2010).
maximization approach originated by Roy (1951). Our framework is similar to these recent contributions which use gravity-type frameworks to analyze various determi-nants of international migration but in contrast to this literature focusses on bilateral trust.
Finally, our paper highlights potential fragility of IV estimations. Although the standard statistical tests affirm that the applied IV strategies are equally valid and that the instruments are sufficiently strong, we find that small changes in the construc-tion of an instrument can fundamentally change the results. Our analysis highlights the importance of performing sensitivity analysis with alternative instruments, even when an instrument seems plausible on econometric and theoretical grounds. This is especially true when there is a large degree of freedom in constructing the instruments. The rest of the paper is organized as follows. The next section analyzes the causal effect of bilateral (DtS) trust on international trade and presents the empirical model, the data, and the results of the sensitivity analysis. Section 3 reports the results of regressing international migration on StD and DtS trust, using a similar identification strategy. The last section concludes.
2
Bilateral Trust and International Trade
In this section, we examine the effects of Destination-to-Source (DtS) trust on com-modity export flows. We first estimate the specification suggested by GSZ with data constructed and collected following their instructions. Moreover, we follow their iden-tification strategy and use their specific measure of somatic distance as an instrument for bilateral trust. In a second step, we investigate the robustness of their results by estimating alternative specifications based on alternative indicators of somatic distance which are equally well correlated with DtS trust.
2.1
Identification
To analyze the relationship between DtS trust and international trade, GSZ focus on
a specification that takes the following form:6
() = 0+ 1+ X0 γ+ + + (1)
where the dependent variable, (), is the natural logarithm of the aggregated
commodity export flows from country to country in year and is the
DtS trust observed in year . X0 is a vector of time-invariant bilateral variables
which capture trade costs (Anderson and van Wincoop, 2004). It includes a variable measuring the geographical distance between two countries and dummy variables that take the value 1 when two countries share a border, an official language, or when their legal system has the same origin. Following GSZ, we further include an indicator of press coverage that measures how many times a partner country was mentioned in the national newspapers, a proxy for transportation costs, and a measure of linguistic common roots. The variable can take values between zero and one: it is one when two countries share an official language, zero when the two official languages come from different language families, and it takes values between zero and one when the
official languages share some common nods. and are time-varying country
dummies which account for country- and time-specific determinants of international trade. According to Baldwin and Taglioni (2006), these dummies are supposed to eliminate the bias stemming from the omission of what Anderson and van Wincoop
(2003, 2004) call "multilateral resistance" to trade.7 The last term in equation (1),
6This equation is closely related to the standard gravity regression. Since the gravity model was given a theoretical foundation by Anderson (1979), it has been widely used to analyze economic outcomes and it fits the data remarkably well. For a short overview of the origin of the gravity model and the corresponding literature see also Anderson and van Wincoop (2003), Baldwin and Taglioni (2006), Anderson (2011), and Head and Mayer (2013).
7As explained by Anderson and van Wincoop (2003, p. 170), " [...] after controlling for size, trade between two regions is decreasing in their bilateral trade barrier relative to the average barrier of the two regions to trade with all their partners. Intuitively, the more resistant to trade with all others a region is, the more it is pushed to trade with a given bilateral partner. We will refer to the theoretically appropriate average trade barrier as ‘multilateral resistance’."
, is a mean-zero random variable accounting for random shocks.
The inclusion of pair-specific variables and time varying country dummies partially addresses potential mis-specification caused by omitted variables but the OLS
esti-mate of DtS trust (1) might still be inconsistent because of measurement error or
simultaneous causality. In order to identify the causal relationship between bilateral trust and international trade, GSZ instrument the endogenous variable with a proxy of religious similarity and an indicator of somatic distance which measures the dis-tance between three anthropometric characteristics observed in the native populations of two countries: the average height, the prevailing hair color, and the average cephalic index, which measures the average width and length of an individual’s skull. In an experiment, DeBruine (2002) finds that people trust other people who resemble them-selves significantly more. We hence expect a decrease in somatic distance to increase international trade through its positive effect on bilateral trust. The second instru-ment, religious similarity, measures the probability that a randomly picked individual in country has the same religion as a randomly picked individual in country . As religion may shape beliefs, it may positively affect bilateral trust. However, we suspect religious similarity to capture also other cultural and institutional variables that foster international trade. If religious similarity does not satisfy the exclusion restrictions, i.e. if it affects the dependent variables other than through bilateral trust, then it is not a valid instrumental variable and must be included as a control variable in the trade regression. We therefore also estimate alternative specifications in which the
vector X0
contains the measure of religious similarity. In these cases, bilateral trust
is instrumented only with an indicator of somatic distance.
When estimating the trade equations, we compute standard errors that are robust to heteroskedasticity of unknown and arbitrary form. Moreover, we cluster at the country-pair which allows the standard errors to be correlated over time within country-country-pairs, but assumes that they are uncorrelated with errors of a different country-pair. The data used to analyze equation (1) is described next.
2.2
Data
The aggregated commodity export flows are collected by the International Merchandise Trade Statistics Section (IMTS) of the United Nations Statistics Division. It standard-izes data delivered by national statistical authorities and continuously updates the UN Comtrade Database which contains detailed statistics on the import and export of
commodities for over 250 countries and areas.8 These aggregated commodity export
flows are regressed on DtS trust, an indicator proposed by the Eurobarometer Surveys. These surveys are mandated by the European Commission in order to have a better understanding of the public opinion in the European Member States. To reach this objective, approximately 1,000 individuals per Member State are interviewed yearly since 1970 using a common questionnaire. The question of interest for our paper is: "I would like to ask you a question about how much trust you have in people from various countries. For each, please tell me whether you have a lot of trust, some trust, not very much trust, or no trust at all." It was first asked in the year 1970 in five European countries. From 1970 to 1996, it reappeared ten times in the standard Eurobarometer
Surveys and the country sample increased each time.9 In 1996, citizens of 17 European
countries were asked to indicate the trust they had towards citizens of 25 EU and Non-EU countries. For reasons of homogeneity, we follow GSZ and focus on European countries only. We construct the bilateral trust indicator analogously to GSZ by coding the answers to this question the following way: 1 (no trust at all), 2 (not very much trust), 3 (some trust), 4 (a lot of trust). In a next step, we compute the average level of bilateral trust for each country-pair by taking the mean value of the answers in each year for which we have survey data.
The dyadic dummy variables included in equation (1) come from the CEPII Grav-8In the UN Comtrade Database, the commodities are classified according to the Stan-dard International Trade Classification (SITC), the Harmonized Commodity Coding System (HS), and The Broad Economic Categories (BEC). The data can be downloaded from http://comtrade.un.org/db/default.aspx. Unfortunately, we cannot include data on trade in services as this data is only collected since the year 2000.
9The data can be downloaded from the ZACAT-GESIS Online Study catalogue,
http://zacat.gesis.org/webview/. The bilateral trust question was asked in the Eurobarometer Survey of the years 1970, 1976, 1980, 1983, 1986, 1990, 1991, 1993, 1994, and 1996.
ity Dataset generated by Head, Mayer and Ries (2010, 2013).10 The measure of
geo-graphical distance between countries was established by Mayer and Zignago (2011).11
As proxy for trade costs, GSZ use the indicator for geographical distance proposed by Frankel, Stein, and Wei (1995) which measures the (log) distance in kilometers between two capital cities. It assumes that the whole population is concentrated in one geo-graphical point, thereby failing to capture the distribution of economic activity within a country. Head and Mayer (2002) argue that the inclusion of this distance measures in a gravity-type equation systematically inflates the estimated border effect because it overestimates the geographical distances within a country relative to international distances. Therefore, we only use it to replicate the results of GSZ. In the rest of the paper, we focus on the population-weighted distance indicator provided by Mayer and Zignago (2011), which calculates the "distances between two countries based on bilateral distances between the biggest cities of those two countries, those inter-city distances being weighted by the share of the city in the overall country’s population" (p. 11).
GSZ provided us with their indicator of press coverage12 and we reconstruct the
proxies for transportation costs and for linguistic common roots following the instruc-tions given by GSZ. As proxy for transportation costs we use the estimates for shipping
costs made available on line by the Import Export Wizard.13 The data employed to
compute the commonality of two official languages comes from "The Ethnologue".14
The indicator of somatic distance used as an instrumental variable for bilateral 10It can be downloaded from www.cepii.fr.
11See http://www.cepii.fr/CEPII/fr/bdd_modele/presentation.asp?id=6.
12As outlined by GSZ (p. 1106), the measure of press coverage was established in the following way: “In Factiva, we searched the newspaper with the highest circulation for each country. For each pair of countries i and j, we recorded the number of articles in the newspaper of countries that mentioned country j or its citizens in the headline. We divided this number by the number of total news stories on foreign countries". Factiva is an online research tool owned by Dow Jones & Company. It collects and archives informations made available by over 30’000 newspapers, journals, magazines, web pages, etc. on a broad range of contents. It aggregates information from over 200 countries. See www.factiva.com. 13The Import-Export Wizard is a Internet page which estimate the price of shipping or flying a good from one country to another. We downloaded the prices of shipping a 1.000kg unspecified freight type load with no special handling in June 2011. See http://importexportwizard.com. GSZ based this measure on Giuliano, Spilimbergo, and Tonon (2006).
14See www.ethnologue.com and the printed version edited by Lewis et al. (2013).
trust can be constructed in many different ways. Four measures are made available in
the online-appendix to the paper by GSZ (Guiso et al., 2008a).15 They are constructed
based on four anthropometric indicators: hair color, cephalic index, height, and skin color. The first three anthropometric indicators were published by Biasutti (1959). He classifies the world into five categories of hair colors: 1 (blond prevails), 2 (mix of blond and dark), 3 (dark prevails), 4 (sporadic presence of blond), and 5 (exclusively dark). He further differentiates five categories of average cephalic indexes, going from 71.0 to 86+, and six categories of height. For illustration, Figure 1 reprints the distribution of the average cephalic index for European regions.
Using today’s borders, many countries fall into several classes of these traits, in which case GSZ focus on the predominant category and ignore the others. They at-tribute scores to the different groups of hair color, cephalic index, height, and skin color, and "compute the somatic distance between two countries as the sum of the ab-solute value of the difference in each of these traits" (GSZ, p. 1107). Their constructed four measures of somatic distance are all computed in the same fashion but they are based on different combinations of these four physical characteristics. One measure of somatic distance sums the absolute distance in all four dimensions. The sole measure used in the study of GSZ ignores the difference in skin color. A third measure is based on differences in hair color, height, and skin color. Finally, another measure only sums the absolute differences in hair color and height.
We construct four additional measures of somatic distance. To do this, we attribute the score of 1 to the category corresponding to the lowest average cephalic index (71.0 - 74.9), 2 to the second category (75.0 - 78.9), and so on. The six categories of height defined by Biasutti (1959) are coded the same way, attributing the lowest score of 1 to the category "157.9 cm or less" and the highest score of 6 to "178 cm or more". In a first step, we follow exactly the instructions given by Guiso et al. (2008a, p. 3) and try to replicate the single measure of somatic distance used in GSZ. As it is hardest to define which category of cephalic index prevails, our second measure is
15These measures can be downloaded from Paola Sapienza’s web page under
Figure 1
Distribution of the Average Cephalic Index in Europe
based only on the absolute differences in hair color and height. The next two measures differ from the others by allowing a country to fall into two categories and weight
them according to population density.16 One measure is again based on the three
anthropometric indicators proposed by Biasutti while the other ignores the differences in cephalic index. The data on population density comes from two figures: a map with the population density in 1989 provided by the European Environment Agency and one with the population density in 2010 made available by the Nordic Center for
Spatial Development.17
The indicator of religious similarity used to capture the exogenous part of bilateral trust is constructed with data from the World Value Surveys presented by Guiso et al. (2003). They report the national distribution of population by the following religious affiliation: Catholic, Protestant, Jewish, Muslim, Hindu, Buddhist, no religious affili-ation and other affiliaffili-ations. We use this informaffili-ation to compute the probability that two randomly picked individuals in two different countries have the same religion.
The descriptive statistics of the samples used to analyze the relationship between
international trade and DtS trust are presented in Panel A of Table 1.18
16For some countries, we find it very difficult to decide which trait is prevailing, especially when focusing on the different categories of cephalic index. For example, in Figure 1 we see that northern Germany falls into category 3, “79.0 - 82.9", while the other half of Germany falls into category 4, “83.0 - 86.9". Guiso et al. (2008a) do not indicate how they decide which one of these categories prevails in such situations. We partially succeed to replicate their somatic distances when we decide visually (based on Figure 1) which trait covers a larger area and assume that it is the dominant char-acteristic. However, this procedure is somewhat arbitrary, especially when ignoring the distribution of the population. As the German population is approximately equally distributed, we would ignore the characteristics of half of the population if we arbitrarily decided that either category 3 or 4 prevails. To account for this, our two measures of somatic distance allow a country to be home of two cate-gories of traits, depending on the distribution of the population. Concretely, in the case of Germany we find that the categories of cephalic index 3 (“79.0 - 82.9") and 4 (“83.0 - 86.9") roughly share the German territory and population. Therefore, we decide to attribute it the score of 3.5. This measure is certainly not flawless but it allows us to further explore the robustness of the results published by GSZ.
17See Stanners, D. and Bourdeau, Ph. (1994) or www.eea.europa.eu/publications/92-827-5122-8/page008.html for the chart on population density in 1989 and Roto, J. (2011) or www.nordregio.se/en/Maps—graphs/ for the population density in 2010.
18We follow GSZ by only including observations for countries that were members of the European Economic Area before 1997 and for Norway.
Variable Mean Median Std. dev. Min Max N
Export flows (from source to destination, log) 14.56 14.63 1.64 9.57 17.88 679
DtS Trust 2.73 2.72 0.28 1.99 3.65 679
Press Coverage 0.04 0.02 0.05 0.00 0.31 679
Weighted Distance (log) 7.00 7.06 0.55 5.08 8.13 679
Distance between capitals (log) 6.90 7.07 0.69 5.15 8.12 679
Transportation costs (log) 5.19 5.18 0.07 5.08 5.42 679
Common border 0.20 0.00 0.40 0.00 1.00 679
Common language 0.08 0.00 0.28 0.00 1.00 679
Same legal origin 0.31 0.00 0.46 0.00 1.00 679
Linguistic common roots 0.63 0.67 0.20 0.00 1.00 679
Religious similarity 0.34 0.33 0.25 0.00 0.87 679
Somatic Distance
Available in Guiso et al. (2008a), sum of the absolute differences in the following prevailing traits
- hair color, height, cephalic index, skin 2.93 3.00 1.37 0.00 6.00 679
- hair color, height, skin 2.05 2.00 1.29 0.00 5.00 679
- hair color, height, cephalic index 2.48 2.00 1.20 0.00 5.00 679
- hair color, height 1.60 2.00 1.08 0.00 4.00 679
Own elaboration, following the instructions in Guiso et al. (2008a)
- hair color, height, cephalic index 2.35 2.00 1.21 0.00 5.00 679
- hair color, height 1.48 2.00 0.96 0.00 3.00 679
Own elaboration, allowing for a country to fall into two categories of
- hair color, height, cephalic index 2.15 2.00 1.15 0.00 4.50 679
- hair color, height 1.47 1.50 1.04 0.00 3.00 679
Gross Immigraiton Flows (log) 6.84 6.84 1.87 2.08 12.13 450
StD Trust 2.79 2.79 0.30 1.99 3.65 450
Diff. in GDP p.c. (%) 0.34 0.18 0.66 -0.62 3.55 450
Common language 0.09 0.00 0.28 0.00 1.00 450
Weighted Distance (log) 6.91 7.01 0.62 5.08 8.13 450
Common border 0.21 0.00 0.41 0.00 1.00 450
Same legal origin 0.32 0.00 0.47 0.00 1.00 450
Migration Stock 1960 (log) 4.86 0.00 5.56 0.00 13.50 450
Religious similarity 0.31 0.32 0.24 0.00 0.87 450
Somatic Distance
Available from Guiso et al. (2008a), sum of the absolute differences in the following prevailing traits
- hair color, height, cephalic index, skin 2.87 3.00 1.40 0.00 6.00 450
- hair color, height, skin 2.11 2.00 1.34 0.00 5.00 450
- hair color, height, cephalic index 2.43 3.00 1.18 0.00 5.00 450
- hair color, height 1.67 2.00 1.09 0.00 4.00 450
Own elaboration, following the instructions in Guiso et al. (2008a)
- hair color, height, cephalic index 2.35 2.00 1.20 0.00 5.00 450
- hair color, height 1.56 2.00 0.97 0.00 3.00 450
Own elaboration, allowing for a country to fall into two categories of
- hair color, height, cephalic index 2.10 2.00 1.13 0.00 4.50 450
- hair color, height 1.51 1.50 1.03 0.00 3.00 450
Panel B International Migration and Source-to-Destination Trust
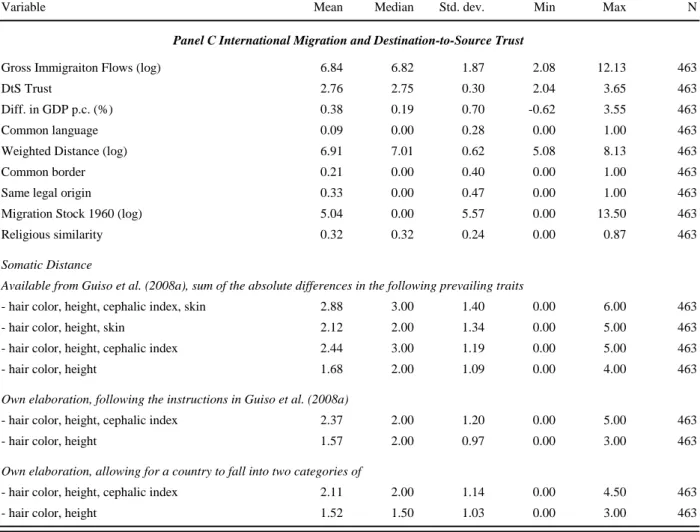
Table 1 Descriptive Statistics
Variable Mean Median Std. dev. Min Max N
Gross Immigraiton Flows (log) 6.84 6.82 1.87 2.08 12.13 463
DtS Trust 2.76 2.75 0.30 2.04 3.65 463
Diff. in GDP p.c. (%) 0.38 0.19 0.70 -0.62 3.55 463
Common language 0.09 0.00 0.28 0.00 1.00 463
Weighted Distance (log) 6.91 7.01 0.62 5.08 8.13 463
Common border 0.21 0.00 0.40 0.00 1.00 463
Same legal origin 0.33 0.00 0.47 0.00 1.00 463
Migration Stock 1960 (log) 5.04 0.00 5.57 0.00 13.50 463
Religious similarity 0.32 0.32 0.24 0.00 0.87 463
Somatic Distance
Available from Guiso et al. (2008a), sum of the absolute differences in the following prevailing traits
- hair color, height, cephalic index, skin 2.88 3.00 1.40 0.00 6.00 463
- hair color, height, skin 2.12 2.00 1.34 0.00 5.00 463
- hair color, height, cephalic index 2.44 3.00 1.19 0.00 5.00 463
- hair color, height 1.68 2.00 1.09 0.00 4.00 463
Own elaboration, following the instructions in Guiso et al. (2008a)
- hair color, height, cephalic index 2.37 2.00 1.20 0.00 5.00 463
- hair color, height 1.57 2.00 0.97 0.00 3.00 463
Own elaboration, allowing for a country to fall into two categories of
- hair color, height, cephalic index 2.11 2.00 1.14 0.00 4.50 463
- hair color, height 1.52 1.50 1.03 0.00 3.00 463
Panel C International Migration and Destination-to-Source Trust
Notes . This table presents the descriptive statistics of the sample used to estimate the effect of DtS trust on commodity export flows (Panel A), the impact of StD trust on gross immigration flows (Panel B), and the effect of DtS trust on gross immigration flows (Panel C). The data sources are described in sections 2.2 and 3. All samples include observations for European countries over the years for which we have trust data (1970, 1976, 1980, 1983, 1986, 1990, 1991, 1993, 1994, and 1996). The number of observations varies across the panels because of missing data.
2.3
Results
Table 2 present the result of estimating equation (1). In Panel A, we use a similar indicator of geographical distance between countries as GSZ (distance between two capital cities). In this case, we find coefficients on bilateral trust that are very similar
to the ones published in their study.19 The coefficient on geographical distance is barely
significant, however. Yet, as discussed in section 2.2, we suspect this measure to be inadequate and we therefore replace it by the outlined population-weighted distance indicator in Panel B. The coefficient on bilateral distances now becomes significant and has a point-estimate close to -1 which corresponds to the magnitude generally estimated in trade regressions that are based on the gravity model (Meyer and Zignago, 2011, p. 11). We also observe that the estimated border effect decreases compared to Panel A, supporting the conjecture made by Head and Mayer (2002) that measuring geographical distance by the distance between capital cities inflates the border effect. More importantly, we find that, when including a weighted measure of distance in the specification, the point estimates of the coefficients on DtS trust decrease. In fact, the positive OLS estimates reported in columns (1) to (3) of Panel B are insignificant.
Next, we apply the IV approach proposed by GSZ as DtS trust seems to be
cor-related with the error term.20 When instrumented with both the measure of religious
similarity and the measure of somatic distance used in GSZ, the coefficient on DtS
trust becomes significant at the 5 percent level (column (4)).21 It suggests that an
in-crease in DtS trust of one standard deviation inin-creases aggregated commodity export flows on average by 24 percent which is more than six times the effect predicted by the OLS estimate. This large jump might simply reflect the fact that we accounted for endogeneity bias. However, we need to examine the validity of the applied IV approach before concluding that it represents the true causal relationship of interest. In fact,
19Compare to Table IV in GSZ (pp. 1116f).
20We verify the endogeneity of bilateral trust with a control function approach (see Wooldridge, 2010, p. 127) and perform an endogeneity test that is robust to arbitrary heteroskedasticity, following Baum, Schaffer and Stillman (2007). Both tests allow us to reject the null hypothesis at conventional levels which states that bilateral trust is exogenous.
21This IV approach reports the efficient generalized method of moments (GMM) estimates and the cluster-robust standard errors.
OLS OLS OLS IV-SR IV-S OLS-RF
(1) (2) (3) (4) (5) (6)
Panel A: Distance between Capital Cities
DtS trust 0.37* 0.29 0.28 1.27*** 1.50*** (0.21) (0.20) (0.20) (0.38) (0.50)
Common language 0.45** 0.26 0.25 0.15 0.17 0.30* (0.21) (0.16) (0.17) (0.15) (0.15) (0.16) Distance between capitals (log) -0.05 -0.26 -0.24 -0.32* -0.30* -0.22 (0.19) (0.18) (0.18) (0.16) (0.17) (0.17) Common border 0.49*** 0.42*** 0.41*** 0.37*** 0.38*** 0.34***
(0.14) (0.12) (0.12) (0.12) (0.12) (0.12) Press coverage 1.37 0.57 0.66 1.57 1.21 0.81
(1.12) (1.11) (1.12) (0.96) (1.05) (1.17) Transportation costs (log) -4.41** -1.82 -1.82 -0.09 -0.43 -1.43 (1.97) (1.90) (1.85) (1.65) (1.72) (1.82) Same legal origin 0.45*** 0.39** 0.32** 0.38** 0.34** (0.14) (0.15) (0.14) (0.16) (0.15) Linguistic common roots 0.25 0.17 0.11 0.12
(0.31) (0.27) (0.29) (0.30)
Religious similarity -0.19 0.05
(0.22) (0.16)
Somatic Distance used in GSZ -0.09***
(0.03) Relevance K-P rk LM Statistic 17.91 16.5 (p-value) (0.00) (0.00) Weak Identification K-P rk Wald Statistic 17.05 26.03 Over-identification Hansen J -Stat 0.780 (p-value) (0.38)
Panel B: Population-Weighted Distance Measure
DtS trust 0.27 0.13 0.13 0.85** 0.96** (0.18) (0.17) (0.17) (0.35) (0.47)
Common language 0.38** 0.24** 0.25** 0.25** 0.24** 0.30** (0.16) (0.11) (0.12) (0.10) (0.10) (0.12) Weighted Distance (log) -0.88*** -1.03*** -1.04*** -0.94*** -0.91*** -0.99***
(0.25) (0.22) (0.23) (0.24) (0.25) (0.23) Common border 0.29*** 0.24** 0.24** 0.25*** 0.26*** 0.21** (0.11) (0.10) (0.10) (0.09) (0.10) (0.10) Press coverage 0.13 -1.01 -1.06 -0.34 -0.42 -0.80 (1.05) (0.95) (0.96) (0.89) (0.93) (0.98) Transportation costs (log) 0.42 2.27 2.31 2.48 2.27 2.49
(1.91) (1.66) (1.68) (1.57) (1.68) (1.66) Same legal origin 0.45*** 0.47*** 0.41*** 0.42*** 0.42***
(0.10) (0.13) (0.13) (0.13) (0.13) Linguistic common roots -0.07 -0.11 -0.11 -0.15 (0.32) (0.28) (0.28) (0.31)
Religious similarity -0.06 0.11
(0.19) (0.14)
Somatic Distance used in GSZ -0.06*
(0.03) Relevance K-P rk LM Statistic 16.95 14.65 (p-value) (0.00) (0.00) Weak Identification K-P rk Wald Statistic 16.93 22.99 Over-identification Hansen J -Stat 0.13 (p-value) (0.72) Observations 679 679 679 679 679 679 R-squared 0.97 0.97 0.98 0.97 Table 2 Trade Regression
Notes . The dependent variable is the natural logarithm of aggregated export flows from country s to country d (UNComtrade). DtS Trust measures the average
trust that citizens in importing country d grant citizens in exporting country s (Eurobarometer Surveys). Somatic distance is the measure used in GSZ which sums the absolut value of the difference in the hair color, height, and cephalic index. All equations include countr-year dummies. The Kleibergen-Paap rk LM and Wald
both measures of cultural proximity of country-pairs are significant in the first-stage regression. Bilateral trust seems to increase with religious similarity and decrease when physical dissimilarities between two countries become more important. The -value of the Kleibergen-Paap LM Statistic also suggests that the instruments are jointly
sig-nificant in the first stage of the 2SLS regression.22 In addition, the Wald statistic based
on the Kleinbergen-Paap statistic is larger than 10, indicating a sufficiently "strong" correlation between the instruments and DtS trust in order not to worry about weak
identification problems.23 Finally, the instruments pass the Hansen -test intended to
verify their exogeneity, i.e. that the instruments only affect the dependent variable through the trust channel.
The standard statistical tests hence suggest that the IV strategy used by GSZ is valid. Nevertheless, we suspect religious similarity to affect international trade also through other channels than bilateral trust. This sheds doubts on the results presented in column (4) and also on the over-identification test, as the latter is only reliable when the instruments are valid (Murray, 2006). Therefore, we estimate an alternative specification which includes religious similarity as a covariate and where the exogenous variation of bilateral trust is captured with a single instrument, the indicator of somatic distance used in GSZ. The results of estimating this specification are presented in column (5). The coefficient on DtS trust slightly increases and the significance is unchanged, compared to column (4).
We further estimate the corresponding reduced-form equation of the dependent variable. This equation is "derived by substituting the first-stage equation into the 22The Kleibergen-Paap LM Statistic is the efficient first-stage statistic used to verify the relevance of the instruments when non-i.i.d. disturbances are assumed. Rejection of the null hypothesis suggest that the model is identified, i.e. that the instruments are relevant.
23In the presence of i.i.d. disturbances, weak identification problems are detected with the Cragg-Donald F -statistic which is compared to the critical values published by Stock and Yogo (2005). However, in case of non-i.i.d. disturbances, the Kleinbergen-Paap Wald statistic is the efficient statistic (Kleibergen and Paap, 2006; Kleibergen and Schaffer, 2007; Baum, 2007). So far, no critical values have been computed for this statistic and in practice it is usually compared to the threshold number of 10 recommended by Staiger and Stock (1997); see also Stock, Wright and Yogo (2002). As a robustness test, we compute the limited information maximum likelihood (LIML) estimates of all our 2SLS regressions and find that the bilateral trust coefficients only slightly change in their size and that the levels of statistical significance are identical to the IV/GMM estimates. The results of this robustness analysis are available in an online appendix (Tables A.1 - A.3).
causal relation of interest" (Angrist and Pischke, 2009, p. 121).24 The first-stage
regression is
= 0+ 1 + X0 + + + (2)
where is the indicator of somatic distance between country and country and
X0
contains all time-invariant bilateral exogenous covariates including the proxy for
religious similarity. Substituting (2) into (1) and rearranging terms we find
() = (0+ 10) + 11+ (1 + )X0+ (1+ 1)+
(1+ 1)+ (1+ )
≡ 0+ 1+ X0 + ˆ+ ˆ+ (3)
ˆ
and ˆ are time varying national dummies, and is the error term. If the
exclusion restriction is satisfied, then, by assumption, all variables in equation (3) are
orthogonal to the error term . This implies that OLS consistently estimates the
coefficients and that testing whether 1 ≡ 11 = 0 is an alternative way of testing
the hypothesis that 1 = 0 in equation (1). As Angrist and Pischke (2009, p. 213)
point out, "if you can’t see the causal relation of interest in the reduced form, it’s probably not there". Column (6) reports the results of estimating the reduced-form equation (3). As expected from the second-stage results, we see that the coefficient on somatic distance is significant, though only at the 10 percent level. Furthermore, religious similarity is not correlated with international trade, a finding which comforts us in our decision to estimate an alternative specification that includes the proxy for religious similarity as control variable.
The disadvantage of instrumenting DtS trust with a single instrument is that we have no means to statistically verify its exogeneity anymore. In such situations, Murray (2006) proposes to estimate the regression of interest again, using separately alternative 24See Anderson and Rubin (1949), Dufour (2003), and Chernozhukov and Hansen (2008) for a formal explanation of this alternative test and Angrist and Krueger (1991, 2001) for an application of this method. See also Baum et al. (2007) for an implementation of the Anderson-Rubin test in Stata. This test verifies whether the instruments are significant in the reduced form equation of the dependent variable.
instruments and to observe how the coefficient on the endogenous variable behaves. If this procedure yields estimates that only vary insignificantly from one another, then the credibility of the instrumental variable is strengthened. Such a sensitivity analysis can be performed here as there is a large degree of freedom in constructing a measure of somatic distance. The different indicators of somatic distance described in section 2.2 all capture the physical dissimilarities between two countries and are constructed in a similar fashion. It should therefore not matter for consistent results which one of them is used to capture the exogenous variation of bilateral trust. To examine the robustness of the results reported in Table 2, we hence estimate equation (1) again, keeping the same sample and the same explanatory variables. We vary, however, the measure of somatic distance that we use as instrument for DtS trust. The results of
this sensitivity analysis are reported in Table 3.25
Table 3 is divided in four panels. Panel A reports the results of estimating the first-stage regression and Panel B of estimating the reduced-form equation (3). The IV coefficients without and with religious similarity as explanatory variable are presented in Panel C and Panel D, respectively. Each panel is composed of eight columns which differ in the indicator of somatic distance employed as instrument for DtS trust. We start with the four indicators made available by Guiso et. al (2008a). Columns (1) of Panel B, C and D restate the most important results presented in Table 2 (columns (6), (4) and (5), respectively), where we employ the somatic distance measure actually used in GSZ, i.e. the sum of the absolute values of the difference in hair color, height, and cephalic index (HHC) of two average citizens living in distinct countries. Column (2) is based on a somatic distance measure that additionally considers the differences in the skin color (HHCS). For column (3), the differences in the cephalic index (HHS) are ignored. The measure used for column (4) sums the absolute differences in hair color and height (HH). For columns (5) and (6), we use the measures of somatic distance that we constructed ourselves following the instructions given in Guiso et al. (2008a), 25We only report the coefficients on DtS trust, somatic distance, and religious similarity. Complete tables including the estimates of the coefficients on the control variables are available in an online appendix (Tables B.1 - B.3).
HHC HH HHCS HHS HHC HH HHC HH (1) (2) (3) (4) (5) (6) (7) (8) Somatic distance -0.06*** -0.09*** -0.06*** -0.07*** -0.05*** -0.09*** -0.05*** -0.08*** (0.01) (0.02) (0.01) (0.01) (0.01) (0.02) (0.01) (0.02) Religious similarity 0.18*** 0.15** 0.20*** 0.18*** 0.17*** 0.14** 0.15** 0.15** (0.06) (0.06) (0.06) (0.06) (0.07) (0.06) (0.06) (0.06) Somatic distance -0.06* -0.06 -0.02 -0.01 0.01 -0.04 -0.03 -0.06 (0.03) (0.05) (0.03) (0.04) (0.04) (0.05) (0.03) (0.05) Religious similarity 0.11 0.09 0.12 0.11 0.12 0.09 0.10 0.09 (0.14) (0.14) (0.14) (0.14) (0.14) (0.15) (0.14) (0.14) DtS trust 0.85** 0.69** 0.46 0.35 0.20 0.55 0.55 0.69* (0.35) (0.34) (0.31) (0.35) (0.36) (0.36) (0.37) (0.36) Relevance K-P rk LM Statistic 16.95 23.58 19.89 23.33 18.46 20.40 15.27 20.43 (p-value) (0.00) (0.00) (0.00) (0.00) (0.00) (0.00) (0.00) (0.00) Weak Identification K-P rk Wald Statistic 16.93 21.27 19.95 21.30 13.48 21.58 15.74 20.80 Exogeneity Hansen J -Stat 0.13 0.02 0.06 0.21 0.58 0.01 0.01 0.02 (p-value) (0.72) (0.90) (0.80) (0.65) (0.45) (0.91) (0.91) (0.90) DtS trust 0.96** 0.74 0.39 0.17 -0.17 0.49 0.50 0.75 (0.47) (0.51) (0.44) (0.52) (0.57) (0.59) (0.58) (0.58) Relevance K-P rk LM Statistic 14.65 20.97 17.65 19.93 11.88 16.72 14.74 18.43 (p-value) (0.00) (0.00) (0.00) (0.00) (0.00) (0.00) (0.00) (0.00) Weak Identification K-P rk Wald Statistic 22.99 28.22 27.99 30.45 15.20 27.60 16.50 24.89 R-squared 0.68 0.70 0.72 0.72 0.72 0.71 0.71 0.70 Observations 679 679 679 679 679 679 679 679
Panel A: First-Stage Regression
Table 3
Trade Regression: Instrumenting DtS Trust with Alternative Measures of Somatic Distance
Guiso et al. (2008a) Replication Pop. Density
Dependent Variable: Aggregated Export Flows
Notes . This table presents the coefficients of estimating the first-stage regression (Panel A), the reduced form equation of the dependent
variable (Panel B), the IV/GMM coefficients of estimating equation (1) when DtS trust is instrumented with both variables of cultural proximity of country-pairs (Panel C), and the IV estimates when instrumenting DtS trust only with a measure of somatic distance (Panel D). In each column, we use an alternative indicator of somatic distance as instrument for bilateral trust. In columns (1) to (4) we use the indicators made available by Guiso et al. (2008a), in columns (5) and (6) the indicators elaborated following the instructions given by them, and in columns (7) and (8) the measures that take the population density into account. The columns are labeled with the letters H ,
Dependent Variable: Destination-to-Source Trust
Panel B: Reduced Form Equation of International trade
Dependent Variable: Aggregated Export Flows
Panel C: Second-Stage Estimates using somatic distance and religious similarity as instruments
Dependent Variable: Aggregated Export Flows
first, trying to replicate the measure actually used in GSZ following their instructions
(column (5))26 and, second, disregarding the potentially problematic cephalic index.
Finally, the ones used for the last two columns take the distribution of the population within a country into account, first, by accounting for the cephalic index (column (7)),
and, second, by disregarding it (column (8)).27
According to Panel A of Table 3, the first-stage OLS coefficients on the instrumental variables are significantly different from zero in every column and the point-estimates are similar across the various indicators within a row. Panel C and D present the statistics that give indications on the validity of the instruments. According to these statistics, all the instruments are equally relevant, exogenous, and strong. Therefore, one may expect to find similar results in the reduced form and in the second stage, no matter which IV strategy we choose to apply. However, this is not what we ob-serve. When estimating the reduced-form equation (2), according to Panel B, we find a significant coefficient on somatic distance only in column (1) where we employ the original indicator of GSZ. Consequently, the only IV coefficients on DtS trust that are significant in Panel C and in Panel D are the ones instrumented with the somatic distance measure employed by GSZ. As soon as we use an alternative measure of so-matic distance as instrument (columns (2)-(8)), the significance of the trust coefficients disappears and the magnitude decreases and even becomes negative.
The fact that DtS trust does not remain significant in the trade regression when we instrument it with alternative measures of somatic distance that are equally valid suggests that there is no causal relationship between bilateral trust and international trade. The significant coefficient on DtS trust found in GSZ and in column (1) of Table
3 might result from a statistical type 1 error, i.e. the null hypothesis 1 = 0 is rejected
although it applies.
In the next section, we use a similar framework to analyze the causal relationship between bilateral trust and international migration. Applying the same sensitivity analysis, we investigate the effects of both DtS and StD trust.
26For several country-pairs, we did not manage to do so which may explain the diverging results. 27Recall the discussion in section 2.2.
3
Bilateral Trust and International Migration
As exposed earlier, we have reasons to suspect bilateral trust to affect international migration. StD trust might influence the way expectations on costs and benefits of moving abroad are shaped while DtS trust may, for example, affect immigration policies in the destination countries. These two measures of bilateral trust are highly correlated. Therefore, in order to separately estimate the effect that StD trust and DtS trust have on international migration, we need to define two specifications:
() = 0+ 1+ 2∆+ X0 + + + (4)
() = 0+ 1+ 2∆+ X0 + + + (5)
where the dependent variable, denoted by (), is the natural logarithm of the
(gross) immigration flows from country-of-origin to country-of-destination in period
. and stand for the StD and DtS trust observed in year , respectively.
∆measures the percentage difference in the gross domestic product (GDP) per
capita of two countries. We use this variable as a proxy for the wage differential between
a country-pair. X0
is a vector of bilateral time-invariant variables, and are
country-year fixed effects, and and are mean-zero random variables accounting
for random shocks.
To estimate these specifications, we use data on immigration flows collected by Ortega and Peri (2009, 2011). They merged and harmonized data sets gathered by Mayda (2010), the United Nations, and the OECD (International Migration Database, IMD) to establish an unbalanced panel of annual data on bilateral gross immigration flows into 30 OECD countries from 1946 to 2008. This unique dataset details the legal entry of foreign citizens who wish to be residents in an OECD country. Consistency is ensured by verifying that immigrants are always defined on the same basis across the database for each destination country. To complete the dataset, Ortega and Peri
(2009, 2011) interpolate observations in a limited number of cases28 and compute the
net immigration flows. They correct for the outflow of foreign citizens using the IMD and the dataset on emigration stocks for the years 1990 and 2000 collected by Docquier, Lowell and Marfouk (2007), who count as migrant all foreign-born individuals aged 25+ that live in a OECD country and class the emigrants by educational attainment and
gender.29 However, these net immigration flows are less precise than the gross flows
and only have a limited coverage. We therefore focus on the analysis of the impact of bilateral trust on gross inflows of foreign nationals. The other variables are identical to the ones used in the trade setting.
Panel B of Table 1 reports the summary statistics of the sample used to analyze the relationship between international migration and StD trust, and Panel C to regress international migration on DtS trust. The number of observations varies across panels because of missing data. We again focus on observations for European countries in the years for which we have data on bilateral trust.
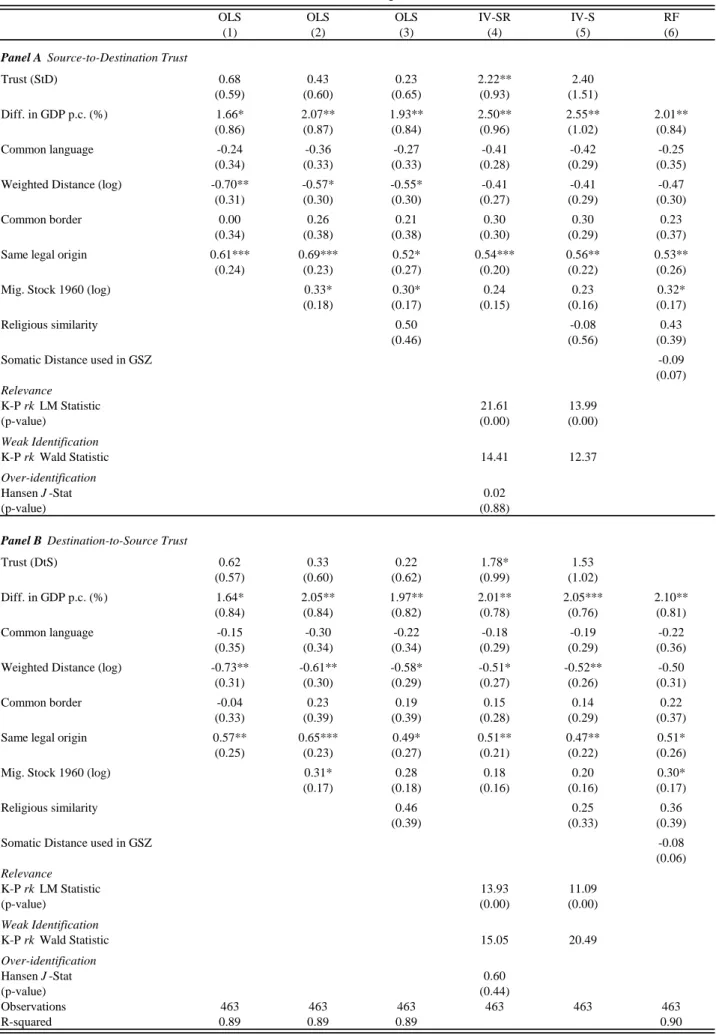
The results from estimating equations (4) and (5) are reported in Panel A and Panel B of Table 4, respectively. The first three columns present standard OLS esti-mates. They suggest that a one percent increase in the difference in GDP per capita increases immigration flows on average by approximately two percent. This positive and significant effect is in line with the notion, typically supported by the data, that international wage differentials affect migration patterns. We also find that geograph-ical distance between countries has a significant and negative effect on the dependent
variable.30 Sharing the legal origin has a positive effect.
The main finding from columns (1)-(3) is the absence of a significant correlation between bilateral trust and immigration flows. In Column (1) of Panel A, the coefficient on StD trust is positive but rather small and not significantly different from zero. In Column (2), we include an indicator of the existing diaspora in the destination countries. Beine et al. (2011) showed that an increase in the past stock of migrants the observations are available.
29The dataset can be downloaded from Frédéric Docquier’s Homepage under
http://perso.uclouvain.be/frederic.docquier/oxlight.htm
30In this section, we always include the measure of weighted distance provided by Mayer and Zignago (2011).
OLS OLS OLS IV-SR IV-S RF
(1) (2) (3) (4) (5) (6)
Panel A Source-to-Destination Trust
Trust (StD) 0.68 0.43 0.23 2.22** 2.40 (0.59) (0.60) (0.65) (0.93) (1.51) Diff. in GDP p.c. (%) 1.66* 2.07** 1.93** 2.50** 2.55** 2.01** (0.86) (0.87) (0.84) (0.96) (1.02) (0.84) Common language -0.24 -0.36 -0.27 -0.41 -0.42 -0.25 (0.34) (0.33) (0.33) (0.28) (0.29) (0.35)
Weighted Distance (log) -0.70** -0.57* -0.55* -0.41 -0.41 -0.47
(0.31) (0.30) (0.30) (0.27) (0.29) (0.30)
Common border 0.00 0.26 0.21 0.30 0.30 0.23
(0.34) (0.38) (0.38) (0.30) (0.29) (0.37)
Same legal origin 0.61*** 0.69*** 0.52* 0.54*** 0.56** 0.53**
(0.24) (0.23) (0.27) (0.20) (0.22) (0.26)
Mig. Stock 1960 (log) 0.33* 0.30* 0.24 0.23 0.32*
(0.18) (0.17) (0.15) (0.16) (0.17)
Religious similarity 0.50 -0.08 0.43
(0.46) (0.56) (0.39)
Somatic Distance used in GSZ -0.09
(0.07) Relevance K-P rk LM Statistic 21.61 13.99 (p-value) (0.00) (0.00) Weak Identification K-P rk Wald Statistic 14.41 12.37 Over-identification Hansen J -Stat 0.02 (p-value) (0.88)
Panel B Destination-to-Source Trust
Trust (DtS) 0.62 0.33 0.22 1.78* 1.53 (0.57) (0.60) (0.62) (0.99) (1.02) Diff. in GDP p.c. (%) 1.64* 2.05** 1.97** 2.01** 2.05*** 2.10** (0.84) (0.84) (0.82) (0.78) (0.76) (0.81) Common language -0.15 -0.30 -0.22 -0.18 -0.19 -0.22 (0.35) (0.34) (0.34) (0.29) (0.29) (0.36)
Weighted Distance (log) -0.73** -0.61** -0.58* -0.51* -0.52** -0.50
(0.31) (0.30) (0.29) (0.27) (0.26) (0.31)
Common border -0.04 0.23 0.19 0.15 0.14 0.22
(0.33) (0.39) (0.39) (0.28) (0.29) (0.37)
Same legal origin 0.57** 0.65*** 0.49* 0.51** 0.47** 0.51*
(0.25) (0.23) (0.27) (0.21) (0.22) (0.26)
Mig. Stock 1960 (log) 0.31* 0.28 0.18 0.20 0.30*
(0.17) (0.18) (0.16) (0.16) (0.17)
Religious similarity 0.46 0.25 0.36
(0.39) (0.33) (0.39)
Somatic Distance used in GSZ -0.08
(0.06) Relevance K-P rk LM Statistic 13.93 11.09 (p-value) (0.00) (0.00) Weak Identification K-P rk Wald Statistic 15.05 20.49 Over-identification Hansen J -Stat 0.60 (p-value) (0.44) Observations 463 463 463 463 463 463 R-squared 0.89 0.89 0.89 0.90
Notes . The dependent variable is the natural logarithm of the migration flows from country s to country d (Ortega and Peri, 2009, 2011). Trust (StD)
measures the average trust that citizens in country s grant citizens in country d , and Trust (DtS) is the reciprocal trust (Eurobarometer Surveys). Somatic distance is the measure used in GSZ which sums the absolute value on the difference in the hair color, height, and cephalic index. All equations include country-year dummies. Robust standard errors are reported in parentheses, which are clustered at the country-pair. Coefficients are statistically different from zero at
Table 4 Determinants of Migration
in a country raises migration flows, possibly because a larger diaspora reduces costs and risks migrants face when moving abroad. We capture such network effects by a proxy for the emigration stocks in 1960 as employed in Grossmann and Stadelmann (2012). This variable ensures a lag of at least 10 years that exists between the proxy and the observations included in our regression. It is itself significant and positive, as found in previous studies. Adding it decreases the coefficient of StD trust which is still statistically insignificant. We observe the same pattern when including religious similarity as control variable in column (3): it halves the coefficient of StD trust and slightly increases its standard error. The OLS estimates hence suggest that StD trust is not significantly related to international migration.
We next, again, apply the IV estimation proposed in GSZ and perform a sensitivity analysis to examine whether the IV strategies follow a similar pattern in the migration setting as they followed in the trade setting. Using the somatic distance measure as employed in GSZ and religious similarity as instruments, the coefficient on StD trust strongly increases compared to the OLS estimates and becomes significantly different from zero at the five percent level (column (4)). The employed instruments pass the Hansen -test. The Kleinbergen-Paap statistics suggest that they are relevant and strong. Nevertheless, like for Table 2, there are several reasons to regard the results in column (4) with caution. First, the IV estimate on StD trust is five times larger than the OLS counterpart. It suggests that an increase in StD trust of one standard deviation increases gross immigration flows on average by 66 percent, which is a surprisingly large effect in view of the OLS estimate. Second, religious similarity may affect international migration not exclusively through the trust channel. Finally, the previous section suggests that the coefficient on bilateral trust might not be robust to the use of alternative measures of somatic distance as instruments.
To address these concerns, we first estimate an alternative specification which in-cludes the proxy for religious similarity as explanatory variable. Column (5) reports the results when we employ the indicator of somatic distance used in GSZ as sole in-strumental variable. The IV coefficient on StD trust is similar in magnitude but it
loses its significance. Column (6) reports the results from estimating a reduced-form equation analogously to (3). It suggests that neither somatic distance nor religious sim-ilarity are correlated with international migration in the reduced form. This absence of correlation between the instrumental variables and the dependent variable as well as the insignificant coefficients found in columns (1)-(3) raise doubts on the finding in column (4) that StD trust affects a migrant’s decision to move abroad.
In Panel B of Table 4, the relationship between DtS trust and international mi-gration is similar to the one observed in Panel A between StD trust and international migration. In columns (1)-(3), the OLS estimates of the coefficient of DtS trust are positive but not statistically significant. Instrumenting DtS trust with indicators of religious similarity and somatic distance in column (4) yields significant results, here at the ten percent level, that are more than five times larger than their OLS counter-parts. They suggest that an increase of DtS trust of one standard deviation increases immigration flows on average by 56 percent. However, according to column (5), when including religious similarity as a covariate of migration rather than as an instrument for trust, the coefficient on DtS trust becomes insignificant. Moreover, also similar to Panel A, column (6) shows that the correlation between the instruments and interna-tional migration is again insignificant in the reduced-form equation.
In view of these inconclusive results with respect to the relationship between bilat-eral trust and international migration, we again exploit the fact that there is a large degree of freedom in the definition of somatic distance and estimate regressions (4) and (5) with the same covariates and the same sample again, only changing the somatic distance indicator which we use as instrument. The results of this analysis are reported in Table 5 for the relationship between international migration and StD trust, and in Table 6 for its relationship with DtS trust.
In columns (1) of Panels B, C and D of Table 5 we restate the most important results of Panel A in Table 4 (columns (6), (4) and (5), respectively). Panel A of Table 5 additionally reports the first-stage coefficients on somatic distance and religious similarity when we regress StD trust on all included and excluded exogenous variables.
HHC HH HHCS HHS HHC HH HHC HH (1) (2) (3) (4) (5) (6) (7) (8) Somatic distance -0.04*** -0.06*** -0.04*** -0.05*** -0.03** -0.06*** -0.04*** -0.06*** (0.01) (0.01) (0.01) (0.01) (0.01) (0.01) (0.01) (0.01) Religious similarity 0.21*** 0.18*** 0.21*** 0.18*** 0.21*** 0.16** 0.20*** 0.17** (0.07) (0.06) (0.07) (0.06) (0.08) (0.07) (0.07) (0.07) Somatic distance -0.09 -0.09 0.01 0.03 0.01 -0.02 -0.08 -0.07 (0.07) (0.08) (0.06) (0.08) (0.07) (0.10) (0.07) (0.09) Religious similarity 0.43 0.41 0.58 0.60 0.58 0.53 0.42 0.44 (0.39) (0.40) (0.43) (0.45) (0.45) (0.46) (0.40) (0.41) StD trust 2.22** 1.84** 0.95 0.83 1.27 1.25 2.00** 1.71* (0.93) (0.80) (0.83) (0.79) (0.85) (0.81) (0.89) (0.82) Relevance K-P rk LM Statistic 21.61 25.88 24.39 26.94 21.68 24.99 20.80 24.69 (p-value) (0.00) (0.00) (0.00) (0.00) (0.00) (0.00) (0.00) (0.00) Weak Identification K-P rk Wald Statistic 14.41 16.10 18.64 19.19 12.54 17.59 14.74 17.68 Exogeneity Hansen J -Stat 0.02 0.07 1.79 2.12 0.90 0.90 0.01 0.17 (p-value) (0.88) (0.80) (0.18) (0.15) (0.34) (0.34) (0.93) (0.68) StD trust 2.40 1.60 -0.33 -0.47 -0.36 0.24 1.89 1.28 (1.51) (1.23) (1.30) (1.23) (1.79) (1.36) (1.50) (1.33) Relevance K-P rk LM Statistic 13.99 22.52 20.47 23.71 8.23 17.72 17.50 19.50 (p-value) (0.00) (0.00) (0.00) (0.00) (0.00) (0.00) (0.00) (0.00) Weak Identification K-P rk Wald Statistic 12.37 18.11 19.65 23.80 5.54 18.62 12.85 19.30 Observations 450 450 450 450 450 450 450 450
Notes . This table presents the coefficients of estimating the first-stage regression (Panel A), the reduced form equation of the
dependent variable (Panel B), the IV/GMM coefficients of estimating equation (3) when StD trust is instrumented with both variables of cultural proximity of country-pairs (Panel C), and the IV estimates when instrumenting StD trust only with a measure of somatic distance (Panel D). In each column, we use an alternative indicator of somatic distance as instrument for bilateral trust. In columns (1) to (4) we use the indicators made available by GSZ, in columns (5) and (6) the indicators elaborated following the instructions given by Guiso et al. (2008a), and in columns (7) and (8) the measures that take the population density into account. The columns are labeled with the letters H , C , and S : H stands for height and hair, C for cephalic index, and S for skin. The coefficients of the control variables (the same as in Table 2) are not reported. Cluster-robust standard errors are reported in parentheses and the coefficients are statistically different from zero at the ***1%, **5%, and *10% level.
Panel C: Second-Stage Estimates using somatic distance and religious similarity as instruments
Dependent Variable: International Immigration Flows
Panel D: Second-Stage Estimates using Somatic Distance as Instrument
Table 5
Migration Regression: Instrumenting StD Trust with Alternative Measures of Somatic Distance
Guiso et al. (2008a) Replication Pop. Density
Panel A: First-Stage Regression
Dependent Variable: Source-to-Destination Trust
Panel B: Reduced Form Equation of International Migration
Dependent Variable: International Immigration Flows
As in the case where international trade flows are the dependent variable at the second stage, we observe that the various measures of somatic distance are equally significant at the first stage and that the coefficients are similar across the different columns. However, that none of these indicators are correlated with international migration in the reduced-form equation (Panel B) suggests that StD trust does not have a causal impact on international migration.
Panel C reports second-stage results for the case where the eight measures of somatic distance are used as instruments jointly with religious similarity. Whereas second-stage estimates for the coefficients on StD trust are significant in columns (1), (2), (7) and (8), they are insignificant in the other columns. Given the questionable validity of religious similarity as instrumental variable for bilateral trust, in Panel D, we report the trust coefficients when instrumenting StD trust solely with the measures of somatic distance (again including religious similarity as a control variable). Consistent with the results found in panel B, none of the estimations yield statistically significant coefficients and some even have a negative sign. Interestingly, the point estimate is again highest and economically (though not statistically) most significant when using the somatic distance measure originally used by GSZ as an instrument for StD trust.
Regarding the effect of DtS trust on migration, Table 6 provides a sensitivity analy-sis of the results in Panel B of Table 4. Column (1) of Panels B, C and D of Table 6 restate the most important results. According to Panel A of Table 6, all indicators of somatic distance significantly affect DtS trust at the five percent level. However, again, none of them are correlated with international migration in the reduced-form equation (Panel B). Panel C reports the IV estimates when using somatic distance and religious similarity as instruments for DtS trust. Analogously to the results found in Panel C of Table 5, we see that the tests suggest that the instruments are relevant and exogenous. Moreover, the coefficients on instrumented DtS trust are sometimes significant at the second stage. However, according to Panel A, the indicator of religious similarity is not correlated with DtS trust and, as repeatedly mentioned, a potentially problematic instrument. Panel D of Table 6 shows the second-stage estimates when instrumenting