Design of radiation resistant metallic
multilayers for advanced nuclear systems
The MIT Faculty has made this article openly available.
Please share
how this access benefits you. Your story matters.
Citation
Zhernenkov, Mikhail, Simerjeet Gill, Vesna Stanic, Elaine DiMasi,
Kim Kisslinger, J. Kevin Baldwin, Amit Misra, M. J. Demkowicz, and
Lynne Ecker. “Design of Radiation Resistant Metallic Multilayers for
Advanced Nuclear Systems.” Appl. Phys. Lett. 104, no. 24 (June 16,
2014): 241906. © 2014 AIP Publishing LLC
As Published
http://dx.doi.org/10.1063/1.4883481
Publisher
American Institute of Physics (AIP)
Version
Final published version
Citable link
http://hdl.handle.net/1721.1/94508
Terms of Use
Article is made available in accordance with the publisher's
policy and may be subject to US copyright law. Please refer to the
publisher's site for terms of use.
Design of radiation resistant metallic multilayers for advanced nuclear systems
Mikhail Zhernenkov, Simerjeet Gill, Vesna Stanic, Elaine DiMasi, Kim Kisslinger, J. Kevin Baldwin, Amit Misra,
M. J. Demkowicz, and Lynne Ecker
Citation: Applied Physics Letters 104, 241906 (2014); doi: 10.1063/1.4883481 View online: http://dx.doi.org/10.1063/1.4883481
View Table of Contents: http://scitation.aip.org/content/aip/journal/apl/104/24?ver=pdfcov
Published by the AIP Publishing Articles you may be interested in
Focused helium and neon ion beam induced etching for advanced extreme ultraviolet lithography mask repair
J. Vac. Sci. Technol. B 32, 021602 (2014); 10.1116/1.4868027
Radiation Resistance of FluoriteStructured Nuclear Oxides
AIP Conf. Proc. 1099, 365 (2009); 10.1063/1.3120053
Raman-active Fröhlich optical phonon mode in arsenic implanted ZnO
Appl. Phys. Lett. 94, 011913 (2009); 10.1063/1.3067997
Radiation damages on permanent magnets : challenges for the future light sources
AIP Conf. Proc. 705, 282 (2004); 10.1063/1.1757789
Influence of microwave energy on semiconductors during ion implantation process
Design of radiation resistant metallic multilayers for advanced nuclear
systems
Mikhail Zhernenkov,1,a),b)Simerjeet Gill,1,a),b)Vesna Stanic,1,c)Elaine DiMasi,1 Kim Kisslinger,1J. Kevin Baldwin,2Amit Misra,2M. J. Demkowicz,3and Lynne Ecker1
1
Brookhaven National Laboratory, Upton, New York 11973, USA
2
Los Alamos National Laboratory, Los Alamos, New Mexico 87545, USA
3
Department of Materials Science and Engineering, Massachusetts Institute of Technology, Cambridge, Massachusetts 02139, USA
(Received 20 May 2014; accepted 2 June 2014; published online 17 June 2014)
Helium implantation from transmutation reactions is a major cause of embrittlement and dimensional instability of structural components in nuclear energy systems. Development of novel materials with improved radiation resistance, which is of the utmost importance for progress in nuclear energy, requires guidelines to arrive at favorable parameters more efficiently. Here, we present a methodology that can be used for the design of radiation tolerant materials. We used synchrotron X-ray reflectivity to nondestructively study radiation effects at buried interfaces and measure swelling induced by He implantation in Cu/Nb multilayers. The results, supported by transmission electron microscopy, show a direct correlation between reduced swelling in nanoscale multilayers and increased interface area per unit volume, consistent with helium storage in Cu/Nb interfaces in forms that minimize dimensional changes. In addition, for Cu/Nb layers, a linear relationship is demonstrated between the measured depth-dependent swelling and implanted He density from simulations, making the reflectivity technique a powerful tool for heuristic material design.VC 2014 AIP Publishing LLC. [http://dx.doi.org/10.1063/1.4883481]
In this Letter, we report that the density of interfaces in a layered nanocomposite correlates to quantitative measures of robustness under ion bombardment: a pivotal discovery for development of radiation hard materials, made available by the nondestructive X-ray reflectivity (XRR) methodology. Surfaces, grain boundaries, and interphase boundaries are sinks for radiation-induced point defects and traps for implanted species such as helium (produced as a transmuta-tion product under neutron irradiatransmuta-tion).1–6 As a result, the evolution of radiation-induced defect agglomerates is differ-ent in the interfacial regions than in the bulk: void-denuded-zones at grain boundaries2,4,7and preferential helium bubble formation at interfacial misfit dislocation intersections8–11 have been observed. In materials with a high density of sinks, such as nanoporous metals with a high surface area12 or nano-lamellar composites, a reduction of radiation-induced-void density has been observed.13Removal of stack-ing fault tetrahedra at twin boundaries has been reported in nanotwinned Ag.14Similarly, in helium ion implanted nano-scale multilayers, such as Cu/Nb, the critical helium concen-tration to observe bubbles increases with decreasing layer thickness and varies with lattice misfit strain between the layers.15,16The rationale for the latter effect is that the lattice misfit strain determines the number density of misfit disloca-tion intersecdisloca-tions in the interface plane that are preferential sites for helium precipitation.11,17,18 In nano-dispersoid-strengthened ferritic alloys as well, recovery of
radiation-induced defects and trapping of nanoscale helium bubbles have been attributed to the oxide-metal interfaces.19–22
It is of utmost importance to control these nanoscale morphologies for the development of robust radiation toler-ant materials for application in extreme environments. To aid material design, transmission electron microscopy (TEM) is typically used. TEM observes multilayer morphol-ogy and can also detect “bubbles.”23–25 In this study, syn-chrotron XRR is used to measure swelling in ion implanted single and multilayered thin films. TEM and XRR provide complementary information on the defect structure locally and averaged over a large sample area, respectively, and in contrast to TEM, XRR is a non-destructive technique. Five types of thin film samples, all with 250 nm nominal thick-ness, were studied: Cu single layer, Nb single layer, Cu/Nb bilayer, [Nb/Cu]6 multilayer, and [Nb/Cu]25 multilayer,
where the subscript numbers 6 and 25 represent the total number of Nb/Cu bilayers deposited on the Si substrate. For each sample, XRR measurements were performed in the as-deposited and helium implanted conditions. In addition to XRR, the internal structure of [Nb/Cu]25 multilayer was
investigated by TEM. The He ion distribution for [Nb/Cu]6
and [Nb/Cu]25 multilayers was simulated by Stopping and
Range of Ions in Matter (SRIM). He ion implantation was performed at the Ion Beam Materials Laboratory at Los Alamos National Laboratory at room temperature with ion energy of 33 keV to a fluence of 1.5! 1017ions/cm2. During the implantation, ion beam heating did not exceed 15 K.26 Under these beam conditions, He ions will produce approxi-mately 6–9 dpa in Cu and/or Nb at peak He concentrations.27 The details of sample preparation, TEM measurements, SRIM, and XRR technique and related analysis can be found in Ref. 28. The XRR data and corresponding fitting curves
a)Authors to whom correspondence should be addressed. Electronic
addresses: [email protected] and [email protected].
b)
M. Zhernenkov and S. Gill contributed equally to this work.
c)
Present address: Brazilian Synchrotron Light Laboratory, Campinas, Brazil.
0003-6951/2014/104(24)/241906/4/$30.00 104, 241906-1 VC2014 AIP Publishing LLC
for pre- and post-implanted samples are shown in Fig. 1. Scattering Length Density (SLD) profiles28are presented in Fig.2, and the model parameters are summarized in Table S1.28
As can be seen from the data fit parameters (see Table S128) and direct comparison of SLD profiles (solid black and dashed red lines in Fig.2), the thickness of the single Cu and single Nb layer increased by"7% and "12%, respectively, after He implantation. A very similar result was obtained for the Cu/Nb bilayer, whose total thickness increased by "12%, while the interfacial roughness did not change significantly.
With the progression to much thinner layers, the results are dramatically different from the above. For [Nb/Cu]6
multi-layer, the total thickness (see Table S1) of the structure increased just 4.7%. From the SLD profile (see Fig. 2 and Table S1), we observe that the maximum swelling of the nano-composite takes place in the middle of the Nb/Cu structure, and the swelling profile is consistent with the SRIM simulated implanted He distribution inside the sample (Fig.3). At the
same time, the interfacial roughness averaged over all interfa-ces increased from 2.18 to 2.44 nm or about 12%.
Remarkably, for [Nb/Cu]25 multilayer, the total
thick-ness of the sample increased by a miniscule 0.7 nm. The analysis showed that the average thickness of both Nb and Cu layers in the multilayer stack remained the same (see Table S128), and average interfacial roughness increased just 8% from 2.0 to 2.1 nm. This important result signifies that the morphology of [Nb/Cu]25multilayer has not been
signifi-cantly changed after He implantation. These findings from XRR are confirmed by TEM observations of [Nb/Cu]25
mul-tilayer. TEM images with superimposed X-ray SLD profiles from XRR are shown in Fig.4. Clearly, the local structure of the multilayer is not significantly altered by He implantation and, more importantly, as we mentioned above, this is also true for the entire sample which is confirmed by SLD profiles shown in the bottom panel of Fig. 2, where pre- and post-implanted real space models are superimposed.
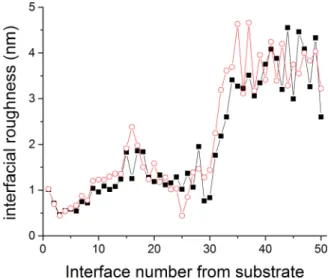
Fig. 5 shows the interfacial roughness for [Nb/Cu]25
multilayer as a function of an interface number before and after He implantation. For the data measured before He im-plantation, the multilayer stack consists of two nominal regions: the “bottom” region (which includes the first thirty
FIG. 1. X-ray reflectivity experimental data (black squares) and corresponding fit curves (red solid lines) for samples as labeled, before (left panel) and after (right panel) He ion implantation. Reflectivity curves for different sam-ples are offset for clarity.
FIG. 2. X-ray SLD profiles obtained from the X-ray reflectivity fits for sam-ples before (black solid lines) and after (red dashed lines) He ion implanta-tion. Zero in the horizontal axis corresponds to Si substrate. Only [Nb/Cu]25
nanocomposite has enough interfaces to sink defects and undergo negligible swelling after He implantation. Blue column charts in [Nb/Cu]6 and
[Nb/Cu]25panels are the corresponding calculated SRIM profiles. The
verti-cal linear sverti-cale for SRIM data is not shown for clarity; the peak He ion den-sity value is 7.5/nm3and 8.4/nm3for [Nb/Cu]
6and [Nb/Cu]25, respectively.
FIG. 3. The swelling of each layer of [Nb/Cu]6 sample as deduced from
reflectivity measurement (black columns associated with bottom X-left Y axes) and SRIM simulated He ion distribution (red solid curve associated with top X-right Y axes) as a function of depth. Layer number is counted from the substrate. Inset: layer swelling deduced from X-ray data as a func-tion of ion density simulated with SRIM; red solid line is the swelling pre-dicted from Eq.(1)using an average number densityn for Cu and Nb.
interfaces) with a small average roughness (1.1 nm) and well defined planar structure close to the Si substrate, and the “top” region (last 20 interfaces) with relatively large rough-ness (3.3 nm) and layers with significant morphological wav-iness. The layer waviness can clearly be seen on the TEM image in Fig.4(a)in the part of the sample close to the sur-face. Remarkably, XRR measurements show that after He implantation the average roughness in the “bottom” region remains unchanged ("1.1 nm) and increases within the “top” region by about 9% from 3.3 to 3.6 nm. Due to the ion im-plantation, He bubbles form across the system. The TEM image (Fig.4(b)) shows that He bubbles (bright spots) are predominantly concentrated in the part of the sample between the 16th interface (white vertical line in Fig.4(b)) and the sample surface, which partially overlaps with the “bottom” region. This He concentration is consistent with the SRIM simulation (red solid line in Fig. 4(b)) superim-posed on top of TEM image. Although the He bubbles are present in the part of the sample with well-defined planar structure (part of the “bottom” region), it is clear from TEM that the next 10–12 layers following the 16th interface are not damaged by He ions, which reinforces the XRR findings and signifies that the multilayer is capable of trapping He at interfaces with minimal swelling.
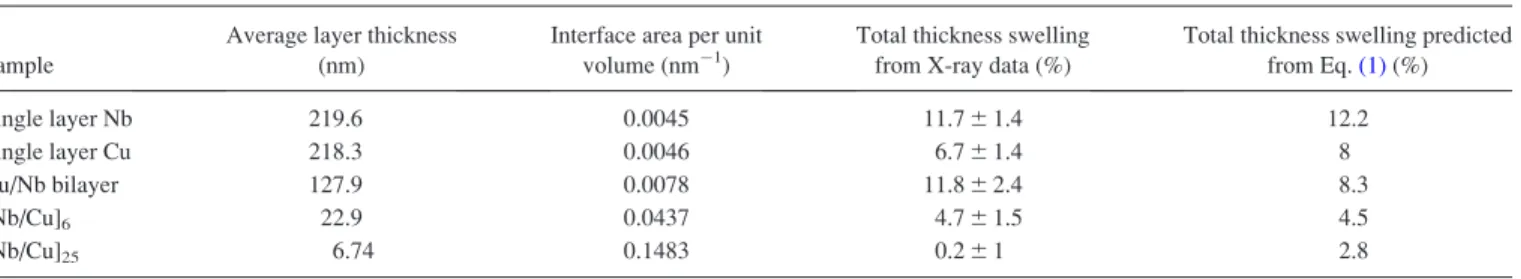
This study enabled us to survey a wide range of inter-face area per unit volume—from 0.005 nm#1in single layer metals to 0.15 nm#1in the thinnest multilayer sample—and relate this to observations of He implantation-induced swel-ling, which ranges from >10% to "0.2%, respectively. These observations are summarized in TableI. The trend can be explained qualitatively using the results of atomistic mod-eling,11 which indicated that in Cu-Nb multilayers He is preferentially stored at misfit dislocation intersections in the interface. It has been shown that the dislocation nodes repre-sent local high energy regions that helium preferentially wets in the form of platelet-shaped cavities in the interface plane.11Only above a certain threshold He concentration, do these platelets transform into nanoscale bubbles that may under some conditions contribute to dimensional increase normal to the interface. In the previous studies,11,16 it was shown that the maximum number of He atoms, which can be stored in platelets at Cu/Nb interface, is 7/nm2. Away from the interface, helium precipitates into spherical, $2 nm di-ameter bubbles that may contribute to swelling. Thus, as the interface spacing decreases to the few nanometer range, much of the helium is trapped at interfaces such that the con-tribution to swelling normal to the interface is decreased, consistent with the trend shown in TableI.
The expected swelling due to He bubbles may be esti-mated based on the He ion implantation data. For simplicity, we use the average volumetric implanted He ion concentra-tionq, rather than the depth-dependent concentration for the first three types of samples, namely, Cu single layer, Nb sin-gle layer, and Cu/Nb bilayer. If all He atoms not stored in interfacial platelets contribute one atomic volume of swel-ling and assuming that all this volume goes into a change of thickness, then the swelling strain may be written as
et¼ ðq # 7=tÞ=n; (1)
where t is the average layer thickness in a sample and n is the average of the number density of pure Cu and Nb. For [Nb/Cu]6and [Nb/Cu]25 samples, a layer-by-layer swelling
calculation based on SRIM simulation has been performed. Using SRIM simulation (Fig. 3and Fig. 4(b)), the He con-centration within each layer was deduced and used in Eq.(1)
instead to calculate the swelling of each layer. Then the sum of thicknesses of individual layers was compared with the sample thickness before He implantation to determine the total swelling. The results are shown in TableI.
FIG. 4. TEM images of [Nb/Cu]25multilayer before (a) and after (b) He ion implantation. The green solid line on each image is the X-ray scattering length
density profile obtained with reflectivity and superimposed to verify the results obtained by both methods. Red solid line in the panel (b) corresponds to the SRIM profile. Note that the reflectivity data align with the region associated with the He (bright spots) in the TEM image post-implantation, showing that these features are representative of the entire film and not just the TEM imaged region.
FIG. 5. Evolution of the interfacial roughness as a function of an interface number obtained from XRR models. Black squares and red open circles cor-respond to the XRR data measured before and after He implantation, respectively.
The resulting swelling values calculated using Eq. (1)
and presented in the last column in TableI, and the inset of Fig.3(for [Nb/Cu]6sample) provide evidence that for first 4
samples the swelling of layers is approximately proportional to the amount of He implanted and also suggest that the swelling is proportional to approximately one atomic volume per He atom. From the 3rd column of TableI, it is also evi-dent that the swelling decreases as the layer thickness reduces. Nonetheless, Eq.(1)does not satisfactorily explain the very low level of swelling in [Nb/Cu]25sample,
predict-ing the swellpredict-ing of 2.8% compared to the measured (0.26 1)%. This suggests the existence of some critical thickness (or critical interface area per unit volume) to observe swelling. However, this mechanism remains to be confirmed by more detailed atomistic simulations as it clearly beyond the reach of a coarse grained analysis and thus it is not possible to discuss the importance of the observed effect any further.
The application of quantitative XRR analysis to inves-tigate layer swelling, in combination with the survey of more than an order of magnitude range in the crucial inter-face density parameter in Cu/Nb multilayers and a simple analytical model (Eq. (1)), proves here to be a powerful methodology. Our study provides pivotal information to explain the behavior of He on metallic interfaces. In partic-ular, we showed that when the number of He atoms exceeds the amount which can be stored in platelets at an interface, then each He atom contributes approximately one atomic volume to the sample swelling and swelling of layers is proportional to the amount of He implanted. Notably, the swelling of layers decreases as the layer thick-ness reduces and beyond a critical thickthick-ness the swelling is suppressed. This mechanism has not been observed before and requires more detailed atomistic simulations. This methodology can be applied to the design and characteriza-tion of radiacharacteriza-tion, chemical, and mechanical damage in other layered materials. Such insights are crucial in the design of reduced swelling nanocomposites for advanced nuclear energy systems.
The National Synchrotron Light Source and the Center for Functional Nanomaterials at Brookhaven National Laboratory are supported under U.S. D.O.E. Grant No. DE-AC02-98CH10886. LANL acknowledges support from DOE, Office of Science, Office of Basic Energy Sciences, Energy Frontier Research Center program Award No. 2008LANL1026. We would like to thank Dr. Y. Q. Wang
for He ion implantation at the Ion Beam Materials Laboratory at Los Alamos National Laboratory.
1
B. N. Singh,Philos. Mag.29, 25–42 (1974).
2P. A. Thorsen, J. B. Bilde-Sørensen, and B. N. Singh, Scr. Mater.
51, 557–560 (2004).
3
Y. Matsukawa and S. J. Zinkle,Science318, 959–962 (2007).
4
S. J. Zinkle and K. Farrell,J. Nucl. Mater.168, 262–267 (1989).
5R. B. Adamson, W. L. Bell, and P. C. Kelly,J. Nucl. Mater.
92, 149–154 (1980).
6
K. Farrell, P. Maziasz, E. H. Lee, and L. K. Mansur,Radiat. Eff. Defects Solids78, 277–295 (1983).
7W. Z. Han, M. J. Demkowicz, E. G. Fu, Y. Q. Wang, and A. Misra,Acta Mater.60, 6341–6351 (2012).
8
Z. Di, X.-M. Bai, Q. Wei, J. Won, R. G. Hoagland, Y.-Q. Wang, A. Misra, B. P. Uberuaga, and M. Nastasi,Phys. Rev. B84, 052101 (2011).
9P. L. Lane and P. J. Goodhew,Philos. Mag. A
48, 965–986 (1983).
10B. N. Singh, T. Leffers, W. V. Green, and M. Victoria,J. Nucl. Mater.
125, 287–297 (1984).
11
A. Kashinath, A. Misra, and M. J. Demkowicz, Phys. Rev. Lett. 110, 086101 (2013).
12E. M. Bringa, J. D. Monk, A. Caro, A. Misra, L. Zepeda-Ruiz, M.
Duchaineau, F. Abraham, M. Nastasi, S. T. Picraux, Y. Q. Wang, and D. Farkas,Nano Lett.12, 3351–3355 (2012).
13W. Han, M. J. Demkowicz, N. A. Mara, E. Fu, S. Sinha, A. D. Rollett, Y.
Wang, J. S. Carpenter, I. J. Beyerlein, and A. Misra, Adv. Mater.25, 6975–6979 (2013).
14
K. Y. Yu, D. Bufford, C. Sun, Y. Liu, H. Wang, M. A. Kirk, M. Li, and X. Zhang,Nat. Commun.4, 1377 (2013).
15M. J. Demkowicz, D. Bhattacharyya, I. Usov, Y. Q. Wang, M. Nastasi,
and A. Misra,Appl. Phys. Lett.97, 161903 (2010).
16
M. J. Demkowicz, A. Misra, and A. Caro,Curr. Opin. Solid State Mater. Sci.16, 101–108 (2012).
17I. J. Beyerlein, A. Caro, M. J. Demkowicz, N. A. Mara, A. Misra, and B.
P. Uberuaga,Mater. Today16, 443–449 (2013).
18
A. Kashinath, P. Wang, J. Majewski, J. K. Baldwin, Y. Q. Wang, and M. J. Demkowicz,J. Appl. Phys.114, 043505 (2013).
19E. A. Marquis, J. M. Hyde, D. W. Saxey, S. Lozano-Perez, V. de Castro,
D. Hudson, C. A. Williams, S. Humphry-Baker, and G. D. W. Smith,
Mater. Today12, 30–37 (2009).
20G. R. Odette, P. Miao, D. J. Edwards, T. Yamamoto, R. J. Kurtz, and H.
Tanigawa,J. Nucl. Mater.417, 1001–1004 (2011).
21
G. R. Odette, M. J. Alinger, and B. D. Wirth,Annu. Rev. Mater. Res.38, 471–503 (2008).
22P. Erhart,J. Appl. Phys.
111, 113502 (2012).
23D. Bhattacharyya, M. J. Demkowicz, Y.-Q. Wang, R. E. Baumer, M.
Nastasi, and A. Misra,Microsc. Microanal.18, 152–161 (2012).
24
Q. M. Wei, Y.-Q. Wang, M. Nastasi, and A. Misra, Philos. Mag.91, 553–573 (2011).
25N. Li, M. Nastasi, and A. Misra,Int. J. Plast.
32–33, 1–16 (2012).
26
T. H€ochbauer, A. Misra, K. Hattar, and R. G. Hoagland,J. Appl. Phys.98, 123516 (2005).
27
X. Zhang, N. Li, O. Anderoglu, H. Wang, J. G. Swadener, T. H€ochbauer, A. Misra, and R. G. Hoagland,Nucl. Instrum. Methods Phys. Res. B261, 1129 (2007).
28
See supplementary material at http://dx.doi.org/10.1063/1.4883481 for sample preparation, TEM measurements, SRIM, and XRR technique and related analysis.
TABLE I. The total thickness swelling and its dependence on the interface area per unit volume for the samples measured by x-rays and calculated using Eq.
(1). Average layer thicknesses in the 1st column are taken from Table S1.28
Sample
Average layer thickness (nm)
Interface area per unit volume (nm#1)
Total thickness swelling from X-ray data (%)
Total thickness swelling predicted from Eq.(1)(%) Single layer Nb 219.6 0.0045 11.76 1.4 12.2 Single layer Cu 218.3 0.0046 6.76 1.4 8 Cu/Nb bilayer 127.9 0.0078 11.86 2.4 8.3 [Nb/Cu]6 22.9 0.0437 4.76 1.5 4.5 [Nb/Cu]25 6.74 0.1483 0.26 1 2.8