DEFECT STRUCTURES, PHASE RELATIONS AND PHASE TRANSFORMATIONS OF LOW TEMPERATURE IRON SULFIDE COMPOUNDS
by
THAO ANH NGUYEN
S.B., Mathematics and Physics, Boston College (1981)
SUBMITTED IN PARTIAL FULFILLMENT OF THE REQUIREMENTS OF THE DEGREE OF
DOCTOR OF PHILOSOPHY IN MATERIALS SCIENCE
at the
MASSACHUSETTS INSTITUTE OF TECHNOLOGY June 1987
0 Massachusetts Institute of Technology 1987
Signature of Author
Signature redacted
Signatu
Department d J+terials Science and Engineering
re
redacted
May 1,
1987
Certified by.Signatu
re redacted
Linn W. Hobbs Thesis Supervisor Accepted by Samuel N. Allen Chairman, Departmental Committee on Graduate Students MASSACHUSETTS INSlT UTEOF TECHNOLOGY
DEFECT STRUCTURES, PHASE RELATIONS AND PHASE TRANSFORMATIONS OF LOW TEMPERATURE IRON SULFIDE COMPOUNDS
by
THAO ANH NGUYEN
Submitted to the Department of Materials Science and Engineering on May 1, 1987 in partial fulfillment of the requirements for
the Degree of Doctor of Philosophy in Materials Science ABSTRACT
The structures, phase relations and phase transformations of pyrrhotite, Fe.xS, in the composition and temperature ranges from FeS to F%.925 and from 298 K to 550 K have been investigated by a series of In slu heating and cooling
experiments, conventional and high resolution transmission electron microscopies and electron and x-ray diffraction.
A phase diagram has been constructed from the results of the /n s/lu heating
experiments and electron and x-ray diffraction studies. This phase diagram differs significantly from the phase diagrams reported in the literature. We have found two solvuses in the composition range of FeS and Fe0.92S. The first solvus separates the Fe1xS () phase and a two-phase mixture of FeS (2C) and Fe1_S (U). The second
solvus demarcates the L and IC phases. The K phase has an incommensurate superstructure. The positions of the superstructure reflections of the
K
phase vary with composition and temperature. The iron vacancies in theK
phase appear to order locally in the iron planes.From a series of In s/lu cooling experiments, the phase transformation mechanism of reaction Fe1xS (U) --- FeS (2C) + Fel-xiS (C) (x < x') has been found to be nucleation and growth. The growth rate of the length of lent icular-shape FeS precipitates obeys a linear rate law. The growth rate appears to be controlled by the interfacial reaction. The growth rate of the side walls of the FeS (2C) precipitates is linear initially and eventually becomes parabolic. The growth mechanism in the parabolic regime appears to be a diffusion-controlled reaction. The dependency of the growth rate on undercooling agrees qualitatively with that predicted by the continuous growth model.
High resolution transmission electron microscopy has been used to study the structure of the FeS(2C)/Fe 1._S(C) interface. The FeS/Fe xS interface is coherent.
The tip of the FeS precipitate is almost atomically sharp. Away from the tip, the FeS/Fe interface is smooth.
either identical or similar to that of the "intermediate" pyrrhotite. This suggests that the "intermediate" Fe1-S compounds might be artifactual.
Thesis Supervisor: Professor Linn W. Hobbs
Professor of Ceramics and Materials Science
TABLE OF CONTENTS Page T ITLE PA GE . .. ... .. .. .. ... ... . .. .. ... . . . . .. . . . .. . . .. . . . . .. . . I ABSTRACT...2 TABLE OF CONTENTS ... 4 LIST OF FIGURES...8 LIST OF TABLES ... ... .. .. 11 ACKNOWLEDGEMENTS ... 15 1. INTRODUCTION ... 17 References ... 20
2. BACKGROUND AND SURVEY OF RELEVANT LITERATURE ... 21
2.1 The NiAs Structure ... 21
2.2 Nomenclature and Notation Convention ... . 22
2.3 Phase Relations of Fe..S, 0<x<0.125 ... 23
2.4 Troilite Structure ... 28
2.5 Monoclinic Pyrrhotite ... 29
2.6 3C Structure ... 30
2.7 Intermediate Pyrrhotite ... .... 30
2.8 Magnetic Properties of Fej..S ... 32
2.9 Diffusion in Fe ..S ... 34
2.10 Discussion ... 34
References ... ... .... ... 55
4.2 Methods of Characterization ... 4.2.1 The Arnold-Reichen Method of 4.2.2 TEM Sample Preparation . . . .
4.2.3 4.2.4
Electron Microscopy.... Magnetic Character ization
4.3 Def initions ...
4.4 Notation Convention... References ...
5. IMAGE INTERPRETATION IN HIGH RESOLUTION M ICROSCOPY ...
5.1 Introduction ...
5.2 Physics of Image Formation ... 5.2.1 Literature Review . .C.o.... .. ... m -.. . I Compositional Determination . . . . .63 .... ... ... 64 . . . . .65 TRANSMISSION . . . . .... . . . . ELECTRON . . . . . . . .. 8 0 5.2.2 Dynamical Scattering of High Energy in a Material ... 81
5.3 Modification of Electron Wave from Imperfections in a High Resolution Transmission Electron Microscope ... 89
5.3.1 Important Fourier Optics Theorems ... 89
5.3.2 The Lens Transfer Function ... 90
5.3.3 Point Resolution of an Electron Microscope . . . .93
5.4 Image Calculation Methods ... 95
5.5 Image Interpretation in High Resolution Transmission Electron M icroscopy ... 95
5.5.1 Procedure for Image Analysis . . . . ... 95
5.5.2 Image Contrast Reversal Phenomenon ... 96
5.5.3 Fourier Images ... 97
5.5.4 Precautions in the Image Interpretation ....99
References ...120 5 . . 61 . . 61 .66 . 66 .77 .78 .78 .80
6. PHASE RELATIONS PHASE TRANSFORMAT ION AND STRUCTURES OF
Fe .. xS, 0 < x< 0.08 ... 122
6.1 Introduct ion ... 122
6.2 Coexistence of Troilite FeS and Feo.92S at Room Temperature . . .. 123
6.2.1 Experimental Details ... 123
6.2.2 Results ... .. 124
6.3 Phase Relations in Fei-,S, (0 < x < 0.08)) ... 125
6.3.1 Experimental Details ... 125
6.3.2 Results ... 127
6.4 Phase Transformation in Fe1-xS, (0 < x < 0.08) ... 130
6.4.1 Experimental Details ... ... .130
6.4.2 Preliminary Observation of the Phase Transformation ... 131
6.4.3 Theories of Nucleation and Growth... 134
6.4.4 Results ... .. . 139
6.4.4.1 Nucleation rate of FeS ... 140
6.4.4.2 Growth Rates of FeS Precipitates ... 140
6.4.4.3 The Nature and Origin of the Intermediate Iron Sulfide Compounds... 145
6.4.4.4 Microstructures of FeS and Fei-xS ... 146
6.5 Structures and Interfaces of FeS and Feo.92 -... 147
6.5.1 HRTEM Study of FeS ... 148
6.5.1.1 Experimental Details ... 148
6.5.1.2 Results ... .. 148
6.5.2 Local Ordering of Iron Vacancies in Fb.92S ... .. .151
6.5.3.1 Results ...
6.6 Summary and Discussion ... 154 References ... 208 7. PHASE RELATIONS, PHASE TRANSFORMATION AND STRUCTURES OF
Fe I.xS, 0.08 < x < 0.125 ... 209
8. SUMNARY ... 2 10
9. SUGGESTIONS FOR FUTURE RESEARCH ... 211 10. BIOGRAPHICAL SKETCH ... 212
7
LIST OF FIGURES
Figure Page
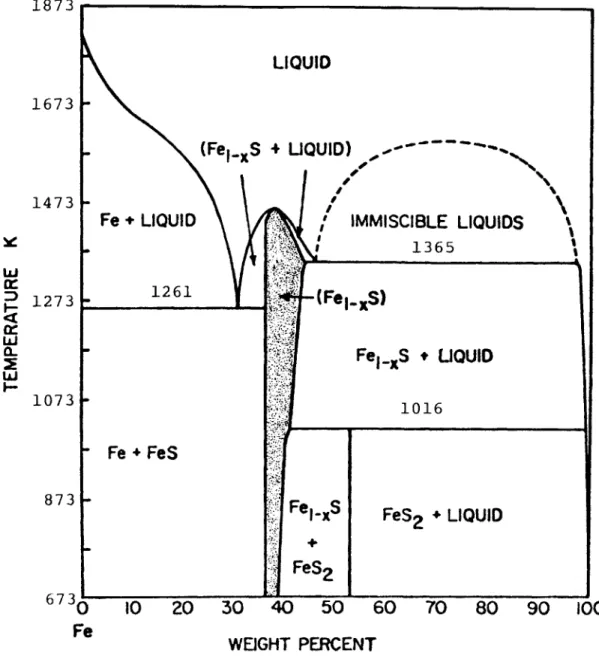
1.1 Relations among condensed phases in the Fe-S system above 673 K... 19 2.1 The NiAs structure ... .. ... 39 2.2 The electro-negative atoms form octahedra which share faces along
the c-axis and share edges normal to the c-axis... 40 2.3 Reciprocal planes of (a) 5C, (b) 6C and (c) 1 IC superstructures... . 41 2.4 Reciprocal planes of (a) 4C, (b) NC, (c) NA and (d) 4C (A), NA (B)
and MC (C) superstructures ... 42 2.5 Phase diagram of the FeS-Fe7S8 system according to
Nakazawa and Morimoto... 43 2.6 Phase diagram for the FeS-FeS2 segment of the Fe-S system below 623 K
according to Kissin and Scott ... 44 2.7 Changes of the N value by temperature for the crystals of fixed Feo.92S and
Feo .93S compositions... 45 2.8 The troilite structure... 46 2.9 The metal atom displacements shown with exaggerated magnitudes in the
troilite structure as viewed down the c-axis for an NiAs-type unit cell. . . 47 2.10 Iron vacancies order in layers normal to the c-axis... 48 2.11 The iron vacancies in 4C-type superstructure... 49
2.12 The iron vacancies in 3C-type superstructure ... 50 2.13 The iron vacancies in (a) 6C-type superstructure and (b) 5C-type
2.15 Magnetization per gram in units of emu/g in a field of 10 kOe showing the X transition for FeO.9S . . ... 53
2.16 Iron self-diffusion in Fe1 )S extrapolated from the high temperature study of Condit et al . ... ... ... ... .54 4.1 The Arnold-Reichen metal composition versus d,02 curve .. ... 70
4.2 The power x-ray diffraction patterns of d102 reflection. (a) d102 reflection
before annealing. (b) d102 reflection after annealing at 650 K for 15 minutes in vacuum . . . 7 1
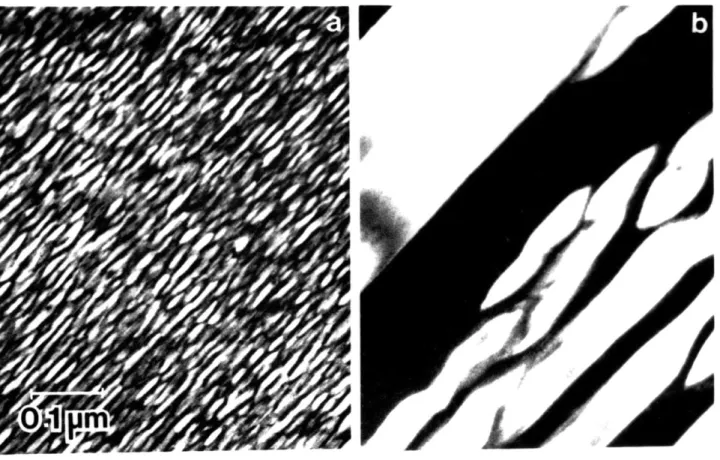
4.3 Arc reflections indicate the presence of low angle grain boundaries. . . . . . .72 4.4 Microstructure of a mixture of FeS and Fb.92S ion thinned at (a) room
temperature and (b) at 123 K ... 73 4.5 NiAs crystal axes a,, a2, a3 and toilite crystal axes a,, and a2 . . . 74
4.6 Schematic sketch of a Kikuchi map for a close-packed hexagonal crystal
extending over one standard triangle... 75 5.1 The interaction of the electron wave with the specimen and the magnetic lens
of an electron microscope . ... 102 5.2 The crystal is partitioned into paralleloped cells. ... 103 5.3 The scattering of the electron wave upon entering a new slice of material.104 5.4 The envelope functions of the MIT JEOL JEM 200CX
and ASU JEOL JEM 4000EX .... ... 105 5.5 Cos(X). The focus settings are -49.6 nm and -77.6 nm.
The electron optical parameters are those of the JEM 4000EX... 106 5.6 Sin(X). The focus settings are -49.6 rrn and -77.6 nm.
The electron optical parameters are those of the JEM 4000EX... 107 5.7 A through-focus and through-thickness series of image simulation
of the NiAs (IC) structure with the incident wave vector parallel to the [12101 direction. The microscope parameters are those of
the JEM 4000EX... 108
5.8 The contrast transfer functions of the MIT JEOL JEM 200CX and
ASU JEOL JEM 4000EX. . . . .110 5.9 An outline of the computational procedure used in the SHRLI 80 suite
of image simulation programs... . 11 5.10 Image flow program flowchart for the SHRLI 80 suite programs ... 112 5.11 Computed and experimental lattice images of troilite matched
for various focus settings... 113
5.12 The diffraction pattern of the NiAs (1C) structure along
the [1001 f 12101 direstion... 115 5.13 The variation of amplitudes of important diffracted beams
as a function of crystal thickness... 116 5.11 The variation of phases of important diffracted beams as
a function of crystal thickness. ... 117
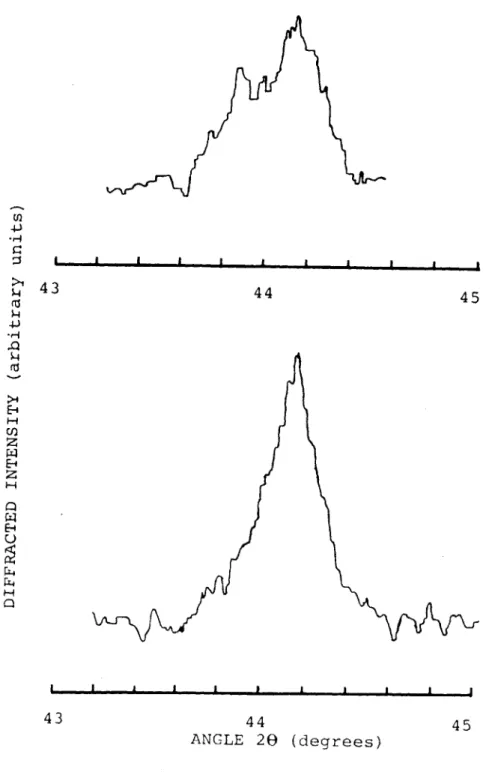
5.15 Image simulation of the FeS IC structure along the 1100]1 [1101 direction for focus setting -49.6 rrn, -77.6 nm and -152.6 nrm... . ... 118 6.1 Power x-ray diffraction pattern of Fe1xS showing two distincte
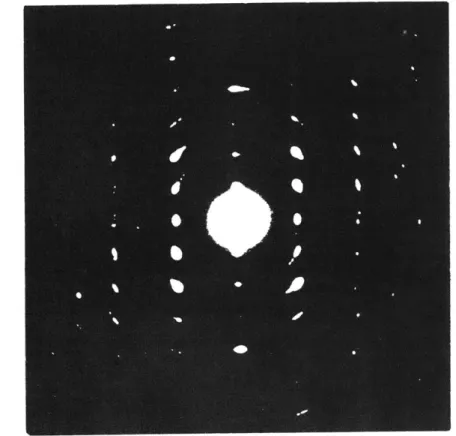
peaks at 20B = 43.2 0.10 and 2% = 43.7 0.10. .. . . . .. ... 158 6.2 Precession photographs of pyrrhotite taken about (a) (00011 ,
(b) [12101, (c) [OT 101 directions. The strong reflections correspond
to the NiAs-type substructure... 159 6.3 Electron diffraction patterns of Fe1.xS taken about (a) [00011,
(b) [12101 and (c) [Of101 directions... 161 6.4 Dark field images formed by superstructure reflections of
the troilite phase. The incident electron beam is almost parallel to
6.6 Phase diagram of the FeS-FeO.92S system constructed from the results
of this study... .... .. ... .... ... .... 166 6.7 Selective area diffraction patterns of Fe1-S or a mixture of FeS and
Fe1-xS at seven different temperatures. The incident beam direction
is parallel to [01101 direction. . . . . 167 6.8 Selective area diffraction patterns of Fe1xS or a mixture of FeS and
Fe1 xS . The incident beam direction is parallel to [12101 direction. . . . . 169
6.9 Microstructures of a mixture of FeS and Fe1-xS. (a) the sample was held at 363 K for about 10 minutes. The undercooling was 27 K. (b) micrograph taken after the sample was at room temperature for
seven hours... . ... ... 171 6.10 Microstructure of a mixture of FeS and FeI-xS. The sample was held
at 363 K for ten minutes and then cooled to room temperature. . . . ..172 6.11 Square of maximum width of FeS precipitates versus their length ... 173 6.12 Schematic sketch of the rate of nucleation as a function of
undercooling... ... 174 6.13 An activation energy barrier must be overcome when atoms
move from oc phase to , phase... 175
6.14 Schematic sketch of the rate of growth as a function of
undercooling... ... 176 6.15 (a) diffusion-controlled thicknening of a precipitate plate (b)
concentration profile of a precipitate plate in a matrix (c) a
simplification of the concentration profile ... 177 6.16 Nucleation of FeS precipitates at undercoolings of (a) 24 K, (b) 37 K,
(c) 44 K, (d) 92 K... .... ... . 178 6.17 Growth of a FeS precipitate as a function of time at 366 K.. . ... 180 6.18 Length of a FeS precipitate versus time at 366 K... 182
6.19 Length of FeS precipitates versus time at six different undercoolings. . .183 6.20 The rate of growth of length of FeS precipitates as a function of
undercooling. . . . 184 6.21 Square of maximum width of FeS precipitates as a function of time. ... 185 6.22 Square of width of FeS precipitate as a function of time ... 186 6.23 Lattice image of a FeS precipitate in Fej.xS matrix (MIT JEM 200CX) ... 187 6.24 (a) undercooling and supersaturation prior to precipitation. Rates
of (b) nucleation and (c) growth of FeS precipitates occuring during
phase transformation... ... 188 6.25 Projections of the (a) NiAs (1C) and (b) troilite (2C) structures along
the [12 101 direction... ... 189 6.26 A through-focus and through-thickness series of image simulation of
troilite (2C) structure with the incident beam parallel to the
[1201'j 12101 direction. The microscope parameters are those of the
ASU JEM 4000EX... ... 190 6.27 Lattice image of troilite with the incident beam parallel to the
[1201| [12101 direction. Inset is calculated image with focus
setting of -33.6 nm and 2.5nm thick (ASU JEM 4000EX). . . . .192 6.28 Projections of the (a) NiAs (C) and (b) troilite (2C) structures
along the [0T101 direction . .. ... 194 6.29 A through-focus and through-thickness series of image simulation
of NiAs (1C) structure with the incident beam parallel to the [12011[0i101 direction. The microscope parameters are those of the
ASU JEM IOQO EX... ... 195 6.30 A through-focus and through-thickness series of image simulation
of troilite (2C) structure with the incident beam parallel to the [100|o[0T101 direction. The microscope parameters are those of the
The microscope parameters are those of the
MIT JEM 200CX ... 199 6.32 Lattice image of FeO.92S (-).
[1210] direction.
The incident beam is parallel to the
Inset is calculated image of the 3C structure.. . . . . 20 1 6.33 Lattice image of FeS and FeO.92S- The incident beam is parallel to
the [0T101 direction. The coherent FeS/Fo..92S
interface is from
an area near the tip of the FeS precipitate. ... 203 6.34 Lattice image of a mixture of FeS and FeO.92S showing very small
FeS precipitates... ... 205 6.35 The solvus separating the IC phase from the two-phase field, 2C + L
is in good agreement with those of Sugaki and Shima (1977) and
Yund and Hall (1968) . .. .... ... 207
13
LIST OF TABLES
Table Page
2.1 Unit-cell and positional parameters for FeS in the troilite structure ... 36
2.2 Unit-cell and positional parameters for Fe7S8 in the 4C structure. . . . . 37
2.3 Unit-cell and positional parameters for Fe7S8 in the 3C structure. . . . . 38
4.1 History of materials used in this investigation. . . . .68
4.2 Electron optical parameters of microscopes used in this investigation .. 101
5.1 The phase shif ts of the (010), (011), (012) and (013) as function of focussing. . . . .100
6.1 Composition and thermal history of data used in the construction of solvus separating the L phase to the 2C and iron poor K phases... 157
ACKNOWLEDGEMENTS
This thesis is a product of not only my own work but also help , support and
encouragement of many other individuals.
I particularly wish to thank Professor Linn W. Hobbs for suggesting the iron sulfide problem and for his support and encouragement throughout this investigation. My learning curve in the art and science of high resolution transmission electron microscopy was shortened considerably due to Professor Hobbs' instruction in electron microscopy.
I thank the other menbers of my thesis committee, Professors Gretchen Kalonji, John B. Vander Sande and Bernhardt J. Wuensch, for their suggestions for
improvements of the initial draft.
I wish to thank Professor Vander Sande for his support in the image simulation efforts. I thank Professors R. W. Balluffi and S. M. Allen for letting me use their high temperature stage. I also thank Professor Allen for his valuable discussion on the phase transformation problem.
I am grateful to Dr. M. A. O'Keefe for letting me use the image simulation programs.
The precession x-ray diffraction patterns were taken by Jose Delgado. I wish to thank him for this work.
I am grateful to Dr. R. A. McKee for providing the synthetic iron sulfide crystals.
I wish to thank many menbers of the MIT research staff, particularly, Mike Frongillo, Gabriella Chapman, Jim Nakos, Pat Kearny, for their help and instructions.
More than half of the high resolution electron micrographs in this thesis were taken at the Arizona State University Center for High Resolution Electron Microscopy. The collaboration with Dr. John Barry, the hospitality and cooperation of Dr. David J. Smith and Mr. John Wheatley and the entire research staff at ASU are gratefully acknow ledged.
I would like to give special thanks to Peter Moon for making himself accessible as a sounding board for many of my ideas, for his valuable suggestions and for reviewing the manuscript.
Huge thanks go to Ming-Jinn Tsai and Shih-Shiang Wang. I especially appreciate their unfailing helps and generous assistance in putting this thesis together.
I especially like to thank Carol 'C" Marians for her generous help, friendship and inspiration. My understanding of mathematics improved manyfold under her able tutorial. The seminar on group theory is memorable.
I wish to thank John Nara and Carol '"C" Marians for drawing many fine figures. My stay at MIT has been a rewarding experience mainly due to the intellectual stimulation, support, help and friendship of my fellow students. I especially wish to thank Matthew Libera, Frank Gayle, Debbie Kaiser, Howard Sawhill, Shou-Kong Fan,
Carol Marians, Janet Rankin, Han-Ill Yoo, Joanna McKittrick, Chang-Kyung Kim, Ming-Jim Tsai, Yutaka Hara, Bill Tasker, Cindy Hao, Sue Babcock and Peter Moon.
Twelve years ago when my family and I came to America, we received considerable assistance from Barbara and Charles Sullivan. I thank them for their help.
I am grateful to Fr. Donald Divine S.J. and the Jesuits at Xavier High School and at Boston College for their financial supports and concerns in my education.
At Boston College, I also would like to acknowledge my thesis advisor, Professor Joseph Chen, for his able guidance and advice. I wish to thank my very special friend, the late Sharon Donovan, for her advice , help and frienship.
I thank my sister My-Hang and brothers Hoan and My-Quan for their support and love.
Finally, this work and my education would have not been possible without the continuing support, encouragement and love of my parents. I thank them for the sacrifice that they took to ensure the best possible education for me.
CHAPTER
1
INTRODUCT ION
Pyrrhotite, Fe1-xS, is a series of iron sulfide compounds with composition
ranging from FeS to Feo.875S (Figure 1.1). Beside being an important system in mineralogy, pyrrhotite is very well known for its ability to accommodate a large concentration of iron vacancies, and for the fact that the iron vacancies order and form superstructures at low temperature. Pyrrhotite is also known to possess intriguing magnetic and electrical properties which are physically interesting as well as industrially important (Ward 1970).
The low temperature phase relations of pyrrhotite have been investigated extensively over the past six decades. Despite these efforts, conflicting reports on the stability of low temperature phases, the phase transformation mechanisms and major disagreements among proposed phase diagrams remain unresolved. Many of the disagreements have been attributed to the uncertainty in composition and thermal history of the materials studied, slow diffusion kinetics and complex phase relations which gives rise to microscopic inhomogeneities in defect structures and intergrowth. The latter is compounded by the spatial limitation of the investigative tools so far employed which, at best, average over significant inhomogeneities in the defect structures.
A systematic study of the phase relations, phase transformations and defect structures of Fel-xS crystals in the composition range of FeS to Feo,875S has been carried out in order to:
1) resolve controversial and problematic aspects of the low temperature phase
relations.
2) gain detailed information on the extent and modes of iron vacancy ordering. 3) gain information on the phase transformation mechanisms to better understand the thermodynamic and kinetic aspects in relation to the microstructures of the Fe1..S crystals.
This study has been carried out using synthetic and natural Fe1..S crystals. Investigations of the phase relations, phase transformations and defect structures were conducted through the use of conventional and high resolution transmission electron microscopies, In s/u heating and cooling experiments, and x-ray diffraction.
This thesis is organized into eight chapters. Chapter 2 provides the background and reviews relevant literature. Chapter 3 describes the major issues addressed by this thesis. The experimental procedure and data analysis are delineated in Chapters 4 and 5. Chapters 6 and 7 present the experimental results and discussion. Chapter 8 summarizes the major conclusions. Chapter 9 suggests topics for future research.
LIQUID
(FeI..S + UQUID)
-I
Fe+ LIQUID ' IMMI
1261 (Fe. S) Fe - Fe + FeS SCIBLE LIQUIDS 1365 .Ss + LIQUID 1016 Fe, . S FeS 2 FeS2 + LIQUID 10 20 30 40 50 60 70 80 90 100 WEIGHT PERCENT
Figure I.I. Relations among condensed phases in the Fe-S system above
673 K. This thesis investigated the phase relations of
Fe1.S, O<x<0.125, (shaded area) at temperatures below 673 K. (From Ribbe, 1976, after Kullerud, 1967).
19 1873 1673 1473 1273
w
CC DU 0rw
a-10731 8731-I~ 7 0 FeReferences
Scott, S. D. in Sulfide MineralogU, P. H. Ribbe editor, BookCrafters Inc. Chelsea, Michigan (1982).
CHAPTER 2
BACKGROUND AND SURVEY OF RELEVANT
LITERATURE
This chapter begins with a description of the NiAs structure, the parent structure of all iron sulfide compounds. Important items of the nomenclature and notation convention will be dealt with next. The bulk of the chapter is then devoted to the survey of relevant literature. This includes a review of
1) phase relations of iron sulfide compounds in the composition range of FeS to
Feo.75S-2) structures of the two end members, FeS and Fb.875S. 3) structures of "intermediate" iron sulf ide compounds.
This chapter will end with brief discussions of the magnetic properties and diffusion kinetics that are relevant to this thesis.
2.1 THE NiAs STRUCTURE
Iron sulfide compounds of composition Fe1-S, O<x<0.125, have a basic NiAs structure (Alsen 1925, Figure 2.1) in which the electro-negative atoms form an almost close-packed hexagonal sublattice and the electro-positive atoms occupy the octahedral interstices in the close-packed array. A special feature of the NiAs structure is that FeS6 octahedra share faces along the c-axis and share edges normal to the c-axis (Figure 2.2). FeS4 tetrahedra also share faces forming trigonal bipyramids. These unique features suggest the possibilities of : (1) large deviation from stoichiometry due to the low ionicity. The nonstoichiometry is
accommodated by cation vacancies (Laves 1930 ; Hagg and Sucksdorf 1933) and (2) cation occupation of the trigonal bipyramid sites (Goodenough, 1978).
2.2 NOMENCLATURE AND NOTATION CONVENTION
Some of the nomenclature used in the iron sulfide literature has come to have several meanings. In order to avoid possible misunderstanding, we will define the terms used in this study.
PUrrhotite or pyrrhotite group : All iron sulfide compounds, Fel-xS, that possess the NiAs substructure.
Tiholite *: Stoichiometric FeS with space group P62C (see Section 2.4).
Monoclinic pyrrhotite : Pyrrhotite that exhibits 4C structure (see Section 2.5) by diffraction and has space group F 2/d.
Hexagonal purrhotite : All pyrrhotites that exhibit hexagonal symmetry by diffraction, excluding superstructure reflections. This term is equivalent to the '"intermediatem pyrrhotite defined by Morimoto et al. (1975).
Commensurate structure : structure whose superstructure reflection distances are commensurate with those of the substructure reflections.
Incommensurate structure : superstructure that is not a commensurate structure.
The pyrrhotite superstructures are designated following the convention of Wuensch (1963). The dimensions of the superstructure, denoted by lower case
letters, are expressed as multiples of the NiAs substructure dimensions, which are denoted by capital letters. A superstructure is usually referred to by its "c "or "a" cell dimension. For example, monoclinic pyrrhotite is designated 4C because its cell
A*C* planes of the most frequently reported superstructures are shown in Figures 2.3 and 2.4.
2.3 PHASE RELATIONS OF Fe i-xS. O<x<0.125
Figures 2.5 and 2.6 depict the current understanding of the phase relations in the Fei-xS system ( Nakazawa and Morimoto 1970, Kissin and Scott 1982). The phase relations between the maximum melting temperature 1463 K and 583 K appear to be straighforward and generally well accepted (by well accepted we mean a general agreement among most workers in this field and this agreement has been quoted in books and major review papers). The entire phase field is occupied by a single solid solution, Fe1-S. This solid solution has a NiAs (iC) structure in which the iron atoms and vacancies are randomly distributed on the cation sites. Only one conflicting result was reported by Desborough and Carpenter (1965). They observed a hexagonal a = 2A, c = 7C structure in the temperature range from 583 K to 923 K.
Below 583 K, the phase relations are highly controversial. In the composition range from FeS (50 at % Fe) to Feo.94S (48.45 at % Fe) and the temperature range from 583 K to T, (see Figure 2.5 for definition of T,), according to Nakazawa and Morimoto (1970), Sugak i and Shima (1977), the 1C phase extends from 583 K to a transformation temperature T.. Below Tx the IC phase decomposes to trollite (FeS, 2C; see Section 2.4) and an iron poor IC phase. Kissin and Scott used the results of Sugaki and Shima in their phase diagram. Desborough and Carpenter (1965) and Yund and Hall (1968), however, reported that the stable phase above T,
is the hexagonal a = 2A, c = SC structure (see Section 2.7). King and Prewitt (1982) and Putnis (1975a,b) in their heating studies of the stoichiometric FeS structure reported that trollite FeS did not transform to the NiAs IC structure
above Tcx. King and Prewitt (1982) reported that troilite FeS (2C) transforms to a MnP-type structure at 415 K. At 573 K the lnP-type structure transforms to the
1C structure. Putnis reported that under heating by the electron beam, troilite transforms into the NiAs structure. However, upon cooling the high temperature IC
phase continuously transforms to an a = 2A, c = 1C phase. Upon further cooling, the 2C FeS structure appears and coexists with the 2A, IC phase. Putnis suggested that the a = 2A, c = 1C structure is a metastable phase.
Conflicting results on the decomposition products of the phase separation at temperature below TC were also reported. At the stoichiometric end and below T,, the stability of troilite FeS is very much disputed. In the mineralogical literature, synthetic and natural troilite FeS are reported to be both stoichiometric and stable. However, other investigations have found that FeS is unstable and decomposes into two compounds, one on each side of the stoichiometric composition. Work on synthetic crystals by Sparks et al. (1962) indicated that Fei-xS is stable in the range from x = 0.004 to x = 0.006. They suggested that when cooled below 415 K FeS actually separates into two phases, one of which is magnetic. Nossbauer studies by Thiel and Van den Berg (1968, 1970) of synthetic FeS also indicated the existence of two different phases. Their attempt to detect the tetrahedrally-coordinated iron atoms in the iron rich phase was inconclusive. Putnis (1975 a, b), using electron microscopy, reported that meteoritic FeS undergoes a phase separation to both sides of the stoichiometric composition upon annealing at temperature between 363 K and 388 K. He asserted that the iron-poor phase has a modulated structure based on an a = 2A, c = IC supercell which is formed by vacancy ordering. The iron-rich phase has the troilite superstructure with excess iron in the bipyramid interstices. At the other end, the composition of the
maintained that the structure is an a = 2A, c = 5C superstructure.
Morimoto
amd
Nakazawa (1970,1978) reported a 6C superstructure in a slowly-cooled experiment
with the crystal's iron composition more than FeO.94S- They also reported that by
rapid cooling of FeO.95S from high temperature (above 375 K) to 367 K the structure
changes from a IC structure to a metastable nonintegral type 4.5C superstructure.
In the composition range from Feb.94S to FeO.875S and below 583 K, the phase
relations of Fe
1xS
are enigmatic. From x-ray sudies of natural and synthetic
pyrrhotite, Nakazawa and
Norimoto
(1970,1978) (see Figure 2.5) reported that
Fe
1xS
is stable as the NC structure (see Section 2.7) in the composition and
temperature ranges from Fe0.94S to FeO.
9 1S
and from TNC (see Figure 2.5 for
definition of TNC and TNA) to 373 K. The value of "N" varies as a function of
composition and temperature. N increases as the vacancy content decreases. As
temperature increases, however, N was reported to decrease. Upon cooling, N
remains invariant (Figure 2.7). From Fe
0.91S
to Fe
0.9S,
the high temperature IC
structure transforms to a NA phase at temperature TNA . This NA phase
subsequently was reported to tranform to the NC structure at about 483 K. Below
373 K, Morimoto and Nakazawa indicated that the NC phase transforms to a
homologous compositional
series: Fe
1IS12
(6C),
Fel
0S
(1
C) and FegSj
0(5C).
The nature of the transformation remains unclear. In the composition range from
FeO.
9S to FeO.875S, there is a miscibility gap between the NC or NA phase and the
4C
phase for temperature below 563 K. Nakazawa and Morimoto also maintained that
the composition of the 4C phase is Fe7S
8. From 563 K to 578 K, FeiS is stable as
a mixture of the
1C
and MC phases (see Figure 2.5). This two phase mixture
transforms to a mixture of
1C
and pyrite phases before transforming to the
IC
phase.
The phase relations of Fe
1gS
in the composition range from FeO.92S to FeS
2were also investigated by Kissin and Scott (1982) using a hydrothermal
25recrystallization technique (Figure 2.6). At temperatures below 483 K, there are three two-phase field regions separating the 1C and NC phases, NC and 4C phases. and 4C and pyrite phases. In the temperature range from 483 K to 539 K, three other two-phase field regions separate the IC, NA, 4C and pyrite phases. There are two two-phase field regions at temperature from 539 K to about 583 K. These miscibility gaps separate the MC phase from 1C and pyrite phases. Kissin and Scott reported that monoclinic pyrrhotite (4C phase) exists over a range of compositions. Kissin and Scott did not investigate the phase relations at temperature below
373 K.
In addition to reports by Kissin and Scott and Nakazawa and lorimoto, numerous other studies have also been carried out to investigate the structures and stabilities of Fe1_S in the composition range from FeO.92S to FeO.875S. Sugaki and
Shima (1977) and Sugaki and coworkers (1977) in their hydrothermal synthesis studies reported a phase diagram that was almost identical to that of Nakazawa and Morimoto. In the temperature range from 483 K to 623 K, different structures of Fe1_S at composition "Fe7S8 were reported by many workers. Liliental et al.
(1981), Nakano et al. (1979), Keller-Besrest et al. (1983) and Fleet (1968, 1971) observed a 3C superstructure from quenched samples of composition exactly or close to Fe7S8 (Figure 2.12). Corlett (1968), in an in s// high temperature X-ray
experiment, concluded that the 4C structure transforms into the IC structure at a temperature somewhere between 488 K and 513 K. This phase transition was reversible upon slow cooling. If the cooling rate was more rapid, a "3C" superstructure was produced. Corlett subsequently noted that the spacing of the super-structure is not exactly 3C. Keller-Besrest et al. (1983), using x-ray diffraction, reported a mixture of 4C and 3C superstructures in synthetic
in the C* direction along the substructure reflections as well as along the superstructure reflections. They attributed this diffuse scattering to stacking faults in the sulfur sublattice. Francis and Craig (1976) using electron diffraction reported a 3C, NA structure where N may or may not be commensurate with the basic NiAs structure. (Morimoto and Nakazawa (1978) reported that the IC structure is stable up to 573 K where it transforms to an "NC" phase. They asserted that the 3C structure is a special case of the NA structure which is only stable in the composition range from FegS10 to Fej 1S12). Using high resolution transmission
electron microscopy Pierce and Buseck (1974, 1976) studied pyrrhotite with an average composition of Feo.9 1S, in which they observed a mixture of 4C, 5C and NC structures.
Intergrowths of the 4C phase with other pyrrhotite phases as well as with the 2C phase were observed by Putnis (1975) using electron diffraction and conventional electron microscopic imaging techniques. Based on the fact that the 4C phase coexists with the 2C phase, Putnis then questioned the thermodynamic stability of the intermediate compounds.
Finally, the decomposition mechanisms of the miscibility gaps have not been established clearly either. Based on the optical observation of the microstructures of annealed Fej.xS (O<x<0.07) Yund and Hall (1968) suggested nucleation and growth as the phase separation mechanism of FeS and the intermediate compounds. Putnis (1975), using transmission electron microscopy to study annealed "FeS" ,
reported a two phase microstructure that was consistent with spinodal decomposition mechanism (a microstructure similar to that observed by Putnis is shown in Figure 4.4a). He concluded that the resulting phases differ slightly in their iron content and that their compositions lie on either side of the stoichiometric composition. We note that Putnis prepared his electron transparent
TEN samples by ion thinning at room temperature. The decomposition mechanism that separates monoclinic pgrrhotite and the intermediate compounds is not known.
2.4 TROILITE STRUCTURE
Troilite", FeS, is commonly found in meteorites, terrestrial deposits and is ubiquitous to all lunar samples from the Apollo 11 and 12 missions (all of these in the mineralogical jargon means that this is a stable phase because it exists for a long time). The crystal structure of troilite has been studied using X-ray diffraction by Bertaut (1956), Evans (1970) (lunar troilite) and King and Prewitt (1982) (synthetic crystals) . Troilite has been found to have an a =
I
A , c = 2C superstructure (Figure 2.8) where A and C are the dimensions of the NiAs unit cell. The space group of troilite has been determined to be PU2C. The troilite unit cell contains 12 FeS formula units and has the lattice parameters of0 0
a=b=5.963 0.0003
A
, c = 11.754 t 0.001A
, o< = = 90.00 0.0 10;W = 120.01 0.010 (K ing and Prewitt 1982).
The troilite structure is related to the parent NiAs structure through small displacements of iron and sulfur atoms. The Fe atoms in an NiAs-type structure are six-coordinated by S atoms with each octahedron sharing edges with six octahedra in the plane normal to c and sharing faces with two others along c (Figure 2.2). In trollite, the Fe atoms are displaced in such a way that two of the six Fe-Fe distances across those shared edges are shortened. These Fe-atom displacements link the Fe atoms into triangular groups whose normal points along the c-axis (Figure 2.9). Across the shared face, these groups are paired into six-atom prisms. Across the intra-prism shared face, the metal-metal
The distortion of the hexagonal close-packed sulfur framework is very small. Of the three symmetrically distinct S atoms, S(2) and S(3) are displaced from their ideal position (see Table 2.1). S(3) is displaced normal to c by a very small distance of 0.021A . The S(2) atoms are displaced along the c by 0.244A and therefore lie above and below the plane passing through the S(1) and S(3) atoms. This distortion is closely related to the formation of the Fe prism.
The displacement that draws the iron atoms into the triangular groups also moves them away from the center of the surrounding octahedron. The FeS6
octahedron is therefore severely distorted. The fact that the bond lengths to the six nearest neighbors of the Fe atom vary as much as 0.36
A
makes its coordination nearly five fold.The positional parameters for FeS in the troilite structure are given in Table 2.1.
2.5 MONOCLINIC PYRRHOTITE
Monoclinic pyrrhotite, the end member of Fej-xS on the iron deficient side, is the most extensively studied iron sulfide compound. The iron deficiency in this compound is accommodated by iron vacancies which order at low temperature. Despite disagreements over the composition range, the mode of vacancy ordering has been worked out and generally accepted. Single crystal X-ray studies of this pyrrhotite were carried out by Bertaut (1952, 1953 ; twinned, natural sample of unknown composition), Buerger (1947) and Wuensch (1963; twinned, natural Fe8S9),
Corlett (1964, 1968; natural Fe7S8) and Tokonami et al. (1972; natural sample). Results from these studies indicated that the crystal is monoclinic with vacancies ordered in alternate iron layers normal to the c-axis (Figures 2.10, 2.11). The space group is F2/d , and the unit cell contains eight Fe7S8 formula units. The
cell dimensions are approximately a = 2A, b = 2J3T and c = 1C. Pyrrhotite with cell dimension c = 4C is usually referred to as "monoclinic" pyrrhotite. The atomic positions for the monoclinic pyrrhotite structure are listed in Table 2.2.
Studies using high-resolution transmission electron microscopy by Nakazawa and Morimoto (1974-1976) confirmed the stacking sequence of the IC-structure. They showed that Fe7S8 is extensively twinned along the c-axis. Microscopic twins
which contain from two to ten stacked layers are deemed responsible for the streaking observed in the diffraction patterns, White streaks in the high-resolution micrographs were attributed to out of step boundaries of orientation [102] and [111]. Other defects such as anti-phase boundaries, twins and stacking faults were predicted and observed by Van Landuyt and Amelinckx (1972).
2.6 3C STRUCTURE
The crystal structure of the 3C phase was determined by Fleet (1968) and later refined by Nakano et al. (1979). The iron vacancies have also been found to order in alternate iron layers normal to the c-axis (Figure2.12). The space group of this structure is P3121 with a = 6.8652 0.0006 A , c = 17.047 0.002 A . The position
parameters for this structure are listed in Table 2.3.
2.7 INTERMEDIATE PYRRHOTITE
Intermediate or hexagonal pyrrhotites are iron sulfide *compounds" with composition ranging nominally from Fe0.9S to Fe0
structures are tentatively given as C.ca and Fy respectively. Koto and coworkers (1975) modeled the 5C and 6C superstructures with a filled layer of iron atoms alternating with two consecutive defective layers along the C-axis (Figure 2.13). The defective layers are assumed to be statistically filled with iron vacancies.
High-resolution transmission electron microscopic studies of the intermediate pyrrhotite have also been carried out by Nakazawa, iorimoto and Watanabe (1976) and Pierce and Buseck (1974, 1976, 1979). In their study, Nakazawa et al.
interpreted their high resolution images to be the 5C structure. From their images, they also concluded that the 5C structure is an average structure consisting of a statistical distribution of iron vacancies along the c-axis. The iron vacancies are distributed in two or more successive iron layers. During their TEN observation, the electron beam increased the specimen temperature sufficiently so that a phase
transformation between the nC and nA phases was observed. This transition, however, was not observed dynamically.
Using both x-ray diffraction pattern and high resolution images, Nakazawa and coworkers proposed a model for the NA structure. This structure consists of three domains related by 1/3 C glide along the a-axis (see figure 2.14).
Pierce and Buseck studied pyrrhotite with average composition of Fe0.915, in which they observed a mixture of 5C, 4C and NC structures. Their lattice images of the 5C structure indicated the presence of antiphase domains of ordered iron vacancies with an apparent out of step vector eqal to 1/2 a. High resolution "dark field" images of incommensurate 5.1C structure showed that this structure contains a mixture of very small domains separated by antiphase boundaries. The dimension of the domain is typically five or six times the length of the C dimension of the NiAs basic structure. The 5C structure proposed by Nakazawa et al. was not observed by them.
Pierce and Buseck also used the Minagawa equation (Minagawa 1972) to predict the non-integral superstructure spacing when the domain sizes are not the same. Subsequently, Pierce, in his thesis, concluded that all incommensurate structures can be explained by a structural model consisting of stacking along the c-axis of plate-like antiphase domains. He also suggested that the change in vacancy concentration is accommodated by change in antiphase domain size.
Recently, Yamamoto and Nakazawa (1982) used the four-dimensional space group W99 to analyse the diffraction pattern of the NC-type pyrrhotite. They
concluded that the Fe vacancies are distributed spirally along the c-axis.
2.8 MAGNETIC PROPERTIES OF Fei-xS
The magnetic phase diagram of Fej..S (0<x<0.125), like the compositional phase diagram, is controversial. In this section we will not review the magnetic phase relations but will describe some general magnetic properties that are relevant to this thesis. We will particularly concentrate our discussion on the magnetic properties of Feo.9S.
It is generally accepted that the IC phase is paramagnetic above 600 K and antiferromagnetic below 600 K, the 2C and NC phases are antiferromagnetic, and the 4C and NA phases are ferrimagnetic. The antiferromagnetism of the 2C phase and ferrimagnetism of the 4C phase have been known to arise from the mutually antiparallel orientation of the electron spins in alternating iron layers parallel to the basal plane. In the 2C structure , every iron layer is filled and hence leads to exact cancellation of the magnetic moment. In the 4C structure, the iron vacancies order in alternate iron planes. Exact moment cancellation does not occur and
The magnetism of Fe0.qS is particularly interesting and has been extensively
studied (Marusak and Mulay 1979, 1980; Ovanesyan et al. 1971; Bennett and Graham 1981; Schwarz and Vaughan 1972) . Feo.gS has been found to be antiferromagnetic below 460 K and above 550 K and ferrimagnetic in between these two temperatures. Evidence of the antiferromagnetic to ferrimagnetic phase transformation (known as the X transition) can be found in the measurement of magnetization as a function of temperature (Figure 2.15). It is particularly interesting to note the slow rise and fall of the magnetization. Explanation of this event will be given in Section 7.4.
Several theories have been proposed to explained the X transition. Lotgering (1956) explains the X transition as follows. Above the or antiferromagnetic-to-paramagnetic transformation (600 K) both spins and vacancies are disordered. On reducing the temperature, magnetic order sets in at 600 K but because of the vacancy disorder, exact cancellation of the two sublattice occurs, resulting in antiferromagnetism. At 550 K, the iron vacancies order and lead to imperfect magnetic sublattice cancellation and therefore ferrimagnetism. Below 460 K, the vacancies disorder and ferrimagnetism reverts back to antiferromagnetism.
Marusak and Mulay (1979,1980) agreed with Lotgering's explanation for the higher temperature part. They, however, suggested that the antiferromagnetisms
is due to the SC superstructure (see Section 2.6) and not a vacancy disordered structure. They also proposed that the ferrimagnetic phase has a 4C superstructure.
Finally, it is of interest to note that in the crystal synthesis process, Marusak found that Fe0.9S crystal is ferrimagnetic if it is fast-cooled to room temperature.
In order to produce the antiferromagnetic phase, Marusak had to anneal the sample at 388 K for four months and then for six months at room temperature.
2.9 DIFFUSION IN Fe-xS
To date no study on diffusion in Fe1xS has been carried out for temperatures below 620 K. Only one study was carried out to determine the iron self-diffusion
in Fe1_S at high temperature (>620 K) . This study by Condit and coworkers
(1974) used the radiotracer technique. They found the iron self-diffusion coefficient in Fe1.. S above 620K to be
D = Do& exp(-( (81:4) + (84 20)8)/RT)
where the exponential units are kJ/mole, [o is (1.7 0.1)x10-6 and (3.0 0.2)x10-6 m2/sec for diffusion in the a- and c-dirctions, respectively. & is
the deviation from stoichiometry as given in the formula Fe1SS and ranges from 0.003 to 0.153.
Condit and coworkers found that iron atoms diffuse by a vacancy mechanism and the diffusion of sulfur atoms is many order of magnitude smaller than for iron.
Since there are no diffusion data available at low temperature, we will extrapolate Condit and coworkers' results to lower temperature and use them to estimate the annealing time in the study of phase relations. We will show in Section 6.4 that this undertaking is quite reasonable.
2.10 DISCUSSION
Despite contradictory reports on the structures of the Fe1_,S phase above T, the literature appears to accept the results reported by Nakazawa and Morimoto. No acceptable reason has been given to explain Carpenter and Desborough (1964) and Yund and Hall (1968) results. The phase transformation mechanisms also remain
the method of investigation. The study of phase transformation cannot just be based on the observation of microstructural features.
A major problem that has plagued almost all studies to date is the inability to perform /n silu heating experiments . Studies of high temperature phase
relations from quenched samples are meaningful only if the diffusion kinetics are sufficientlg slow on the experiment time scale. There is little evidence that this is the case in the Fel..S system. Because of the long exposure requirement and limitation of time, the
In
situ heating x-ray diffraction studies carried out byCorlett and Nakazawa and Morimoto lacked the necessary temperature resolution required to follow a phase transformation closely. This problem, coupled with the microscopic compositional inhomogeneities, naturally causes chaos in the
literature.
It is clear from previous sections that major disagreements still exist in the entire Fe1..<S (O<x<0.125) phase diagram and that studies of phase transformation mechanisms to date are inconclusive.
Temperature: Pressure: a = b = 5.963(1)A ; c C< = 90.00(1)* 11.754(1)A ; = 90.00(1)0 ; '6 = 120.01(1)0 V= 361.88(9)A3 c/A*= 1.707
space group p62c
Fe[ 12(i)],5(1)[2(a)],
x:
Y: z S(2)[4(f)]x:
0.3787(2)
Y:
0.0553(2)
z:
0.12300(9)
0
0
0
1/3
2/3
0.0208(2)
5(3)[6(h)] x: 0.6648(6) -0.0041(4)1/4
Table 2.1.
Unit-cell
and posititional parameters for FeS in the troilite
294 K 0.0001 Pa
7:
Temperature: Pressure: a 11.902(8) A 0.0001Pa b 6.859(5) A ; c 22.787(10)
A
= 90.26(3)0 Space group F 2/dcoordinate of equivalent positions:
(0, 0, 0; 1/2, 1/2, 0; 1/2, 0, 1/2; 0, 1/2, 1/2) + x, y, z; 1/4 - x, y, 1/4 - z; x, y, z, 1/4 + x, y, 1/4 + z x y 0.3500(9) 0.3660(11) 0.3975(9) 0.3528(12) 0.3660(16) 0.3833(15) 0.3858(15) 0.3645(15) -0.0063(2) 0.1234(2) 0.2501(2) 0.3750 -0.0618(3) 0.0598(3) 0.1805(3) 0.3087(3)
Table 2.2. Unit-cell and positional parameters for Fe7S8 in the 4C structure. (Tokonami et al. 1972). 37 z Fe 1 Fe2 Fe3 Fe4 S1 S2 S3 S4 0.3809(3) 0.3816(4) 0.3587(3) 0.3750 0.2061(5) 0.5418(6) 0.2096(5) 0.5425(5) 294K
Temperature: 294 K Pressure: 0.0001 Pa a = b = 6.8652(6) A space group P3121 x Fe(1) Fe(2) Fe(3) Fe(4) Fe(5) S(1) S(2) S(3) S(4) 0.0234(4) 0.0283(4) 0.4641(3) 0.0085(5) 0.0079(5) 0.1641(4) 0.1671(4) 0.6608(6) 0.6624(6) 0
c
=17.046
(2) A
y 0 0 0 0.5268(3) 0.5125(4) 0.3380(6) 0.8419(4) 0.3321(6) 0.8352(4)z
1/3 5/6 5/6 0.82504(5) 0.33564(4) 0.75301(7) 0.74183(7) 0.75129(12) 0.75642(7)Table 2.3. Unit-cell and positional parameters for Fe7S8 in the 3C structure
K
0
(a)
Figure
2.1.
(b)
(a) The NiAs IC structure showing linkage of ions in the unit cell.
(b) the electro-negative atoms stack in a ABAB sequence forming a hexagonal close-packed sublattice. The electro-positive atoms occupy the octahedral interstices (c).
I
B B A A A C C C B A A A C C B B A A AFigure
2.2.
The electro-negative atoms form octahedra which share faces along the c-axis and share edges normal to the c-axis. The tetrahedra also share faces forming trigonal bipyramids.0 0 S 0 0 (a) C* 0
t
S * A AS 10 0 S C*.4,
0]
.S h S 0 0 SS
SS
S * 0a*
b)
S S S 0 0 S0
. T A* & A2 A =a* (c)Figure 2.3.
Reciprocal planes of (a) 5C, (b) 6C and (c) 1 I C types. Large circles represent main reflections and small circles correspond tosuperstructure reflections. The interval "t" is irrationally related the repeat of the main reflections "T" along the C* axis (after
Nakazawa and Morimoto, 1970-1971).
41 C* 4
4
(
C * b 11 ST a*S
0 0 0 A = 110 C. 4 c* A * A =a* * 0 . 0 (a) B , C B ~~~"---A
-.. 0 p (d)Figure 2.4. Reciprocal planes of (a) IC, (b) NC, (c) NA and (d) 4C (A), NA (B) and NC (C) types. Large circles represent main reflections and small circles correspond to superstructure ref lect ions (af ter Nakazawa and Morimoto, 1970-1971). * 0 S 0 0 C*
0
S
0 * *0A h
0. s oAf . * (b) A* w (c)C
* 4 r]ATOMIC % Fe 50.00 49.50 48.98 48.45 47.92 47.37 46.81 iC+i~P, C Ic -73---.--- I 1C- ---573 If McI ~1L-4 C (a - - -- - Mc 4Nc pA N 4C, ;: fNA 0 0 TNA NA NA+4C e- -- ----,4C 1 NA 1C NA+ 4 7 3 bY7- - - I.I.7 1-p D Tai T T -NC+4C 2C+1C 0 S 373 ---e -2C+6C + + 5C+4C 09U 096 094 02lc C 09 8 f COMP (x in FexS) t 1 f 2C *---2c Q---NA 6C 11C 5C 4C )---2C+6C O---MC lo---Nc 0---NA +4C +MC 0---l c
Figure 2.5. Phase diagram of the FeS-Fe7S8 system (after Nakazawa and
Morimoto, 1971).
-I I I I I I I I taJ a. I-U w I.. p.. ZN 'I
El
573 52 473 323 323 486 W z4HEXAGONAL PYRRHOTITE (C) + PYRITE
"HEXAGONAL" PYRRHOTITE (MC) + PYRITE
535 "HEXAGONAL" PYRRHOTITE (NA) + PYRITE
57 ("HEXAGONALO PYRRHOTITE (NA)
+ MONOCLINIC PYRRHOTITE)
(-HEXAGONAL" PYRRHOTITE (NC)
+ MONOCLINIC PYRRHOTITE)
MONOCLINIC PYRRHOTITE + PYRITE
(SMYTHITE + MONOCLINIC
(
PYRRHOTITE) t a 46 A I4
IA I-- ~ 30-y. 4d z CI"C
Wx
i
44 SMYTHITE + PYRITE a i a I 42 -J 40 38 36 Atomic % Fe 348Figure 2.6.
Phase diagram for the FeS-FeS2 segment of the Fe-S system below 62I
'1-
'I-II 50 W 0.-D 0-34 ; , ,I I INC
0---0--I - X I NC -0 ---TI
Figure 2.7. Changes of the N value by temperature for the crystals of fixed FeO.g2S and FeO.93S compositions. The black and open circles represent the N-values obtained in heating and cooling experiments, respectively. The intensity maxima of the diffuse streaks observed at room temperature are shown by small black circles (after
Nakazawa and Morimoto, 1970).
45 6.0- 4.0-3.0 -WIC FeO.9 3S 1C Fe0.9 2S 5.0- 4.0- 3.0-N I i i i
Figure 2.8. The troilite structure. The c axis of a NiAs-type unit cell points up and slightly rotated out of the plane of the drawing. The metal atoms have sectioned ellipsoids (after King and Prewitt, 1982).
0
011
4
0
0
40 wO , 0w@0
0
.we 4 00
.O4
0
Figure 2.9. The metal atom displacements shown with exaggerated magnitudes in the troilite structure as viewed down c for an NiAs-type unit cell. The atom positions in an NiAs-type structure are indicated by the bases of the arrows (after King and Prewitt, 1982).
Figure 2. 10. Iron vacancies order in layers normal to the c-axis. The vacancies stay in a configuration that maximizes their separations. Open
bl
L~hIIEk
Figure . 11.
he iro vacances in 0-typesprtutr.Olyioktm r
shwnhee.Siars r te acntirnEits
40
]1
A
IrA
C
00
C
L1AM
EJ
Idol& MW ,.Oak,b
a
Figure 2.12. The iron vacancies in 3C-type superstructure. Only iron atoms are shown here. Squares are the vacant iron sites.
Idol&
L--j
A7.7
6C
.
~457 4(7) 0 0 .o.
0AI
-4 *Adak C-lG W (b)Figure 2.13. The iron vacancies in (a) 6C-type superstructure and (b) 5C-type superstructure. Only iron atoms are shown here. Squares in (a) and open circles in (b) are the vacant iron sites (after Koto et al..
1975).
51
o0-2/3 o. 05e o Fe Fe .
000Q00 Q00Q0 000000 00Qe0eQ
0c 0.00 00 0 00 .00 00 0 000:00
Fig. 4. (a) High magnification lattice image of the NA type. A unit with dimensions of a(82.6 A )and c (17.1 A) is indicated. An electron diffraction pattern is shown. (b) A structure model of the NA type. Filled circles indicate Fe sites that are completely filled. Large and small open circles are the Fe sites of 1/3 and 1/6 vacancies, respectively. Sulfur atoms
are omiitted for simplicity