Design of a Biologically Inspired Underwater
Burrowing Robot That Utilizes Localized Fluidization
The MIT Faculty has made this article openly available.
Please share
how this access benefits you. Your story matters.
Citation
Dorsch, Daniel S., and Amos G. Winter. “Design of a Biologically
Inspired Underwater Burrowing Robot That Utilizes Localized
Fluidization.” Volume 5A: 39th Mechanisms and Robotics
Conference (August 2, 2015).
As Published
http://dx.doi.org/10.1115/DETC2015-47459
Publisher
American Society of Mechanical Engineers
Version
Final published version
Citable link
http://hdl.handle.net/1721.1/109258
Terms of Use
Article is made available in accordance with the publisher's
policy and may be subject to US copyright law. Please refer to the
publisher's site for terms of use.
DESIGN OF A BIOLOGICALLY INSPIRED UNDERWATER BURROWING ROBOT
THAT UTILIZES LOCALIZED FLUIDIZATION
Daniel S. Dorsch⇤
Global Engineering and Research Laboratory Department of Mechanical Engineering
Massachusetts Institute of Technology Cambridge, Massachusetts, 02139
Email: dorsch@mit.edu
Amos G. Winter, V
Global Engineering and Research Laboratory Department of Mechanical Engineering
Massachusetts Institute of Technology Cambridge, Massachusetts, 02139
Email: awinter@mit.edu
ABSTRACT
The Atlantic razor clam (Ensis directus) digs by contracting its valves, fluidizing the surrounding soil and reducing burrow-ing drag. Movburrow-ing through a fluidized, rather than static, soil requires energy that scales linearly with depth, rather than depth squared. In addition to providing an advantage for the animal, localized fluidization may provide significant value to engineer-ing applications such as vehicle anchorengineer-ing and underwater pipe installation. This paper presents the design of a self-actuated, radially expanding burrowing mechanism that utilizes E. direc-tus burrowing methods. The device is sized to be a platform for an anchoring system for autonomous underwater vehicles. Scal-ing relationships presented allow for design of burrowScal-ing sys-tems of different sizes for a variety of applications. The motion to sufficiently create soil fluidization is presented. Max force for the actuator to contract is based on force to pump fluid out of the device, and max expansion force is determined by the soil. Friction force in the device and potential considerations for in-creased force are presented. Data from laboratory tests are used to characterize how power is split between pumping water out of the device versus accelerating the mechanism itself. These rela-tionships provide the optimal sizing and power needs for various size subsea burrowing systems.
⇤Address all correspondence to this author.
INTRODUCTION
There are many applications in which attaching to the seafloor is beneficial. This can be accomplished by burrowing into the soil, and many animals have found methods to do so. While some animals, such as crabs, create burrows, others use methods that allow them to move more efficiently through the soil, by propagating cracks [1] or wiggling like a snake [2].
There are many different systems that can benefit from im-proved burrowing and anchoring technologies. Anchoring au-tonomous underwater vehicles (AUVs) is one example. Im-proved anchors could also be used for anchoring larger equip-ment, such as ships, oil recovery equipequip-ment, or repositionable buoys. Lower energy, more efficient systems could reduce the weight needed for an anchor and increase the number of de-vices that could efficiently use an anchor. For example, cur-rent medium sized AUVs do not carry a conventional anchor, as it would be too heavy to use and difficult to retrieve once de-ployed [3]. A system that is lightweight and could easily detach from the seafloor when desired would be beneficial in this appli-cation.
The Atlantic razor clam, Ensis directus, exhibits a unique method for burrowing into soil. This animal is small, about 20 cm (8 inches) long and 3.2 cm (1.25 inches) wide [4]. It consists of two shell halves that move about a hinge on one side. The shell is spring loaded to open, and muscles cause the shell to close. E. directus is fairly weak; its foot can produce about 10 N of pulling force which should only be enough to pull the animal into Proceedings of the ASME 2015 International Design Engineering Technical Conferences &
Computers and Information in Engineering Conference IDETC/CIE 2015 August 2-5, 2015, Boston, Massachusetts, USA
packed soil 1-2 cm. In reality, razor clams inhabit soil up to 70 cm deep [5]. They reach this depth by fluidizing the soil around them to reduce drag. It is this ability that makes E. directus of interest for a low energy anchoring system.
An E. directus based anchor would be much more efficient than current anchoring technologies. The anchoring force it can achieve per energy required to insert it is greater by more than an order of magnitude over currently used systems [6]. Lower energy use is beneficial to any system, but is especially advan-tageous for energy-limited systems such as AUVs, which run on batteries and have limited capacity.
When burrowing, E. directus first pushes its body upward and then quickly contracts its shell. This rapid contraction cre-ates a region of fluidized soil around the animal’s shell. This zone is created by fluid being drawn into the region around the animal. An increased fluid to particle ratio (void fraction) creates a local fluidized zone. Since the area around the clam behaves more like a viscous liquid with than a particulate solid, moving downward through this region is just like moving through any other Newto-nian fluid. This means there is a constant drag force with depth; in contrast, a blunt object moving through static soil encounters linearly increasing force with depth [7].
RoboClam 1 was developed to discover the ideal perfor-mance parameters for localized fluidization burrowing. This bur-rowing is done in a 96 gallon drum filled with 1 mm diameter glass beads. This glass bead media is used since it is a ”weaker” soil meaning burrowing can be performed in lab, where an infi-nite bed of soil is not available. Testing has revealed important parameters associated with burrowing. Contracting too quickly does not give the particles time to move, whereas contracting too slowly lets the particles simply slide along without ever enter-ing a fluidized state. Re-expandenter-ing too slowly results in higher forces as the particles have already settled [8].
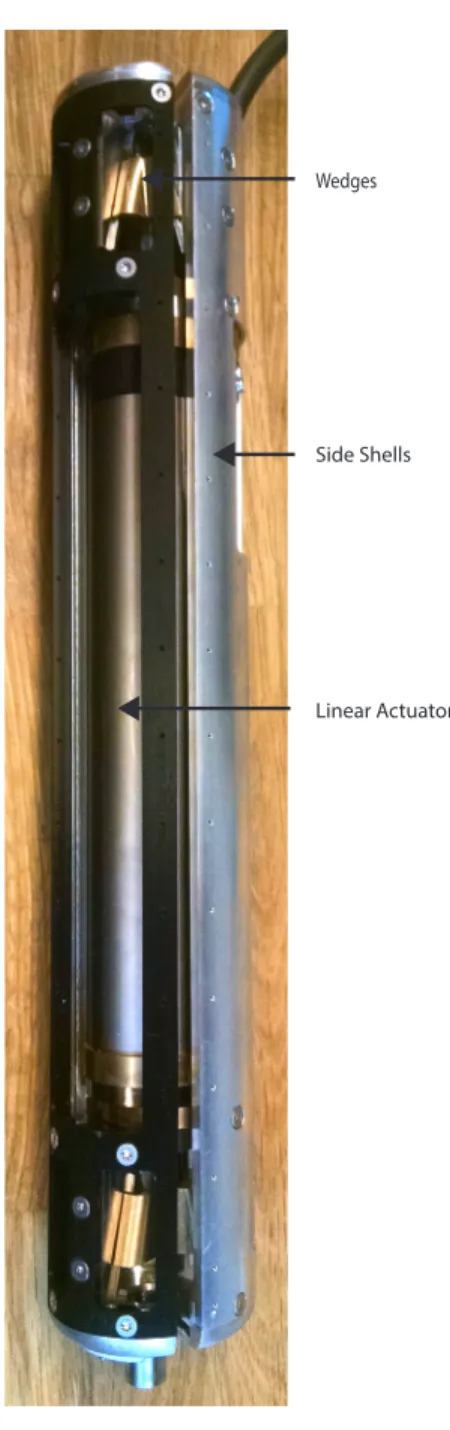
While RoboClam has elucidated the fundamental behavior of localized fluidization burrowing, it is not close to being a plat-form for commercial applications. The actuation system is exter-nal to the end effector, located above the waterline. The device is also very small; anchoring force from a device this size would be minimal. An advanced design is needed to further understand how a device could be created for anchoring in the ocean. This paper presents the scaling laws that govern the design of devices of all sizes. The next generation RoboClam (RoboClam 2, see Fig. 1) is internally actuated and fully waterproof. This device will allow for in lab validation of the scaling laws presented in this paper.
DESIGN REQUIREMENTS Performance Requirements
RoboClam 1 was designed as a research device. It consists of a small ”puppet” which digs in the soil, and external actuation which is above the waterline. This device was used to understand
Linear Actuator Wedges
Side Shells
FIGURE 1. ROBOCLAM 2. This is a figure of RoboClam in its
fi-nalized form. It consists of an internal linear actuator and wedges at the top and bottom which actuate the side shells in and out.
the behavior needed to burrow with localized fluidization. Achieving uniform fluidization around the entire RoboClam is desirable since this results in the most significant drag reduc-tion [9]. RoboClam 1 is rectangular in cross-secreduc-tion and moves in a single degree of freedom when it expands (Fig. 2 top). While this was sufficient for testing, visualization with particle image
velocimetry (PIV) revealed that fluidization was only occurring on the sides of the device that were moving away from the soil. Razor clams are oval-shaped and fluidization can occur around almost the entire outer surface, reducing the force needed to bur-row (Fig. 2 middle). As such, a radially expanding device was selected as the best solution to achieve fluidization on the entire outer surface (Fig. 2 bottom).
FIGURE 2. FLUIDIZED ZONE CROSS-SECTION. This figure
shows a top view of RoboClam 1, a real razor clam, and the RoboClam 2 design (not to scale). The RoboClam 1 moves in a single direction. Zones to the sides of the direction of motion fluidize, but areas where contraction does not occur do not fluidize. The geometry of razor clams allows them to fluidize a much larger amount of the area around their shell. RoboClam 2 will have full fluidization around itself since it con-tracts radially with three shell sections.
Electromechanical control for RoboClam 2 is desired. This will allow for accurately controlling the force and trajectory of the device. Varying these parameters will allow for characteriza-tion of the best method to use when digging. This is an improve-ment from RoboClam 1 which was pneumatically actuated and precise control was more difficult to achieve.
Commercial Partner Requirements
Bluefin Robotics, our commercial partner on this project, is a manufacturer of commercial autonomous underwater vehi-cles. Bluefin Robotics seeks to use RoboClam technology to an-chor their underwater vehicles to the seafloor. This is a need for several reasons. When anchored, an AUV could stay in one place without using any power, either in ocean currents or in a
stream. Sea currents can cause the AUV to drift, sometimes at a rate of up to two knots. Figure 3 shows a depiction of how a RoboClam based AUV anchoring system would work. When a vehicle wanted to stay in one place, it could deploy RoboClam from a port within the vehicle. A tether would attach RoboClam to the vehicle, and provide power to RoboClam. When the ve-hicle wanted to depart its fixed location, RoboClam would be commanded to burrow upwards towards the surface of the soil. The tether would be coiled back into the vehicle as it continued to move to the next location.
FIGURE 3. BLUEFIN 21 WITH ROBOCLAM ANCHOR. This
schematic shows a Bluefin 21 AUV with a RoboClam type device acting as an anchor. The vehicle will have a system to deploy the anchor from its interior. The anchor will reach the seafloor and start burrowing. Upon reaching sufficient depth, the anchor will become effective and anchor the vehicle in place, preventing it from moving in ocean currents.
There are several important factors to consider when design-ing an anchordesign-ing system for an AUV. The design requirements for RoboClam 2 are as follows.
1. A self-contained system with an electrically powered actua-tor integrated as part of the device and sufficiently powerful for a variety of conditions.
2. A device sized to be carried on, and effectively anchor an AUV
3. A device that expands radially, improving digging effective-ness.
4. Move with proper motion to achieve fluidization with the lowest power possible.
RoboClam 2 must be entirely self contained and have inter-nal actuation to allow it to be an anchor for an AUV. This de-vice must be electrically powered since pneumatic or hydraulic systems would be difficult to implement on an AUV, where the energy is stored in batteries.
RoboClam 2 should be 5-7.6 cm (2-3 inches) in diameter to fit within existing ports in the AUV and sufficiently anchor
the vehicle. It should also be short enough to fit inside of the cross section of the AUV - less than 28 cm (11 inches) long for a Bluefin 12 vehicle and 50 cm (20 inches) max for a Bluefin 21 vehicle [3]. These dimensions, as well as a physical review of the AUV, provided insight for the optimal scale of a device and helped narrow the scope of actuator technologies that work for this application.
ANALYSIS
RoboClam 2 consists of three side shells to achieve radial motion. Figure 4 shows the central pieces which moves up and down, sliding along the wedges and moving the side shells in and out. Friction Analysis
Tabs
Moving
Wedge
Fixed WedgeSide
Shell
FIGURE 4. ROBOCLAM WEDGE MOTION DESIGN. This image
shows the motion scheme of RoboClam 2. A central moving wedge is connected to the actuator. The fixed wedges are attached to the side shells and move radially outward. Tabs constrain the side shells to only move radially and not lengthwise with the actuator.
A free body diagram (Fig. 5) was used to analyze the force transmission ratio of the mechanism. We are interested in the ra-tio of force out when compared to force that the actuator provides (Force transmission ratio = Fshell: Factuator). This will tell us how
much force is available to be applied to the soil and pumping of water, and how changing parameters such as the angle of the wedges used for actuationq and friction, µ will affect the device. Achieving a high force transmission ratio is desirable, as this in-creases the depth RoboClam can dig, and the speed at which it can dig.
F
actuatorF
shellN
F
frictionN
F
constraintF
soilF
friction_cθ
N
F
frictionFIGURE 5. FREE BODY DIAGRAM. This free body diagram shows
the forces acting in the sliding mechanism of the device. The from the actuator is split between the three side shells, only one is depicted.
Factuator is the force the actuator can produce. q is the angle of the
wedges in the mechanism design, 14 for this device. Ff riction is the
frictional force, equal toµN. N is the normal force between the sliding and fixed wedge. Fshellis the force the shell can exert on the soil. Fsoilis
the force the soil exerts on the side shell. Fshellmust exceed Fsoilfor the
device to expand. Fconstraintis the force that the tabs exert on the side
shells to constrain them to only radial motion. Ff riction cis the frictional
force from this constraint.
We can solve for Factuatorin terms friction and normal force,
where Ff riction=µN with
Factuator=2µNcos(q) 2Nsin(q). (1)
We can solve for Fshell in a similar fashion
Fshell=Ncos(q) µNsin(q) µFconstraint. (2)
Plugging in Fconstraint=Nsin(q) + µNcos(q) yields
Fshell=N[cos(q) µsin(q)] µN[sin(q) + µcos(q)]. (3)
We can then find the desired force transmission ratio Fshell
Factuator =
[1 2µtan(q) µ2cos(q)]
2[µ +tan(q)] . (4)
For the design parameters of this device (µ = 0.16 [10] and q = 14 ), we get a force transmission ratio of 1.09. This can be increased by either reducing the friction or reducing the angleq.
Mechanical Efficiency
We can find the mechanical efficiency of the mechanism based on this force transmission ratio. The device has an effec-tive gearing of 2:1; for each inch the actuator moves, the device expands half an inch in diameter. With a force transmission ratio of 1.09, the device has an efficiency of 55% (force transmission ratio / gear ratio).
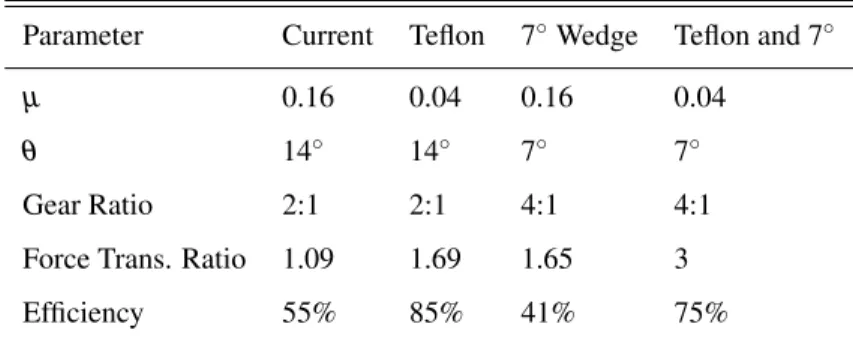
The results of the last two sections are summarized in Ta-ble 1. To improve the force output of the mechanism, teflon-on-teflon sliding surfaces can be used (µ = 0.04) [11], the angle of the wedge can be reduced from 14 to 7 , or both of these can be done.
TABLE 1. Case Study for Wedge Design
Parameter Current Teflon 7 Wedge Teflon and 7
µ 0.16 0.04 0.16 0.04
q 14 14 7 7
Gear Ratio 2:1 2:1 4:1 4:1
Force Trans. Ratio 1.09 1.69 1.65 3
Efficiency 55% 85% 41% 75%
For future iterations, teflon coated surfaces could be used to maintain structural characteristics of the sliding wedges while reducing friction. The wedge mechanism used in RoboClam 2 was not optimized for efficiency; rather, a geometry was chosen to fit within the packaging constraints of the device.
Force for Re-Expansion in Static Soil
Properly sizing the actuator for the RoboClam device was an important part of this design. Since it is easier to move through fluidized soil than packed soil, it was determined that the maxi-mum force that needs to be achieved is when the RoboClam is in a bed of soil, expanding from a contracted state, and the particles around the device are settled.
Mohr’s circle [12] can be used to represent the stress state in the soil for passive failure (failure resulting from an increase in horizontal stress) for the soil in a settled state [13]. The force the actuator can achieve in the radial direction multiplied by the shell projected area are used to find horizontal max stress. This is then used to determine the depth RoboClam can be buried and still passively fail the soil.
The maximum force with the current design that can be achieved in the radial direction is 278 N. Dividing this by the projected area of RoboClam (0.018 m2) gives a horizontal stress
of 15444 Pa. We can solve Mohr’s circle to find the vertical stress corresponding with this horizontal stress. We can divide
this value (6267 Pa) by gravity and the effective density of the fluid particle mixture at a settled state density (1980 kg/m3, for
a fluid, glass bead mixture with a 38% packing fraction). This yields a depth that the RoboClam can burrow of 0.323 meters, which is approximately one body length. While this depth is sufficient for current testing, greater radial force is desired for future iterations to allow RoboClam to burrow deeper. This can be achieved by reducing friction or changing the wedge angle as discussed previously.
τ
σ
σ
push,rσ
v0= ρ
effgh
ф
FIGURE 6. MOHRS CIRCLE FOR PASSIVE FAILURE. This figure
depicts the soil state for passive failure. The depth at which the anchor is set determines how much stress is needed to fail the soil. t is shear stress,s is normal stress, f is the friction angle (25 for this media), sv0is the vertical stress, andspush,ris the horizontal stress.
Pumping Power - Max Contraction Force
An understanding of the dominate power needs in the system is important for designing RoboClam devices of different sizes. While RoboClam 2 uses one method for achieving radial motion, other methods could achieve the same motion with different de-sign characteristics (such as lower mass and inertia or a higher force transmission ratio). Understanding the behavior of the fluid within the device is important for future designs, as the fluid is more difficult to accurately characterize than the mechanism dy-namics, and can contribute significantly to device performance.
In order to calculate the power needed to pump fluid out of RoboClam through the fluid outlets, we consider the RoboClam as a annular cylinder control volume with a smaller outlet area than the cross sectional area of the annular cylinder (Fig. 7). This cylinder collapses as the device contracts, with the diameter of the annulus and the outlet area remaining constant. Fluid only leaves the top of the contracting cylinder, but cannot pass through the walls or through the bottom of the device.
For this problem we will consider an annular cylindrical control volume V (z,t) that contracts as the device moves. This CV ranges from the bottom of the device up to position z so the fluid velocity and corresponding internal pressure can be found at any position z. z R r(t) V(z,t) AE A(z) w(z,t) wE(t) z=h Conservation of mass Bernoulli
FIGURE 7. ROBOCLAM CONTRACTING. This figure shows the
control volume used to find the internal pressure of water as the device is contracting. Conservation of mass was used in the control volume, and unsteady Bernoulli was used from the top of the CV to the exit of the device.
We can perform a conservation of mass analysis on the con-trol volume. This equation takes the form
d dt Z CVrdv + Z CSr(~U ~Uc)·~ndA = 0. (5)
The first term describes the rate of change of mass within the control volume, and the second term describes mass flow through the control surfaces.
The fluid density isr, ~U is the fluid velocity, and ~Ucis the
control surface velocity, and ~n is the outward facing normal. For this case, Eq. 5 simplifies to
r∂V(z,t)
∂t +rw(z,t)A(z) = 0, (6)
where V (z,t) is the volume of the CV and w(z,t) is ~U ·~n, or velocity - in this case we assume one dimensional flow due to the long aspect ratio of the device. A(z) is the cross sectional area of the annular cylinder.
We can rearrange to solve for the upward fluid velocity w(z,t).
w(z,t) = 1
A(z)
∂V(z,t)
∂t . (7)
Substituting in the cross sectional area and volume for the annular cylinder yields
w(z,t) =p(r(t)21
R2)2pr(t)z
dr(t)
dt . (8)
To account for the change in area at the outlet, we substitute in the outlet area AEat z = h
wE(t) = w(z = h,t) = 1
AE2pr(t)h
dr(t)
dt , (9)
where wE(t) is the fluid velocity through the outlet.
To determine pressure throughout the CV, we must apply conservation of momentum. Since we assume it is one dimen-sional flow, we can accomplish this by using Bernoulli’s Equa-tion for unsteady flow between the exit surface of the control volume at z, and the outlet of the device at h [14].
PE+12rw2E+Ploss=P(z) +12rw(z,t)2+r Z h z dw(z⇤,t) dt dz⇤, (10) where PE is the pressure at the outlet, plossis the pressure drop
over the mesh at the outlet, w(z,t) is the velocity in the device, wE is the exit velocity, P(z) is the pressure at any point in the
device.
We can solve this for the pressure at any location z
P(z) = PE+Ploss+12r(w2E(t) w(z,t)2) r Z h z dw(z⇤,t) dt dz⇤. (11) Thus, the equation for the force acting on the each side shell is
F(t) =Z h
0 P(z)2r(t)dh. (12)
We will use this model later and compare these results to the experimentally measured power consumption from expand-ing and contractexpand-ing the device.
WATER AND AIR CONTRACTIONS
Determining the power needed to move the fluid in RoboClam 2 can be done experimentally. This data can be com-pared to the analytical model to validate the method used to de-termine power for pumping fluid out of the device. For a con-traction cycle, we can calculate the power needed to move the device by knowing the force and velocity of the actuator. In wa-ter, power accounts for moving the actuator (accelerating, decel-erating, and overcoming friction in the device) and moving water. In air, the power is only used for moving the actuator and fric-tion. To determine the power to move fluid, find the difference between these two with
Powerwater=Poweractuate in water Poweractuate in air. (13)
This assumes the kinematics of the motion are similar result-ing in similar power to overcome inertia in each case. To achieve the same kinematics, we command the actuator to move with a known position profile and calculate the actual position profile and the force during the cycle.
Figure 8 shows the position vs time profiles for moving in air and water. Both profiles are fairly similar. Due to actuator con-stants, the velocity when moving in air is slightly faster, though similar enough for an adequate comparison of power between the two cases.
To find power for the motion, we calculate the force during a motion cycle, achieved by multiplying the current draw by the motor constant (17 N/A) for the LinMot linear actuator used in RoboClam 2 [15]. We can find velocity by differentiating the po-sition profile. The product of force and velocity gives mechanical power of the device. This is shown in Fig. 9.
With this analysis, we have shown that we can accurately identify fluid affects in the system. We now have a framework for understanding the mechanical and fluid power needs for the system, which can be used to determine power requirements for different device sizes.
Comparison to Pumping Model
Validating the analytical model for pumping power can be done using experimental data by investigating the motion that is
0.7 0.8 0.9 1 1.1 1.2 1.3 −15 −14 −13 −12 −11 −10 −9 −8 −7 −6 −5 x 10⁻³
Time (s)
Position (m)
Air WaterFIGURE 8. CONTRACTION IN AIR VERSUS WATER. In this plot
a contraction, pause, and expansion cycle is shown for RoboClam. Con-traction of 10 mm total for linear actuator motion corresponds to approx-imately 5 mm contraction in diameter. As can be seen by the slopes, con-traction in water is slower than concon-traction in air. This can be accounted for due to the differences in power needs for moving with water and air. Proper tuning of the controller could further minimize these differences, but they are expected for such different contraction conditions. achieved when RoboClam contracts when filled with water. We use the position recorded by the actuator to determine r(t) and its derivatives. These are substituted into in Eq. 8 as dr
dt. The
param-eters for RoboClam 2 are outlet area AE = 8.59 x 10 4m2,r =
1027 kg/m3, length h = 0.355 m, actuator radius R = 1.85 x 10 2
m, and exit pressure PE = 0. We can substitute the result into Eq. 11 to calculate the pressure on the inside of the device. We can then integrate over the height of the device and multiply by the projected area to find the total force. Power can be calculated from this by multiplying force and shell velocity. The power cal-culated analytically can be compared to the measured power for moving the water presented in the previous section.
The predicted power (Fig. 10) is close to the actual power used to move the fluid during motion of RoboClam. This model is beneficial for future designs, as power predictions can be made for larger size devices, allowing for proper actuator sizing. Dis-crepancies in the plots are based on simplifications made when modeling the pressure drop over the complex internal features in RoboClam. Additionally, the flexible seal is folded inward and slightly reduces the cross sectional area of the device. Correction factors can be added to the model to account for complex inter-nal geometry which will bring the predicted power value closer to the analytical result.
0.8 1 1.2 1.4 1.6 1.8 2 0 5 10 15 Time (s) Power (W) Contract in Air Contract in Water Power Water
FIGURE 9. POWER USE. Power is plotted against time for two
con-traction expansion cycles. This is done for two different conditions, first for the mechanism when moving in air and then for the mechanism mov-ing in water. The power for movmov-ing the water is the difference between the two. For motion in air, differences in power between contraction and expansion can be attributed to variations in directional friction, varia-tions in force to move the seal, and steel tabs in the device which are attracted to the magnetic portion of the actuator.
Conclusion and Future Work
In this paper we have presented metrics which can be used for determining scaling relationships for localized fluidization burrowing. To design a variety of devices of different sized, these parameters can be adjusted to predict the necessary device weight and size, actuator power, and the speed at which the device can move.
We have shown that we can theoretically predict the power needs for different sized devices. The next step for the project is to complete testing of RoboClam 2 in soil; this will allow for comparison between derived burrowing parameters and device performance. Upon testing, we will have a full set of validated knowledge of how to design systems of different sizes for many different underwater applications.
ACKNOWLEDGMENT
This work was sponsored by the National Science Founda-tion Graduate Research Fellowship under Grant No. 1122374 and Bluefin Robotics. The authors would like to thank A. Josh Wiens and Raghav Aggarwal for their support in this project.
1.4 1.6 1.8 2 2.2 2.4 2.6 0 1 2 3 4 5 6 7
Time (s)
Power (W)
FIGURE 10. SIMULATED POWER USE. A plot of power use vs
time for contraction and expansion cycles shows that when using the motion trajectory of RoboClam, the analytical model presented is an accurate representation of the power needed for contraction. This can be seen by comparing this data to the power consumption for moving water shown in Fig. 9. The model underestimates the power needed since the loss coefficients used in the model are conservative for this situation.
REFERENCES
[1] Dorgan, K. M., Jumars, P. A., Johnson, B., Boudreau, B. P., and Landis, E., 2005. “Burrowing mechanics: Burrow ex-tension by crack propagation”. Nature, 433(7025), 02, pp. 475–475.
[2] Maladen, R. D., Ding, Y., Li, C., and Goldman, D. I., 2009. “Undulatory swimming in sand: Subsurface locomotion of the sandfish lizard”. Science, 325(5938), 07, pp. 314–318. [3] Meeting with bluefin robotics, June 2013.
[4] Personal obervation by authors, June 2011.
[5] Holland, A., and Dean, J., 1977. “The biology of the stout razor clam tagelus plebeius: I. animal-sediment re-lationships, feeding mechanism, and community biology”. Chesapeake Science, 18(1), pp. 58–66.
[6] Winter, A. G., and Hosoi, A. E., 2011. “Identification and evaluation of the atlantic razor clam (ensis directus) for bi-ologically inspired subsea burrowing systems”. Integrative and Comparative Biology, 51(1), 07, pp. 151–157. [7] Winter, A. G., Deits, R., Dorsch, D., Hosoi, A., and
Slocum, A., 2010. “Teaching roboclam to dig: The design, testing, and genetic algorithm optimization of a biomimetic robot”. IROS, pp. 4231–4235.
[8] Winter, A., Deits, R., Dorsch, D., Slocum, A., and Hosoi, A., 2014. “Razor clam to roboclam: burrowing drag reduc-tion mechanisms and their robotic adaptareduc-tion”. Bioinspira-tion and Biomimetics, 9(3), p. 036009.
[9] Dorsch, D. S., and Winter, A. G., 2014. “Design of a low energy, self contained subsea burrowing robot based on lo-calized fluidization exhibited by atlantic razor clams”. In ASME IDETC 2014, no. DETC2014-34953.
[10] “Coefficient of friction”. In Engineers Handbook 2006. [11] Stanton, J., 2010. “Friction coefficients for stainless steel
(ptfe) teflon bearings”. In Wisconsin Highway Research Program.
[12] Hibbeler, R. C., 2000. Mechanics of Materials, 4th ed. Prentice Hall.
[13] Terzagi, K., Peck, R., and Mesri, G., 1996. Soil Mechanics in Engineering Practice. Wiley-Interscience.
[14] White, F. M., 1998. Fluid Mechanics, 4th ed. McGraw-Hill.