HAL Id: hal-01189774
https://hal.archives-ouvertes.fr/hal-01189774
Submitted on 31 May 2020
HAL is a multi-disciplinary open access
archive for the deposit and dissemination of
sci-entific research documents, whether they are
pub-lished or not. The documents may come from
teaching and research institutions in France or
abroad, or from public or private research centers.
L’archive ouverte pluridisciplinaire HAL, est
destinée au dépôt et à la diffusion de documents
scientifiques de niveau recherche, publiés ou non,
émanant des établissements d’enseignement et de
recherche français ou étrangers, des laboratoires
publics ou privés.
genomes
Zeev Frenkel, Etienne Paux, David Mester, Catherine Feuillet, Abraham Korol
To cite this version:
Zeev Frenkel, Etienne Paux, David Mester, Catherine Feuillet, Abraham Korol. LTC: a novel
algo-rithm to improve the efficiency of contig assembly for physical mapping in complex genomes. BMC
Bioinformatics, BioMed Central, 2010, 11, �10.1186/1471-2105-11-584�. �hal-01189774�
M E T H O D O L O G Y A R T I C L E
Open Access
LTC: a novel algorithm to improve the efficiency
of contig assembly for physical mapping in
complex genomes
Zeev Frenkel
1*, Etienne Paux
2, David Mester
1, Catherine Feuillet
2, Abraham Korol
1Abstract
Background: Physical maps are the substrate of genome sequencing and map-based cloning and their
construction relies on the accurate assembly of BAC clones into large contigs that are then anchored to genetic maps with molecular markers. High Information Content Fingerprinting has become the method of choice for large and repetitive genomes such as those of maize, barley, and wheat. However, the high level of repeated DNA present in these genomes requires the application of very stringent criteria to ensure a reliable assembly with the FingerPrinted Contig (FPC) software, which often results in short contig lengths (of 3-5 clones before merging) as well as an unreliable assembly in some difficult regions. Difficulties can originate from a non-linear topological structure of clone overlaps, low power of clone ordering algorithms, and the absence of tools to identify sources of gaps in Minimal Tiling Paths (MTPs).
Results: To address these problems, we propose a novel approach that: (i) reduces the rate of false connections and Q-clones by using a new cutoff calculation method; (ii) obtains reliable clusters robust to the exclusion of single clone or clone overlap; (iii) explores the topological contig structure by considering contigs as networks of clones connected by significant overlaps; (iv) performs iterative clone clustering combined with ordering and order verification using re-sampling methods; and (v) uses global optimization methods for clone ordering and Band Map construction. The elements of this new analytical framework called Linear Topological Contig (LTC) were applied on datasets used previously for the construction of the physical map of wheat chromosome 3B with FPC. The performance of LTC vs. FPC was compared also on the simulated BAC libraries based on the known genome sequences for chromosome 1 of rice and chromosome 1 of maize.
Conclusions: The results show that compared to other methods, LTC enables the construction of highly reliable and longer contigs (5-12 clones before merging), the detection of“weak” connections in contigs and their “repair”, and the elongation of contigs obtained by other assembly methods.
Background
Until very recently, genome sequencing projects such as the human ([1,2]), mouse ([3], rice ([4]), or maize gen-ome projects ([5,6]) have relied on the construction of physical maps as a framework to support BAC-by-BAC or whole-genome shotgun sequencing [7]. Alternatively, genome sequencing could be conducted via whole gen-ome shotgun approach ([8-11] etc.) or using the novel next generation sequencing technologies (e.g., [12-14]). Physical maps can be established via BAC clones
fingerprinting using restriction enzyme profiling [15-22] or by digital fingerprinting [23-25], and subsequent assembly of the clones into contigs based on the sys-tematic comparison of fingerprint profiles. BAC contigs are then ordered using molecular markers and genetic or radiation hybrid maps. In addition, to providing a framework for sequencing, such maps can be used for high-resolution gene mapping [26-28] and map-based gene cloning [29-34]. Despite significant progress in fingerprinting techniques such as High Information Content Fingerprinting (HICF) [22] and the develop-ment of efficient programs such as FPC (FingerPrinted Contigs) [35,36], maximal likelihood-based
* Correspondence: [email protected]
1University of Haifa, Institute of Evolution, Haifa 31905, Israel
Full list of author information is available at the end of the article
© 2010 Frenkel et al; licensee BioMed Central Ltd. This is an Open Access article distributed under the terms of the Creative Commons Attribution License (http://creativecommons.org/licenses/by/2.0), which permits unrestricted use, distribution, and reproduction in any medium, provided the original work is properly cited.
reconstruction of physical map [37,38], random cost algorithm minimizing triplewise linking distance [39], etc. to automatically cluster clones into contigs, physical mapping remains long, laborious, and expensive espe-cially for large and complex genomes that contain a high amount of repeated sequences (e.g., maize or wheat genome). Therefore, the development of algorithms and methods making this process more cost effective is important in view of the increasing amount of non-model species that will be sequenced in the near future.
The basis of contig assembly is that the same DNA fragments in different clones are cut by a given restric-tion enzyme at the same sites. Hence, the presence of fragments with the same length in the fingerprints of two clones, c1 and c2, indicates a possible overlap
between these clones. However, in large genomes, the abundance of repeated elements and the limited accu-racy of scoring the band lengths may lead to the identi-fication of shared bands for two clones that originate from different parts of a chromosome, thereby reducing the reliability of contig assembly. Thus, contig assembly relies on the identification of significant overlaps. This implies the calculation of p-values of clone overlap for any pair of clones c1and c2. Namely, the p-value is the
probability for two random clones to have the same or a higher number of shared bands by chance. The exact calculation of the p-value is usually problematic (reviewed in Wendl, 2005 [40]). The FPC software uses the Sulston approximation [17] that is based on the sim-plest model of taking into account tolerance (the accu-racy of fragment length scoring), and the assumption that appearances of fragments (bands) of different lengths are independent and identically distributed (iid assumption). This approximation is valid in cases where a small number of clones are matching but can be very inaccurate in situations with an intermediate to large number of common bands [40,41]. Moreover, it was observed that different bands can have very different abundances within a fingerprint database. To take this variation into account Nelson et al. (2005) [6] proposed to exclude the most abundant bands for reducing the proportion of false overlaps. Other ways of taking into account band frequencies based on Bayes Theorem were also proposed (e.g., [42,43]), but such methods are cum-bersome, especially with HICFs (e.g., [44]).
The FPC program package assembles clones into con-tigs based on fingerprints generated by either the end-labeled double digest method [15,18] or the complete digest method [16,45]. Because of technical difficulties related to the large amount of clones to order, FPC divides the clones into subsets of relatively small contigs in which clones are supposed to be highly significantly overlapping. Clones are ordered using local optimization and building band maps. To achieve a treatable size and
ensure high accuracy of contigs, FPC users usually employ a very high initial threshold (cutoff) for the p-value of clone overlaps. However, for many clone pairs that do overlap physically, the p-value may not overcome such a cutoff. As a result, numerous short sub-contigs and singletons are produced calling for subsequent mer-ging. In fact, the ordering of bands and highly overlap-ping clones in short contigs is questionable. The merging of short sub-contigs and singletons is also problematic.
Additional difficulties can be caused by the presence of “questionable” (chimerical or poorly fingerprinted) clones (referred to as Q-clones). The presence of Q-clones and false clone overlaps can result in a wrong clone order or even in the assembly of clones deriving from different parts of the genome into the same contig. The presence of bands with similar lengths also make a clone ordering complex thereby hampering the correct map assembly [46] and resulting in low-quality mini-mum tiling paths (MTP). In particular, unexpected gaps can arise when a MTP is checked by sequencing (e.g., via BAC end sequencing). Although many physical maps have been constructed with the standard FPC algorithm and successfully employed for genome sequencing, quite a lot of errors in contig assembling were also found [47]. The diversity of factors affecting the map quality in different situations calls for the development of new methods and tools complementing FPC and other exist-ing packages. This problem is especially important for physical mapping of complex genomes with a high level of repeats, such as in wheat [48] and barley.
In this paper, we present a novel approach coordinat-ing clone clustercoordinat-ing and ordercoordinat-ing. We also propose to use a new metric of clone overlap instead of the stan-dard Sulston score. In contrast to FPC, the Linear Topology Contig (LTC, available upon request from the corresponding author) program starts clustering with a relatively relaxed cutoff and uses the topology of signifi-cant clone overlap to obtain longer contigs with a realis-tic (linear) structure. In each cluster, clones are ordered based on a global optimization procedure, and clones that disturb the order stability (assessed by re-sampling analysis) are excluded from the contig. Ordered contigs are then merged with a relaxed cutoff into longer con-tigs using the network representation of the significant clone overlaps as a control of the contig topology (simi-lar ideas were used by Waterman et al., 1986 [49]; Cuticchia et al., 1992 [50]; Zhang et al., 1994 [51] and others). In addition to contig building, LTC can be used for verification, repairing, and elongation of contigs obtained by other methods (e.g., FPC).
The reliability of the proposed methodology was assessed with HICF data from the wheat 3B physical map [48]. The performance of LTC vs. FPC was com-pared also on the simulated BAC libraries based on the
known genome sequences for chromosome 1 of rice and chromosome 1 of maize. The results demonstrate that contigs built by LTC are longer, better ordered, and more robust to errors caused by false and missing bands than those obtained by FPC and can make the MTP selection more effective, leading to more reliable physi-cal maps and increased sequencing cost efficiency.
Methods
I. Contigs Construction
In LTC, the contig construction algorithm includes the following steps: (i) calculation of p-values for clone overlaps; (ii) temporary exclusion from the analysis of the clones and clone overlaps unproved by parallel paths; (iii) adaptively changing cutoff clustering; (iv) “non-linear” cluster splitting into sub-clusters with lin-ear topological structure; (v) global optimization order-ing; (vi) verification of the orders by re-samplorder-ing; (vii) sub-contig merging into contigs; and (viii) MTP construction.
(i) Calculation of p-values for clone overlaps
In the first step, LTC calculates all pair-wise p-values Pr (c1, c2) of clone overlaps and selects threshold Pr0
(cut-off) to declare clones c1 and c2 with Pr(c1, c2) <Pr0 as
overlapping clones. A proper choice of the threshold Pr0
should provide a reasonable trade-off between two requirements: (a) providing a sufficient number of pairs of overlapping clones, and (b) reducing the proportion of false overlaps among selected clone pairs. Instead of the Sulston score Pr(Sulst)employed in the FPC package, LTC uses metrics Pr(Siid) and Pr(Sind) that estimate p-values more accurately (refer to Additional file 1, Sec-tion 1 for descripSec-tion of calculaSec-tion) and the corre-sponding modifications Pr(SiidM) and Pr(SindM)that take into account the number of shared genetic markers. Metric Pr(Siid) is based on the Sulston model of “ran-dom” clones [17]. This model assumes that appearances of fragments (bands) of different lengths are indepen-dent and iindepen-dentically distributed (iid assumption). Unlike the Sulston score, Pr(Siid)provides a good approximation even in situations with relatively large clones and a high number of matching × bands. Metric Pr(Sind)is based on a model with similar assumptions, but bands may not be identically distributed (in contrast to iid assumption) (for details see Additional file 1, Section 1).
Let n1 and n2 be the numbers of bands in clones c1
and c2. LTC approximates the probability that the
num-ber of bands present in both clones c1 and c2 is equal or
higher than k by exp{-(a0 + a1k + a2k2)}, for k > k0.
Coefficients a0, a1, and a2 are estimated by the
Monte-Carlo method, i.e., by simulating a large number of pairs of random clones (with n1 and n2 bands) and scoring
the“observed” number of shared bands (refer to Addi-tional file 1, Section 1 for details); value k0 is defined by
inequality: exp{-(a0+ a1k+ a2k2)} < 0.001 for all k > k0
(see also Additional file 1, Section 2). Shared genetic markers are taken into account by adding the term amarkmto a0 + a1k + a2k
2
, where m is the number of shared markers. We used amark= 100 ln 10 to make the
overlap of clones with a shared marker more significant than 10-100. If bands are not assumed to be identically abundant, then the number of shared bands k is repre-sented by -∑ lnfb, where the sum is taken over all shared
bands and fbis the abundance of band b. Clearly, if all
bands have equal abundances then k is proportional to the number of shared bands (i.e., both formulations will give the same result). Values fbcan be estimated by the
maximum likelihood method: the probability that a ran-dom clone with n bands contains band b is 1-(1-fb)n.
[Logarithm of likelihood is then equal to∑c with b
log(1-(1-fb)n(c)) + ∑c without blog((1-fb)n(c)); for small fb(fb<<1/
nmax, nmax= maxcn(c)), the maximum likelihood
estima-tion for fbis close to nmean-1 πb/(1-πb), whereπb is a
proportion of clones in the entire database having band b and nmeanas the mean number of bands in the clone].
Taking band abundances into account satisfies the addi-tive condition, when the sum of weights of two bands is equal to the weight of “pair of bands” that appears with an abundance equal to the product of abundances of the bands (because bands are supposed to be independent).
(ii) Temporal exclusion of clones and clone overlaps not proved by parallel paths (TENPP-procedure)
In contrast to FPC, LTC excludes putatively false signifi-cant overlaps and putatively problematic clones before clustering. The main idea behind the identification of problematic clones and clone overlaps is that each part of the chromosome is most probably covered by several clones (although in fact, some parts can be uncovered or poorly covered by clones of the BAC library). One can expect that chimerical clones and false clone over-laps are not proven by parallel clones [39,52]. Thus, clustering should subdivide the clones into groups cov-ering different parts of the chromosome. LTC clusters the clones in such a way that each position of a chro-mosomal region (without ends), covered by clones from the cluster, is covered by several (at least by three) sig-nificantly overlapping clones. Moreover, it requires that, even after excluding any single clone or clone overlap, for any pair of clones ci and cj from the cluster C0, a
sequence of clones c(1),..,c(n) from C0 should exist
such that c(1)= ci, c(n)= cjand overlap of clones c(k)and
c(k+1)is significant for all k = 1,..,n-1.
Let Pr0 be a liberal level of cutoff (we used 10-12≈10-3/
N2, with N≈60,000 clones in our analyses). LTC calcu-lates all pair-wise clone overlaps Pr and considers the results as a net of significant (relative to the selected cutoff Pr0) overlaps. For each edge e (significant overlap)
of the net, parallel short paths (of 2-5 edges) connecting vertexes (clones) of edge e, but not going through edge e, are searched (see Additional file 2, Fig. AF2.1a). Edges having no such paths are temporarily excluded from the analysis. Then, the following procedure is applied to each vertex c0: for each pair of neighbor vertices c1 and
c2 (connected with c0by edge, i.e., Pr(c0,c1) < Pr0 and Pr
(c0,c2) < Pr0), short“parallel” paths of 2-5 edges in this
net, connecting vertices c1 and c2, but not going through
vertex c0, are searched (Additional file 2, Fig. AF2.1b).
Vertices having at least one pair of neighbors without such parallel paths are also temporarily excluded from the analysis. The excluded clones and overlaps can be used later to merge or elongate contigs (see below). For convenience, we refer to such a procedure ofTemporal Excluding from the analysis Not proven by Parallel Paths as to the TENPP procedure with respective cutoff.
(iii) Clustering with“adaptively” varying cutoff
The ideal way to obtain a reliable contig assembly is to write down a full likelihood for the entire problem that allows a possibility for errors and repeats in data and find out all solutions with likelihood close to the maxi-mum [37]. However, the expected length of band map for entire dataset is usually too long and finding maxi-mal likelihood solution will be too hard even for mod-ern computers. Moreover, estimating the probabilities included in the likelihood function is also not straight-forward. Subdividing the data into clusters putatively covering non-overlapped parts of genome sequences by identification of putatively false clone overlaps and chi-merical clones can simplify the problem [37]. In contrast to FPC that uses a stringent uniform cutoff LTC starts clustering with a liberal cutoff Pr0 by the single-linkage
algorithm [53], and selects the resultingreasonably sized clusters (rs-clusters). By “reasonably sized clusters”, we arbitrarily (for certainty) define clusters with 6-500 clones. Actually, larger clusters also can be analyzed by the LTC program and subdivided into parts with linear topological structure (see below). Such a restriction was used to reduce the CPU time increasing cubically with number of clones in cluster. Additional reason for this restriction was the fact that the program Pajek [54] used for the visual control of the net structure of significant overlaps cannot represent large nets well. Using other programs for net visualization can help to overcome this problem. Artificial split of real contig can result in addi-tional errors in ordering of obtained parts complicating their merging on the next steps.
For each cutoff level, LTC excludes putative false clone overlaps and putative chimerical clones in large clusters (with more than 500 clones) by the TENPP pro-cedure described above. Then, the single linkage algo-rithm is run again. At the next step, LTC increases the stringency, but only after removing the selected
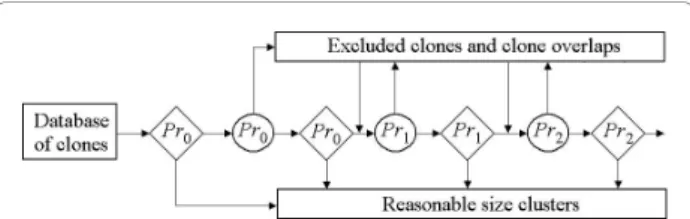
reasonably sized clusters (i.e., protecting them from further“dissolving”). A schematic representation of the algorithm is provided in Figure 1. Refer to Additional file 1, Section 3 for simple example illustrating the effi-ciency of the proposed algorithm. Note that repeating the TENPP procedure will be effective only in cases of high proportions of false significant clone overlaps. If such proportion is not high, then it is reasonable to expect that most of the putatively chimerical clones and false clone overlaps will be excluded directly after the first TENPP procedure. Sizes of clusters can also be reduced by temporary exclusion of “buried” clones. These clones can be used later to obtain more reliable band maps.
(iv) Looking for linear topological structure
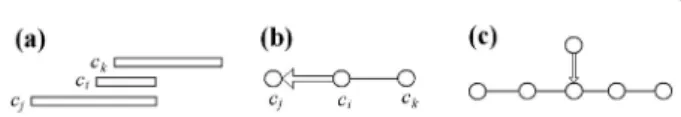
False clone overlaps and chimerical clones can lead to clusters with non-linear topological structures (Figure 2a) which is incompatible with the one-dimensional structure of eukaryotic chromosomes. To facilitate the detection and visualization of such clusters, LTC employs a representation of clusters as nets of signifi-cant overlaps. Obviously, ordering topologically non-lin-ear clusters is problematic. To overcome this problem, we propose to split such clusters into sub-clusters with linear topological structure by excluding clones from the branching nodes from the analysis (Figure 2b).
Non-Figure 1 Scheme of clone clustering with adapting cutoff. Diamonds denote single-linkage clustering with corresponding cutoff. Circles denote procedure of excluding clones and clone overlaps not proved by parallel paths in the net of significant (relative to the corresponding cutoff) clone overlaps from the analysis.
Figure 2 Problematic clusters with non-linear topological structure. (a) Identification of non-linearity of cluster topological structure: presence of vertices with not too small ranks (e.g., more than 2) points to non-short offshoots from the selected diametric path (marked in bold line). (b) Splitting clusters into sub-clusters having linear topological structure. See also Additional File 1, Section 4.
linearity of the cluster structure can be detected by scor-ing ranks of vertices relative to the diametric path. By definition, a diametric path of the net is the longest, in terms of the number of edges, among the shortest paths between all possible pairs of vertices (e.g., [55]). Note that several diametric paths can exist for the same net. Any of diametric paths can be used for detection of non-linearity: The presence of vertices with rank 2 and higher indicates on non-short offshoots from the selected diametric path and, hence, a possibility of non-linear structure (Figure 2a).
(v) Ordering using global optimization
LTC orders clusters with linear topological structures without constructing their band maps. Here, the order-ing problems are formulated in terms of global optimi-zation of some criterion (similar to Fickett and Cinkosky, 1992 [56]; Alizadah et al., 1993 [57]; Wang et al., 1994 [39]; Flibotte et al., 2004 [46]). For simpli-city, let’s consider only the situation where all clones are not buried. This can be achieved by the temporal exclu-sion of buried clones, although sometimes this can lead to loosing the contig connection. The criterion W(Ω) of clone orderΩ = (cΩ(1),..., cΩ(n)) is calculated as:
W( )Ω =Σk=1,..,n−1WΩ( )k,Ω(k+1)−b( )ΩW0,
where Wi,j= -log Pr(ci, cj), b(Ω) is the number of
adja-cent (within orderingΩ) clones with Pr(cΩ(k), cΩ(k+1)) >
Pr0 and W0is the penalty for non-significant overlap of
adjacent clones.
The maximization of such criterion can be reformu-lated as the well-known and intensively studied Travel-ing Salesman Problem (TSP) without the need to return to the starting point. Let Wmax be the maximum of
Wi, j = -log Pr(ci, cj). LTC defines distance between two
clones as
d c c( ,i j)=Wmax −Wi j, +W01{Pr c c
(
i, j)
>Pr0},where1{Pr(ci, cj) >Pr0} is indicator function equal to 1,
if Pr(ci, cj) >Pr0, and equal to zero otherwise. Global
optimization is effective especially when marker infor-mation is also available [46]. The exact solution to the TSP is a computationally challenging problem. Never-theless, good heuristics (e.g., based on evolution strategy optimization) for the solution of TSP were developed for situations where the number of vertices is up to 103 orders of magnitude [58]. Coordinates of clone ends within the contig based on the solution path Ωbestcan
be calculated by methods proposed by Flibotte et al. (2004) [46]. Using such global optimization approach can result in a reduced number of Q-clones and of places in the contig where two neighbor clones have an
unexpected non-significant overlap. More effective tri-plewise linking distance also can be used to reduce the effect of false positive and false negative bands [39].
(vi) Resampling verification of ordering
The quality of the clone order within a contig is charac-terized not only by the value of the chosen criterion, but also by its robustness to small uncertainty of band content of the clones, which can be referred to as “con-tig stability”. To evaluate this stability, LTC uses jack-knife re-sampling iterations (in contrast to bootstrap ones used in Cuticchia et al., 1993 [59] and Wang et al., 1994 [39], that can artificially increase the significance of clone overlaps). Namely, LTC first constructs the order using clone overlaps scored over all bands. In addition, it constructs orders using clone overlaps based on randomly selected subsets of bands (say, 95% of the total set of bands). Then, the identification of unstable regions is conducted based on the frequency distribution of the right-side and left-side neighbors for each clone in the contig order. The higher the deviation from 1 (i.e., from the“diagonal” pattern) is, the less certain the local order is ([58,59]). One of the main reasons for the appearance of unstable orders is the high similarity of parallel clones that cannot be ordered properly due to missing and false bands. Excluding parallel clones allows the construction of a stable“skeleton” map, simi-larly to the approach suggested for building genetic maps (see [58]).
(vii) Merging of sub-contigs
After ordering, LTC tries to elongate contigs by merging those that display significant end-to-end overlaps (which may be also achievable by adding 1-2 supplementary intermediate clones), or by adding singletons. First, LTC re-analyzes all clones and clone overlaps temporally excluded at previous stages (see above). To elongate a concrete contig, LTC searches for all clones connected (by significant overlaps or via short paths of significant overlaps) with the clones from either of the contig ends. If adding all of the clones (for one of the two contig ends) does not lead to a violation of contig linearity, then such elongation is not problematic. If adding the clones does lead to branching (i.e., contradicts the linear structure of the chromosome), then each of the possibi-lities of linear elongations needs to be considered (e.g., see Additional File 2, Fig. AF2.2). The correct elongation can be detected by testing clone overlaps based on clone-end sequencing [23]. The same problem arises when clones from one contig significantly overlap with internal clones from another contig. The availability of DNA markers (in clones) with known chromosomal position helps to prevent the merging of contigs from different chromosomal zones. Contigs resulting from elongation should be reordered (see stage (v)).
(viii) MTP establishment
In the current version of LTC, MTP construction was based only on the topology of clone overlaps without building of the band map (in contrast to FPC). In our algorithms, we assume: (i) that MTP should include the terminal clones of the contig; (ii) the adjacent clones in MTP should significantly overlap (at the chosen thresh-old); and (iii) MTP should be of minimal length, i.e., include the minimal number of clones. To satisfy these conditions, we select clones for MTP from the diametric path of the net of the significant clone overlaps (see paragraph iv). In practice other criteria come into play, such as whether or not a particular BAC has a genetic marker on it and whether or not BAC end sequence is available. A further sophistication of the criterion may also the lengths of the clones (longer clones should be preferable) and overlaps with clones disturbing the con-tig linearity (presence of markers based on BAC-end-sequencing of such clones can clarify clone-overlaps).
II. Verification and improvement of FPC contigs
LTC can be used also to verify and improve contigs obtained with other methods and tools. To test the quality of a contig and understand the underlying rea-son(s) for the assembly problem, the following proce-dure can be applied: (i) calculate all pair-wise probabilities of clone overlaps and represent the contig as a net of significant overlaps; (ii) test connections within this net; and (iii) test for topological linearity of the contig. If poor overlap (at the sequence level) of adjacent clones in the MTP occurs together with low significance of the clones’ overlap, but the contig is con-nected and has a linear structure, then it makes sense to attempt fixing the contig by reordering the clones and selecting an alternative MTP. In this case, one needs to take into account that if some part of the analysis was already done for the old MTP, then it can be cheaper to select a MTP with common parts with the old one, rather than to repeat the analysis for the optimal MTP. If the detected problems in the MTP can be explained by non-connectivity or non-linearity of the contig struc-ture, then the contigs must be split into connected parts each with linear structures. LTC first temporally excludes clones and clone overlaps not proven by paral-lel paths from the analysis (see above). After contig splitting, reordering and verification, LTC attempts mer-ging the contigs by decreasing cutoff stringency or via returning back the previously excluded clones and clone overlaps. LTC also checks (whenever possible) that the added clones are not specified as belonging to other parts of the chromosome.
Comparison of clone partitions
Different clone partitions obtained with different clus-tering schemes were compared for the number of clones
covered by reasonable size clusters and by direct com-parisons of clusters. The comparison was performed by scoring the Rand index R [60] and its modification R’ (see Additional File 1, Secttion 5). Additionally to these characteristics, the mean number M of clusters of the one clone partition overlaps with each of the other clone partition clusters was scored; if the two partitions are very similar, M should be close to 1. Two modifica-tions of the M value, M* and M**, that reduce the role played by small clusters and singletons were also scored (see Additional File 1, Section 5).
Graphical representation of the cluster topological structure
Topological structures of clusters are represented by the net of significant (relative to some specified cutoff) clone overlaps. The nets were drawn using the publicly available program Pajek [54]. Draft pictures were obtained with the Kamada-Kawai algorithm for drawing undirected graphs [61] performed in the Pajek program.
Simulation of BAC libraries based on the known genome sequences
To test the effectiveness of contig assembly algorithms we simulated clone libraries and clone fingerprints based on known genome sequences (analogously to Xu et al., 2004 [62] and Krzywinski et al., 2007 [63], instead of using artificial genome sequences employed by other authors, e.g. Cuticchia et al., 1992 [50]; Soderlund et al., 1997 [35]). By Renzyme we denote the sequentially
ordered set of N restriction sites ricorresponding to the
chosen enzyme sequence (we used HindIII). For conve-nience, we supplement this set by r0 and rN+1
corre-sponding to the start and end points of the sequence. Let L be the total length of the sequence. For each gen-erating clone the program selects a start and end points from Renzyme. Index istartis selected randomly from 0 to
N + 1. Index iendcalculated by istart + s h, where s is
equal to 1 or -1 with probabilities 0.5 (defines clone direction) and h is the integer part of a normally distrib-uted random value with mean a and variance s2 (defines clone sequence length distribution). Values a ands2are selected such that mean and standard devia-tion of clone length be about 120 kbp and 30 kbp, respectively (a = 120l, s = 30 l, where l = (N + 1)/L). Chimerical clones were generated as union of regular clones, occurring with a probability pchimer (= 0.05 in
our simulations).
Fingerprint for generated clones were defined by the set of bands of K types (corresponding to K used pro-truding-end restriction enzymes) presented in the clone; we used enzymes BamHI, EcoRI, XbaI and XhoI (K = 4) analogously to Ding et al. (1999) [21]. Presence of a band b with length Lband type kbis defined by the
pre-sence of sequence part of length Lbbp bounded by the
restriction site of enzyme kb from the one side and
above, or restriction site of blunt-end restriction enzyme (we used HaeIII) or clone end from the another side. In fact, sequence parts bounded by two different protrud-ing-end restriction enzymes are twice included into fin-gerprint. Bands with length <Lmin= 50 bp or >Lmin=
500 were filtered out. Clones with number of bands n < nmin= 50 or n > nmax = 250 were also filtered out.
In the preparation of input data for the FPC and LTC programs we introduced noise into sequence length scoring to simulate errors in wet fingerprinting process. “Observed” band length was calculated by Lb+ err,
where err is a random value uniformly distributed within interval (-ε, ε) or within (-3ε, 3ε) with probabil-ities pε = 0.90 and p3ε = 1-pε = 0.1 respectively. This
imples that difference between two observations of the same band is less than constant tolerance value t with probability τ = pε2(1-(1-t/2ε)2) + p3ε2(1-(1-t/6ε)2) +
2pεp3ε(t/3ε). We used ε = t/2 = 0.2 implying τ = 0.94. To
satisfy FPC format, band lengths were multiplied by 30 and rounded (hence tolerance t = 12). Type of band was taken into account by adding 0, 5000, 10000 or 15000 for the resulted band length for bands of type k = 1, 2, 3 and 4, respectively. Some bands of clones were excluded (with probability pmissing = 0.05) to simulate
false negatives caused by problems in PCR reactions. Automatic FPC assembly was conducted using cutoffs 10-75 - 10-45 with step × 105and DQer for contigs hav-ing more than 10% Q-clones (with step × 109) and ReBuildwith corresponding cutoff if needed (similar to Paux et al., 2008 [48]).
Materials
To illustrate the advantages of the LTC analytical frame-work we employed the results obtained in the physical mapping of wheat chromosome 3B [48]. The corre-sponding database included High Information Content Fingerprinting results of 56,952 of BAC clones obtained from the chromosome 3B specific library. The initial input data for LTC included band lengths classified according to four dyes. For each dye, up to 4500 distinct points (band sizes) were obtained. Two bands were considered of the same if their sizes were within a toler-ance = t (e.g., constant t = 4).
The elements of the LTC analytical framework were tested with fingerprinting data from two regions of chromosome 3B corresponding to clones located in the 3BL7-0.63-1.00 and 3BS1-0.33-0.55 deletion bins. Sixty-nine contigs comprising 3,606 clones that were found to belong to bin 3BL7-0.63-1.00 and 180 (8,167 clones) to bin 3BS1-0.33-0 [48] were used in the analysis. Using LTC, these 249 contigs were verified/ corrected/extended; alternative contigs were also con-structed and compared to the results obtained with FPC.
Simulated BAC libraries
Simulated BAC libraries LibRiceChr1and LibMaizeChr1were
constructed based on the known genome sequences SeqRiceChr1 and SeqMaizeChr1for chromosome 1 of rice
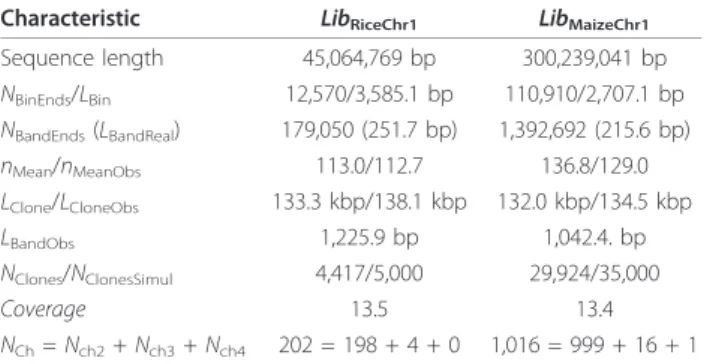
(45 Mbp, available at http://rgp.dna.affrc.go.jp/whoga/ download.html.en, file chr01.fa.gz) and chromosome 1 of maize (300 Mbp, available at http://ftp.maizese-quence.org/current/assembly, we used version that was downloaded at June 10, 2010), respectively. Basic charac-teristics of the libraries are summarized in table Table 1.
Results and Discussion
Distribution of bands and clone lengths
In total, 30 to 275 bands were scored (out of 18,000 possible) for each of the N = 56,952 clones of the 3B BAC library (for more details of this data see [48]). The frequency of a band b was calculated as πb = Nb/N,
where Nbis the number of clones containing bands with
lengths different from b not more than the tolerance value. The bands showed quite variable abundances (Additional File 2, Fig. AF2.3a). In particular, one band was observed with πb = 0.93, one with πb= 0.78, six
withπbfrom 0.2 up to 0.32, 220 withπbfrom 0.1 up to
0.2, 654 with πbfrom 0.05 up to 0.1, and others were
observed in less than 5% of the clones. The minimal band abundance was 1.2%. We found more than 30 of the five-band combinations ("band haplotypes”) present in multiple clones in a range of 1000-2271 (3.6% of
Table 1 Basic characteristics of simulated BAC-libraries Characteristic LibRiceChr1 LibMaizeChr1
Sequence length 45,064,769 bp 300,239,041 bp NBinEnds/LBin 12,570/3,585.1 bp 110,910/2,707.1 bp NBandEnds(LBandReal) 179,050 (251.7 bp) 1,392,692 (215.6 bp) nMean/nMeanObs 113.0/112.7 136.8/129.0 LClone/LCloneObs 133.3 kbp/138.1 kbp 132.0 kbp/134.5 kbp LBandObs 1,225.9 bp 1,042.4. bp NClones/NClonesSimul 4,417/5,000 29,924/35,000 Coverage 13.5 13.4 NCh= Nch2+ Nch3+ Nch4 202 = 198 + 4 + 0 1,016 = 999 + 16 + 1
Here NBinEndsis the number of restriction sites corresponding to enzyme
HindIII chosen for clone-end simulation; LBinis the mean length of bin equal
to distance between restriction sites corresponding to enzyme HindIII; NBandEndsis the number of restriction sites corresponding to the enzymes
BamHI, EcoRI, XbaI, XhoI and HaeIII used for fingerprinting; LBandRealis the
mean distance between restriction sites corresponding to these enzyme; nMeanis the mean number of bands (with length from 50 to 500 and colored
end) per clone; nMeanObsis the mean observed number of bands (bands with
different end-colors are taken twice, but among bands with the same color and length only one delegate is observed). LCloneObsand LCloneare mean
lengths of clones (with and without chimerical clones respectively); LBandObsis
the mean length of bands with length from 50 to 500 bp; LBandMapis the
mean length of bands used for band map length calculation (equal to LCloneObs/nMeanObs); NClonesSimulis the number of simulated clones; NClonesis the
number of simulated clones with observed number of bands from 50 to 250; Nch2, Nch3, and Nch4are resulted numbers of chimerical clones with number of
bands from 50 to 250 and composed by union of 2, 3 and 4 parts, respectively.
total) clones, where πb of bands was in the range of
0.120 to 0.156, pointing to highly significant “linkage disequilibria” of the bands. This can result from physical overlap of considered clones and from repeats [6,64]. The distribution of clone length (scored as number of bands) was bimodal (Additional File 2, Fig. AF2.3b). The origin of this bimodality is in the construction of the BAC library itself. Three sub-libraries were constructed including large, medium, and small fragments (see [65]). Fingerprinting results revealed that the medium length sub-library was actually a mix of large and small inserts, and not medium inserts. This resulted in two distinct populations of clone length.
LTC, a new algorithm for building contigs from fingerprinted clones
In this work we have developed a new analytical frame-work, LTC, for contig assembly of fingerprinted BAC clones that can be used as an alternative or as a comple-ment to FPC. In contrast to FPC, the LTC program starts clustering with a relatively relaxed cutoff and uses the topology of significant clone overlaps to obtain longer and more realistic contig structures. Instead of a uniform cutoff, LTC uses a procedure that adaptively increases the cutoff stringency. Using stringent cutoffs only for large clusters generates fewer short contigs or singletons. After ordering, LTC merges the contigs by relaxing the cutoff (analogously to FPC), hence, this approach can be referred to as “up-down-up”, in con-trast to the FPC approach that can be referred to as “down-up” (stringent cutoffs applied from the begin-ning). LTC differs from FPC in a number of important features that are: (a) the metrics of clone overlap, (b) consideration of the band abundances, (c) the algo-rithm used for clone clustering, (d) the use of the topo-logical structure of clusters for contig construction, (e) the application of global optimization methods for clone ordering, and (f) the assessment of the reliability of the mapping results by re-sampling. These para-meters should enable the construction of more robust and longer contigs in particular when dealing with large and repetitive genomes.
To demonstrate the efficiency of LTC in contig assem-bly, we compared contigs obtained by LTC with contigs obtained using the standard FPC package for BAC clones from the wheat chromosome 3B [48]. The results are presented for the three main analytical stages shared between the LTC and FPC packages, i.e., (i) the identifi-cation of significant clone overlaps; (ii) the subdivision of clones into clusters of significantly overlapped clones; and (iii) the ordering of clones within clusters. To assess the capacity of LTC to verify, repair, and elongate contigs obtained by FPC, we also ran LTC on the 3B dataset pre-viously obtained by FPC for the same contigs.
(i) Identification of significant clone overlaps by LTC
Both FPC and LTC identify significant clone overlaps in a similar way: for each pair of clones, c1 and c2, the
p-value Pr(c1, c2) of clone overlap is calculated and
com-pared with a predefined threshold Pr0(cutoff). Clones c1
and c2 with Pr(c1, c2) <Pr0 are declared as overlapping
clones. In contrast to FPC that uses Sulston score Pr(Sulst) [17], LTC uses new alternative metrics Pr(Siid) and Pr(Sind) (see paragraph (i) in Methods) for more accurate approximation of p-value. To compare metrics used in FPC and LTC, values Pr(Siid), Pr(Sulst), and Pr
(Snid)
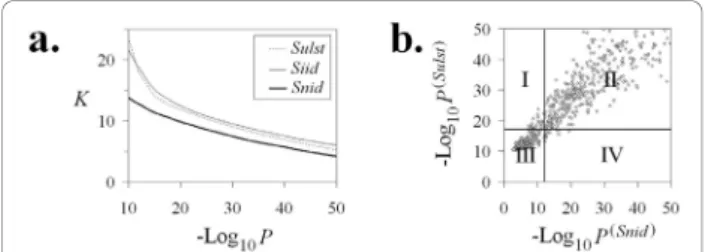
were calculated for each pair of clones from the 3B dataset (56,952 clones). The results indicate that Pr(Siid) generally overestimates the significance of clone overlap compared to Pr(Snid). For highly significant clone over-laps, Pr(Siid)also provides a substantially higher p-value than the standard Sulston score Pr(Sulst)(see Figure 3). However, logarithms of Pr(Siid), Pr(Sulst), and Pr(Snid)were not absolutely correlated, especially for strongly overlap-ping clones. For example, liberal cutoffs P0(Snid) = 10-12,
P0(Sulst)= 10-17.2, and P0(Siid)= 10-19.4 gave comparable
numbers of significant clone overlaps (~ 12.7 per clone, see Figure 3a). We found that 2.1% of clone-overlaps, which was significant with Pr(Snid), was not significant with Pr(Sulst) (i.e., were identified as false positives) and vice versa (see Figure 3b). Similarly, 2.5% and 2.7% of false positives were found for pairs based on the Pr(Siid) &Pr(Snid), and Pr(Siid)&Pr(Sulst)criteria for clone overlaps, respectively. Such inconsistencies of the criteria can be explained by non-identical band abundances and by insufficient accuracy of the Sulston score to estimate clone overlap probability (see [40]).
A more accurate estimation of p-values for clone over-laps used in LTC reduces the proportion of falsely
Figure 3 Comparison of metrics: (a) Number of significant clone overlaps K per clone for different cutoffs. Using liberal cutoffs P0(Snid)=
10-12, P0 (Sulst)
= 10-17.2, and P0 (Siid)
= 10-19.4give about the same number of significant clone overlaps (~ 12.7 per clone). (b) Pr(Sulst)vs. Pr(Snid). Dots in rectangle I correspond to clone overlaps significantly relative to Pr(Sulst)= 10-17.2but not significantly relative to Pr(Snid)= 10-12(false positives). Dots in rectangle I correspond to clone overlaps significantly relative to Pr(Sulst)= 10-17.2but not significantly relative to Pr(Snid)= 10-12 (false positives). Dots in rectangle IV correspond to clone overlaps significantly relative to Pr(Snid)= 10-12but not significant relatively to Pr(Sulst)= 10-17.2(false negatives).
significant clone overlaps and increases the proportion of real clone overlaps that have a significant number of common bands. This leads to a reduction of clustering errors. Such errors can result in two undesired out-comes: (a) a wrong contig ordering with poor overlap of some adjacent clones from MTP, referred to as a gap that will call for (non-natural) splitting the contig into shorter contigs; and (b) a wrong partition of contigs into “independent” contigs that could not be merged. Both outcomes will yield shorter contigs than one could obtain using more correct clone clustering. Hence, using more accurate metrics for clone overlaps can result in longer contigs even with FPC algorithms for contig assembly.
Analogously to FPC, choosing cutoff stringency for clone clustering should be based on a tradeoff between the advantages of stringent and liberal cutoff values. Indeed, on the one hand, clustering with a liberal cutoff results in large but unreliable clusters, where ordering and detecting problematic clones and clone overlaps is challenging. On the other hand, clustering with a strin-gent cutoff results in many small clusters from which the ordering and identification of problematical clones is presumably“easy”, while merging is difficult. Therefore, using liberal cutoffs may be a reasonable strategy if and only if powerful tools for multipoint ordering are avail-able, such as with LTC.
(ii) Clustering the 3B fingerprinting dataset: comparing different procedures
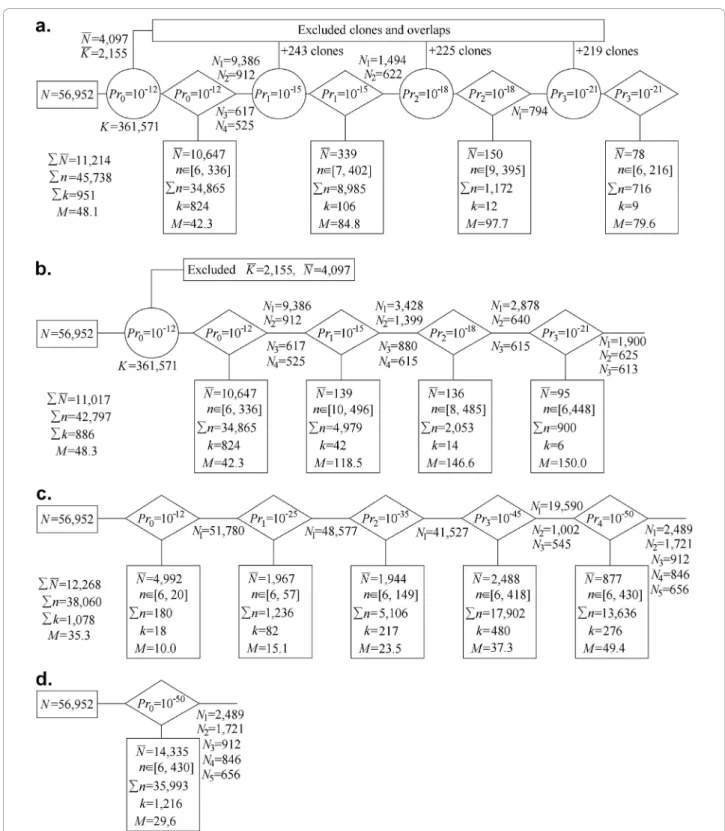
Partition of clones using the LTC adaptive clustering procedureWe applied the LTC main adaptive clustering procedure to the 56,952 fingerprints obtained for chro-mosome 3B [48]. Out of N(N-1)/2 = 1.6·109 possible clone overlaps, 361,571 (i.e., 0.02%) were significant at Pr(SnidM) <Pr0 = 10-12 (Figure 4a). From these, 2,155
clone overlaps (0.6% of the significant ones) and 4,097 clones (7.2% of total) have not been confirmed by paral-lel paths (Figure 4a). After temporal exclusion of these clones and clone overlaps, the entire database was sub-divided into 828 clusters with a minimal number of clones per cluster of 6. In total, 6,550 clones (11.5% of total) were found in clusters with smaller sizes or as sin-gletons. Among the 828 clusters, one was large (9,386 clones), three were of intermediate size (912, 617, and 525 clones) whereas the remaining ones included less than 336 clones per cluster (Figure 4a).
The TENPP procedure was used again on the entire database with cutoffs Pr1= 10-3Pr0 = 10-15 which found
additional significant clone overlaps and 243 clones not proven by short parallel paths. After temporal exclusion of these clones and clone overlaps, four large and inter-mediate clusters were subdivided into 108 clusters with at least 6 clones per cluster. In this stage, additional 339 clones were found either in smaller size clusters, or as
singletons, or were excluded by the last TENPP proce-dure. Among the remaining 108 clusters, one was large (1,494 clones), one was intermediate (622 clones), and the others contained up to 402 clones per cluster (Fig-ure 4a).
Another round of the TENPP procedure with cutoffs Pr2 = 10-3Pr1 = 10-18 identified additional significant
clone overlaps and 225 clones not proven by short par-allel paths. Large and intermediate clusters were subdi-vided into 13 clusters with a minimal number of clones per cluster of at least 6 after temporal exclusion. This resulted in 150 clones that were found in clusters with smaller sizes or as singletons, or that were excluded by the last application of TENPP procedure. Thirteen clus-ters were obtained with one intermediate containing 794 clones while the rest had up to 395 clones per cluster (Figure 4a).
A final TENPP procedure with cutoffs Pr3 = 10-3Pr2=
10-21found additional significant clone overlaps and 219 clones not proven by short parallel paths. After tem-poral exclusion, the remaining clusters were subdivided into 9 clusters with 6 to 216 clones; 78 clones were found in clusters with smaller sizes and singletons or were excluded by the last TENPP procedure (Figure 4a). Thus, in total, 56,952 fingerprints were subdivided into 951 clusters comprised of 6 to 402 clones; 11,214 clones were found in clusters with less than 6 clones, were singletons, or were excluded by the last TENPP procedures. The average number of clones per cluster was 48.3. The partition of clones obtained with this first approach will be referred hereafter as CLTC.
Skipping some components of the LTC clustering algorithmTo demonstrate the power of the LTC adap-tive clustering procedure, we skipped some of the clus-tering scheme components described above (Figure 4a). Three versions were considered: (i) using TENPP only once; (ii) clustering with adaptively changing cutoff stringency but without the TENPP procedure; and (iii) clustering with a uniformly stringent cutoff (analogous to the FPC algorithm).
(i) Figure 4b shows that if the TENPP is used only once (with cutoff Pr0 = 10-12) then in addition to
rea-sonable size clusters, clustering with cutoff Pr1 = 10-15
results also in two large (with 3,428 and 1,399 clones) and two intermediate size (with 880 and 615 clones) clusters. Repeated clustering with the more stringent cutoff Pr2 = 10-18 gives additional reasonable size
clus-ters plus one large cluster with 2,878 clones and two intermediate size clusters (with 640 and 615 clones) (Figure 4b). Further increase of the cutoff stringency up to Pr3= 10-21splits these clusters into one large cluster
with 1,900 clones and two intermediate size clusters (with 625 and 613 clones, Figure 4b). The clone parti-tion obtained with this scenario was called C1.
Figure 4 Adaptive clustering using different scenarios: (a) full scheme (see Fig. 1); (b) reduced scheme (TENPP procedure used only once); (c) clustering with adaptively changing cutoffs (for simplicity, only cutoffs 10-12, 10-25, 10-35, 10-45, and 10-50were used in the example); (d) clustering with uniform stringent cutoff 10-50(non-adaptive clustering analogous to FPC). Clustering (a) and (b) were based on P(SnidM); clustering (c) and (d) were based on P(Snid).K - number of significant clone overlaps; n - number of clones in clusters of reasonable size (from 6 to 500);
∑n -total number of clones in clusters of reasonable size; N - number of clones in clusters with less than 6 clones, singletons, or clones excluded by TENPP procedures; K - number of significant clone overlaps excluded by TENPP procedures; k - number of clusters of reasonable size; M = ∑n/k - mean number of clones in clusters of reasonable size; N = 56,952 is the total number of clones in the database; Ni-number of clones in
(ii) Without using the TENPP procedure (Figure 4c), one very large cluster is obtained even for very stringent cutoffs (e.g., 51,780 for Pr0= 10-12, 48,577 for Pr1= 10-25,
41,527 for Pr2= 10 -35
, and 19,590 for Pr3 = 10 -45
). This clone partition was called C2.
(iii) Clustering with a stringent uniform cutoff (10-50) (Figure 4d) resulted in more singletons and smaller clus-ters compared to clustering with adaptively changing cutoff (Figure 4c). The clone partition obtained with the uniform cutoff will be referred to as C3, whereas the
partition obtained with FPC (after ordering and mer-ging) will be called CFPC. In partition CFPC, 41,295 of
the 56,952 BAC clones were automatically subdivided into 1,995 contigs (with 6 and more clones) that were manually merged into 1,036 contigs with 6 to 290 clones per contig; the remaining 15,675 clones were found in clusters with less than 6 clones or were singletons [48].
Among the 951 clusters of CLTC (Figure 4a) only 47
have non-linear topological structures, and 31 of them have only one branching point. The branching 47 non-linear clusters were split into about 171 “topologically linear” clusters. Note that among the clusters obtained with the other scenarios (Figure 4c-d) the proportion of clusters with non-linear topological structure was much higher (up to 70% in C3, not shown). Thus, these results
demonstrate that the TENPP procedure enables the use of much more liberal cutoffs to obtain clusters of rea-sonable size. Repeating the procedure with more strin-gent cutoffs helps to split large clusters into reasonable size clusters. Clustering with adaptively changing cutoffs helps to protect from “dissolving” the reasonably sized clusters obtained at liberal cutoff stringency under more stringent cutoffs (see Additional File 2, Fig. AF2.4). Comparing LTC vs. FPC clustering The CLTC
cluster-ing contains more clones in the reasonable size clusters than CFPC: 80% vs. 73% of the 56,952 clones. As
described in the Methods section (paragraph iii), “rea-sonable size of clusters” were arbitrary (for certainty) defined as clusters with 6 to 500 clones; obviously, other ranges can also be successfully used. Although the num-ber of clusters in CFPCwas less than in CLTCafter the
split into clusters with linear topological structure (1,036 vs. about 1,200), CLTCclusters are proven by
par-allel clones and hence should be more reliable. More-over, many of the FPC clusters were obtained by manual merging smaller clusters, whereas 1200 clusters were obtained by LTC before any merging was underta-ken. The Rand index was high, R(CLTC, CFPC) = 0.997
because most of the clone pairs appeared in different clusters. The modification of R: R’(CLTC, CFPC) = 0.56
was more informative, reflecting that large clusters in CLTCand CFPC were rather different (one of the FPC
clusters overlapped with eight LTC clusters). Neverthe-less, the values of M1(CLTC, CFPC) = 3.7, M1*(CLTC,
CFPC) = 2.15, and M1**(CLTC, CFPC) = 1.25 for the mean
number of clusters from CLTC overlapped with CFPC
(see Comparison of clone partitions in the Methods sec-tion) indicating that most of the differences between CFPCand CLTC originate from the difference between
Q-clones excluded by FPC and those excluded by the TENPP procedure in LTC. If one excludes the clones and clone overlaps from the CFPC clusters that were
excluded by TENPP in LTC and a clustering is applied with a liberal cutoff Pr0 = 10-12, then a new clustering
CFPC(TENPP) is obtained with M1**(CLTC, CFPC(TENPP)) =
1.3 and M1**(CFPC(TENPP), CLTC) = 1.0. This
demon-strates that each of CFPC(TENPP) clusters is actually a
sub-cluster of CLTC. Thus, all of LTC contigs are longer
than the corresponding FPC sub-contigs proven by par-allel clones.
(iii) Verification of FPC contigs
The LTC adaptive clustering procedure was also used to test 249 FPC contigs (each containing 6 to 290 clones; the corresponding clone partition was mentioned in the previous section and denoted by CFPC) that were
assigned to the 3BL7-0.63-1.00 and 3BS1-0.33-0.55 dele-tion bins of wheat chromosome 3B [48]. The LTC ana-lysis indicated that 201 of the contigs (80%) had regions where the overlap between two adjacent clones was not significant with the Pr0(Siid) = 10-12 criterion and
there-fore were considered as gaps by LTC. The maximum number of gaps per contig was 44 (found in a contig of 283 clones). The gaps detected in the FPC-based contigs were of five main origins:(i) Contig consisting of two (or more) non-connected parts; (ii) Buried clones caus-ing conflicts between requests of linear ordercaus-ing and contig connectivity; (iii) Weak power of ordering tools in FPC based on local optimization;(iv) Non-synchro-nous utilization of information on shared markers and common bands;(v) Topologically non-linear structure of the contig, mostly caused by the presence of clones and clone overlaps not proven by short parallel paths. Contig consisting of two non-connected parts Only one contig located in the 3BL7-0.63-1.00 bin corre-sponded to this category. The net of significant clone overlaps for this contig consisted of two non-connected parts (even when p-value of clone overlaps was calcu-lated using standard and the very liberal cutoff Pr0(Sulst)
= 10-10). These parts can be connected by adding only one clone (see Additional File 2, Fig. AF2.5). Such a situation may result from the exclusion of one or two connecting clones (3B_043_I24 and 3B_073_B21) pre-sumably considered as Q-clones by FPC at the stage of cluster ordering.
Buried clones causing conflicts between ordering and contig connectivityThe significance of clone overlap is determined by the number of common bands and clone lengths. Hence, if clone ci is buried in clone cj and
significantly overlaps with clone ck, then it is not
neces-sary that the overlap of clones ciand ck is also
signifi-cant (see Figure 5a). Thus, after excluding buried clones, the net of significant clone overlaps can lose its connec-tivity (see Figure 5b). On the other hand, it is likely that each path along the net of significant connections, that visits all vertices, will visit the vertex corresponding to clone ci, buried in clone cj, before and after visiting the
vertex corresponding to clone cj (see Figure 5c). In
other words, vertex corresponding to clone cjis visited
twice, and therefore, such paths cannot be found directly by tools constructed for solving the classical TSP. Such a situation was found in 12 contigs and could be solved by temporal exclusion of only a subset of buried clones from the cluster before ordering. Weak power of ordering tools based on local optimi-zation Gaps that can be repaired by clone reordering within clusters were found in 198 of the 249 considered contigs (data not shown). Such reordering of clones usually changes clone positions in the contig only locally (see Additional File 2, Fig. AF2.6). Band maps based on LTC clone ordering were compared with FPC band maps. It was found that adjacent clones in LTC ordering cover on average more common bands in a correspond-ing band map than adjacent clones in the FPC band map (data not shown). This leads to better correspon-dence between number of common bands and number of common positions in the band map for significantly overlapped clones. Similar results were obtained by Flibotte et al. (2004) [46]. Increased coverage of the band map leads to higher robustness of LTC contigs to technical errors in fingerprinting. It also results in a lower number of band repeats. Hence, band maps based on LTC ordering are somewhat simpler than band maps obtained by FPC.
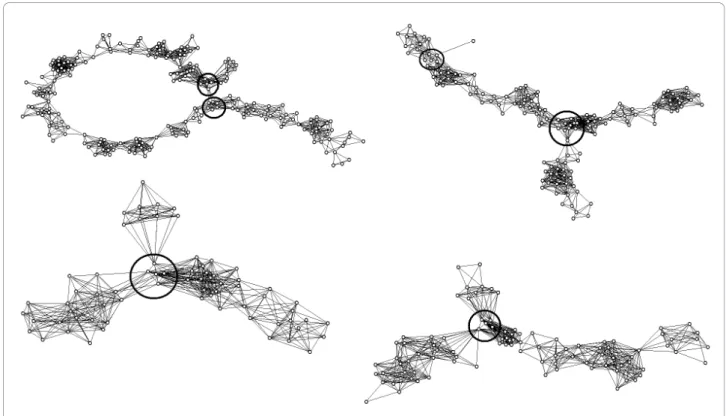
Topologically non-linear structure of the contig A non-linear contig structure was found in 26 of the con-sidered contigs (see examples in Figure 6). This was mostly due to the presence of clones and clone overlaps not proven by short parallel paths. Excluding such
clones and clone overlaps (by TENPP procedure) and clustering by the single linkage algorithm subdivided all of the 26 contigs with non-linear structure into linear parts, but also splits some other (linear) contigs into smaller parts. Hence, some of LTC contigs are shorter than corresponding FPC contigs, but are much more robust to the presence of chimerical clones and false significant clone overlaps. It should be noted that end-to-end merging of LTC contigs seems to be a less pro-blematic procedure than merging of FPC contigs because LTC does not place most problematic clones to the contig ends.
Non-synchronous utilization of information on com-mon markers and comcom-mon bands In certain cases, the anchoring of markers to physical contigs leads to situa-tions where a marker is found in two different contigs or even in two non-overlapping clones of the same con-tig. Such a situation can arise in cases when a single marker is situated on the overlap of two clones having only a non-significant number of common bands. It also can be a result of marker duplication or errors in mar-ker amplification or contig assembly. Using FPC tools, such a situation cannot be recognized (because any pair of clones usually has several falsely common bands that can be erroneously considered as real overlap) and gen-erally results in the artificial fusion of the two contigs. In contrast, LTC is able to detect such a situation because marker information is used synchronously with shared-band information in the analysis. In this case, the presence of duplicated markers and/or errors in marker amplification will usually lead to non-linearity in the topological structure of the cluster that will be detected by LTC (see Additional File 2, Fig. AF2.7).
(iv) Elongation of FPC contigs by using LTC
FPC contigs from the 3BL7-0.63-1.00 and 3BS1-0.33-0.55 deletion bins were compared with the contigs that were constructed from the entire fingerprinting dataset using LTC (without initial clustering/ordering by FPC). It appeared that short FPC contigs (with 6-30 clones) were usually parts of LTC contigs. In such situations, LTC allowed the elongation of FPC contigs in a natural way. Several examples of such elongation of FPC contigs are presented in Figure 7. Long FPC contigs (with 50 and more clones) were usually different from those obtained with LTC. We assume that the main reason for such a difference is that clones and clone overlaps excluded by the TENPP procedure do not fully coincide with Q-clones and false significant clone overlaps identi-fied by FPC. This leads to differences in clone partitions into clusters (see above) and can result in different con-tigs. In such cases, PCR amplification of BAC-end-sequences should be performed to assess the robustness of the contigs and determine which assembly is correct. For example, in the 3B dataset, some overlaps of
Figure 5 Examples of situations where buried clones cause problems in clone ordering by LTC. (a) Clone ciis buried in
clone cjand significantly overlaps with clone ck, but overlap of
clones ciand ckis not significant. (b) The net of significant clone
overlaps for the situation (a). Exclusion of buried clone cileads to a
loss of connection between the left and right parts of the net. (c) Clones cannot be ordered to fit the requirement that adjacent clones overlap significantly (because the buried clone significantly overlapped with one clone only).
adjacent clones from the MTP were not confirmed by sequencing and no satisfactory alternative MTPs could be found using FPC for these contigs (see Additional File 2, Fig. AF2.8a and b). For such situations alternative LTC contig assemblies were proven useful (e.g., to con-struct alternative elongation of the verified MTP (Addi-tional File 2, Fig. AF2.8b). Note, sometimes LTC contigs included parts of different FPC contigs that were consid-ered as belonging to different chromosomal zones based on marker assignment information (Additional File 2, Fig. AF2.9). We explain such observations by the fact that the location of the contig in the chromosomes is
determined by position markers that were found in the clones of the contig. Hence, if contig assembly was made incorrectly, then the position of clones on the chromosomes is also determined with errors. Verifica-tion of the contig using BAC-end-sequencing can clarify the contig assembly and help to determine the position of clones on the chromosome.
Comparison of LTC vs. FPC on simulated BAC libraries based on known genome sequences
Simulated BAC libraries LibRiceChr1and LibMaizeChr1were
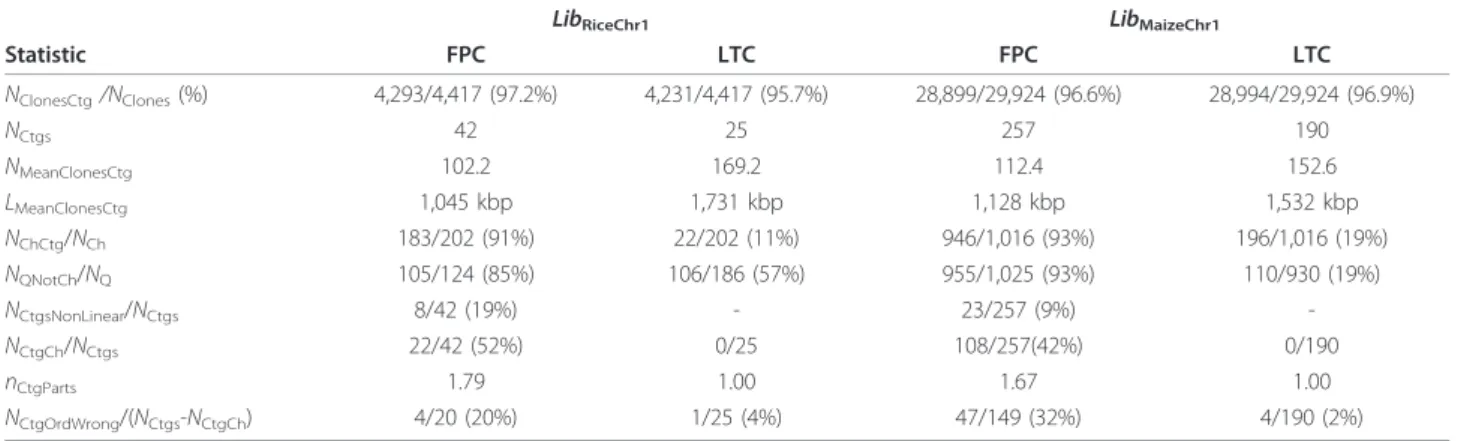
automatically assembled using FPC program and our LTC package (see sections Methods and Materials). Resulted contigs were tested using methods from LTC program and compared with real position of simulated clones in the genome sequence. Results of this analysis are briefly summarized in the Table 2.
The results presented in Table 2 indicate that LTC contigs are longer and more reliable than those obtained by FPC: (a) average contig length 1,731 (LTC) vs. 1,045 kbp (FPC) for rice, and 1,532 vs. 1,128 kbp for maize; (b) number of contigs with non-linear topological struc-ture was 0 out of 25 (LTC) vs. 8 out of 42 (FPC) observed in rice analysis, and 0 out of 190 (LTC) vs. 23 out of 257 (FPC) in maize. Low efficiency of chimerical clones identification seems to be the main source of the
Figure 6 Net representation of problematic FPC contigs with non-linear topological structure. Presented four contigs from the 3BL7-0.63-1.00 and 3BS1-0.33-0.55 deletion bins display non-linear topological structures. Vertices represent clones; edges represent significant (relative to arbitrary selected cutoff Pr0(SnidM)= 10-12) clone overlaps. Branching regions are marked by solid black circle.
Figure 7 Examples of de novo assembled contigs that proved to contain contigs constructed by FPC. Black vertices reflect clones from the corresponding FPC contigs. White vertices correspond to clones which were not specified to belong to the zones 3BS1 or 3BL7.
errors in the FPC contig assembly: only 9% (rice) or 7% (maize) of chimerical clones were not included into FPC contigs. Excluding clones and clone overlaps not proven by parallel clones (see also [52]) used in LTC algorithm enabled us to identify and exclude 89% (rice) and 81% (maize) of chimerical clones even using much more lib-eral cutoff: 10-25- 10-30 (LTC) vs. 10-45-10-75 (FPC). Diagnosis of contig linearity implemented in LTC can also assist in detecting problematic contigs assembled using FPC: 8 out of 22 chimerical rice FPC contigs and 23 out of 108 chimerical maize contigs were detected as having non-linear structure. LTC was also able to iden-tify problems in clone positioning within FPC contigs leading to non-significant overlaps of adjacent clones. Reordering of clones within contigs without chimerical clones was usually able to fix these problems.
Using these simulated BAC-libraries we found that LTC can encounter some difficulties with ordering con-tigs that contain long repeats causing false significant overlap of clones that belong local neighborhoods. Like-wise, we found one pair regions separated by ~27 Mbp in the sequence of maize chromosome 1 (positioned at 52 Mbp and 79.5 Mbp from the sequence start) with several significant (up to 10-32) overlaps between corre-sponding clones. In fact, these overlaps caused non-linear cluster topology (after TENPP procedure), but overlaps of clones within each of these two regions were by far more significant (10-70-10-140) and increasing the cutoff stringency resulted in split of this cluster into two with linear topological structure. LTC can also encoun-ter difficulties in situations where chimerical clone con-sists of two parts that in fact belong to non-overlapping regions of a small neighborhood in the sequence. In addition, we found that most of chimerical clones that
have not been detected by LTC actually consisted of one long part (100-150 kbp) belonging to the region of the contig and shorter part(s) (30-60 kbp) outside the region. We think that these chimerical clones can be identified by constructing more accurate maximal likeli-hood band map for LTC contig [37,38].
General discussion
Although many physical maps constructed with the standard FPC algorithm have been successfully employed for genome sequencing, a substantial amount of errors were found in contig assembling [47] and sub-sequently corrected using complementary methods. Var-ious factors, such as the genome composition (e.g., abundance of repeats), employed wet strategies and technologies of DNA cloning and clone fingerprinting, insufficient genome coverage of the BAC libraries, and a low accuracy of band scoring can affect the efficiency and accuracy of BAC assembly, hence the quality of the physical map. The power and flexibility of bioinfor-matics tools and human factors may also play a role: (i) from the beginning, reading the band sizes is some-what subjective because it is very sensitive to selection of the threshold parameters for automatic peak detection; (ii) clustering (contig assembly) can be highly affected by false significant clone overlaps and chimerical clones; (iii) cluster ordering depends on the selection of an initial clone and the presence of equal-sizes but not common bands in different clones; (iv) decision-making in contig merging is difficult to formalize and the result depends on the choices made among a high number of possibili-ties; (v) anchoring (linking genetic and physical maps) is also mostly made by hand and verification of mapping results (at each stage) is needed.
Table 2 Contig assembly with FPC and LTC programs
LibRiceChr1 LibMaizeChr1
Statistic FPC LTC FPC LTC NClonesCtg/NClones(%) 4,293/4,417 (97.2%) 4,231/4,417 (95.7%) 28,899/29,924 (96.6%) 28,994/29,924 (96.9%) NCtgs 42 25 257 190 NMeanClonesCtg 102.2 169.2 112.4 152.6 LMeanClonesCtg 1,045 kbp 1,731 kbp 1,128 kbp 1,532 kbp NChCtg/NCh 183/202 (91%) 22/202 (11%) 946/1,016 (93%) 196/1,016 (19%) NQNotCh/NQ 105/124 (85%) 106/186 (57%) 955/1,025 (93%) 110/930 (19%) NCtgsNonLinear/NCtgs 8/42 (19%) - 23/257 (9%) -NCtgCh/NCtgs 22/42 (52%) 0/25 108/257(42%) 0/190 nCtgParts 1.79 1.00 1.67 1.00 NCtgOrdWrong/(NCtgs-NCtgCh) 4/20 (20%) 1/25 (4%) 47/149 (32%) 4/190 (2%)
Here NClonesCtgis the total number of clones in contigs with 6 clones and more (others were excluded from the analysis); NCtgsis the number of contigs with 6
clones and more; NMeanClonesCtgis the mean number of clones in the contigs with 6 clones and more; LMeanClonesCtg= LCloneObsNMeanClonesCtg/Covarege is estimated
mean length of the contigs with 6 clones and more; NChCtgis the number of chimerical clones in the contigs with 6 clones and more (false negatives in the
procedure of Q-clone detection); NQNotChis the number of non-chimerical clones that were identified as Q-clones (false positives); NQis the number of clones
that were not included into contigs; NCtgsNonLinearis the number of contigs with non-linear topological structure; NCtgChis the number of contigs containing
clones (except chimerical ones) from non-overlapping parts; nCtgPartsis the mean number of non-overlapping parts per contig; NCtgOrdWrongis the number of