HAL Id: hal-01480698
https://hal-amu.archives-ouvertes.fr/hal-01480698
Submitted on 13 Mar 2017
HAL is a multi-disciplinary open access archive for the deposit and dissemination of sci-entific research documents, whether they are pub-lished or not. The documents may come from teaching and research institutions in France or abroad, or from public or private research centers.
L’archive ouverte pluridisciplinaire HAL, est destinée au dépôt et à la diffusion de documents scientifiques de niveau recherche, publiés ou non, émanant des établissements d’enseignement et de recherche français ou étrangers, des laboratoires publics ou privés.
Looking for symmetry: fixational eye movements are
biased by image mirror symmetry
Andrew Meso, Anna Montagnini, Jason Bell, Guillaume Masson
To cite this version:
Andrew Meso, Anna Montagnini, Jason Bell, Guillaume Masson. Looking for symmetry: fixational eye movements are biased by image mirror symmetry. Journal of Neurophysiology, American Physiological Society, 2016, 116 (3), pp.1250-1260. �10.1152/jn.01152.2015�. �hal-01480698�
Looking for symmetry: fixational eye movements are biased by image
mirror symmetry
Andrew Isaac Meso,1,2,3 Anna Montagnini,1 Jason Bell,2 and Guillaume S. Masson1
1Institut de Neurosciences de la Timone, UMR 7289 CNRS and Aix-Marseille Université, Marseille, France;2School of Psychology, University of Western Australia, Crawley, Western Australia, Australia; and3Psychology and Interdisciplinary Neuroscience Research Group, Faculty of Science and Technology, Bournemouth University, Fern Barrow, Poole, United Kingdom
Submitted 28 December 2015; accepted in final form 13 June 2016
Meso AI, Montagnini A, Bell J, Masson GS. Looking for
sym-metry: fixational eye movements are biased by image mirror symme-try. J Neurophysiol 116: 1250 –1260, 2016. First published June 15, 2016; doi:10.1152/jn.01152.2015.—Humans are highly sensitive to symmetry. During scene exploration, the area of the retina with dense light receptor coverage acquires most information from relevant locations determined by gaze fixation. We characterized patterns of fixational eye movements made by observers staring at synthetic scenes either freely (i.e., free exploration) or during a symmetry orientation discrimination task (i.e., active exploration). Stimuli could be mirror-symmetric or not. Both free and active exploration gener-ated more saccades parallel to the axis of symmetry than along other orientations. Most saccades were small (⬍2°), leaving the fovea within a 4° radius of fixation. Analysis of saccade dynamics showed that the observed parallel orientation selectivity emerged within 500 ms of stimulus onset and persisted throughout the trials under both viewing conditions. Symmetry strongly distorted existing anisotropies in gaze direction in a seemingly automatic process. We argue that this bias serves a functional role in which adjusted scene sampling en-hances and maintains sustained sensitivity to local spatial correlations arising from symmetry.
mirror symmetry; eye movements; gaze; visual sampling; saccades
NEW & NOTEWORTHY
This work presents the novel finding that small fixational eye movements made by humans viewing synthetic scenes have their directions strongly distorted in the presence of symmetry. The distortion results in a bias parallel to axes of symmetry measured across various task conditions and found to be persistent for up to 3 s. We argue that this automated process serves a functional role for active vision.
SYMMETRY IS THE PRESENCEof spatial redundancies that can be
mathematically characterized. Bilateral or mirror symmetry is a ubiquitous, well-recognized feature of the living world, but there are other forms including invariance during rotation or translation (e.g., a regularly repeated pattern). Perhaps owing to its ecological relevance, perceptual sensitivity to mirror symmetry has been observed in many different species, for instance, insects and birds (Delius and Nowak 1982; Giurfa et al. 1996) as well as humans (for review see Bertamini and Makin 2014; Treder 2010; Wagemans 1995). Indeed, image
symmetry has profound influences on human perception, from low-level visual processes combining separate scene elements into coherent objects (Machilsen et al. 2009) to high-level scene interpretation (Driver et al. 1992). These effects pertain to active vision, since large, voluntary saccades during scene exploration are preferentially targeted at image parts contain-ing symmetric shapes (Kootstra et al. 2011; Locher and Nodine 1973).
Despite the numerous reports of symmetry-driven effects on perception and eye movements, there remain enormous gaps in the understanding of how we can rapidly extract and use symmetry information. Focusing on mirror symmetry, here referred to simply as symmetry, we aimed at shedding light on some of these by characterizing the effects of the axis of symmetry on patterns of fixational eye movements. These eye movements occur when exploration is maintained within a limited region of interest of the visual field and are a combi-nation of small saccades, ocular drifts, and tremor (Kowler 2011; Rolfs 2009). The small saccades, often called microsac-cades, were considered as a purely stochastic behavior for decades but have recently been the subject of a growing research interest. It is widely agreed that microsaccades have a role in countering the gradual fading of perception that occurs when images remain static on the retina over several seconds (Martinez-Conde et al. 2006; Yarbus 1967). Today, there remains some contention about what additional role beyond countering gradual fading fixational eye movements may play in vision. A range of roles and causes for each of the types of small eye movements have been suggested. These include, for instance, simply bringing objects of interest into the foveola, a stochastic motor component, an overt attention orienting, and more recently a critical role in scene sampling (for reviews see Engbert 2006; Martinez-Conde et al. 2013; Rucci et al. 2016; Rucci and Victor 2015).
Fixational eye movements determine what information is parsed from complex scenes, and as a result it is now increas-ingly evident that this links them to several key perceptual and attentional processes (Engbert 2006; Hafed and Clark 2002; Laubrock et al. 2010; Otero-Millan et al. 2008; Poletti et al. 2013). We thus reasoned that investigating whether and how symmetry influences fixational eye movements could reveal a previously unknown heuristic applied by underlying low-level and attention mechanisms to facilitate human sensitivity to spatial structure during active vision.
We used simplified stimuli composed of randomly posi-tioned dots that are known to elicit a strong perceived
sym-Address for reprint requests and other correspondence: A. I. Meso, CNRS and Aix-Marseille Université, 27 Bd Jean Moulin, 13385 Marseille Cedex 05, France (e-mail: ameso@bournemouth.ac.uk).
First published June 15, 2016; doi:10.1152/jn.01152.2015.
by 10.220.33.3 on September 26, 2016
http://jn.physiology.org/
metric structure (Barlow and Reeves 1979; Wagemans et al. 1991). It is important to note that such a vivid perceived structure in dot stimuli does not arise from explicit shape cues but instead emerges from a particular widely acknowledged property of symmetry, which is that it drives perceptual group-ing processes (Apthorp and Bell 2015; Treder 2010; Wage-mans 1995). Eye movements were recorded while participants either freely explored the stimulus or actively tried to discrim-inate the axis of symmetry. The goal was to test alternative hypotheses about how symmetric scenes would be sampled in space over time. We found that most saccades were small, so that the fovea remained within the central region of the stim-ulus for all conditions. Interestingly, we demonstrate for the first time with symmetric stimuli that exploratory saccades show a consistent directional bias along the orientation of the axis of symmetry, not perpendicular to it, independent of whether there was a task. These results suggest a role for fixational eye movements in efficiently sampling symmetric scenes.
MATERIALS AND METHODS
Observers. Seven human volunteer observers (4 men, 3 women)
with normal or corrected to normal vision were recruited from the laboratory for this study, including two authors and five participants naive to the purpose of the study. The experiments were carried out after the approval of the Ethics Committee of the Aix-Marseille Université in accordance with the principles of the Declaration of Helsinki. All participants gave their informed written consent.
Stimuli. Stimuli were made up of a total of 512 randomly placed
dots (256 black and 256 white) within a diameter d⫽ 23.4° of visual angle on a gray background area of luminance 25.8 cd/m2. Each
square dot had a size of 0.117°, and the minimum distance between dots enforced during random placement was m⫽ 0.234°. The posi-tioning of each dot in polar coordinates Pi(ri,i) was implemented
with a standard MATLAB function (rand) to generate a pair of random numbers from a uniform distribution between 0 and 1. The resulting components of the polar vector werei⫽ 180 ⫻ rand() in
degrees of orientation angle and ri⫽ d公rand()/2 in degrees of visual
angle, where the square root of rand() ensured that density was preserved across the stimulus diameter by correcting for the square in the radius-area relationship. If there was already a dot within the minimal proximity of m, a given placement position Piwas excluded
and regenerated until it was valid. Asymmetric stimuli were generated by applying the dot positioning to the entire stimulus area. Symmetric stimuli, however, were constrained to placement within one half of the circular area, and a mirror reflection of the same set of positions was applied onto the blank half (see Fig. 1, A–C). Stimuli were generated on a Mac computer running OS 10.6.8 and displayed on a ViewSonic p227f CRT monitor with a 20-in. visible screen of resolution 1,024⫻ 768 at 100 Hz. Task routines were written with MATLAB 7.10.0. Video routines from Psychtoolbox 3.0.9 were used to control stimulus display (Brainard 1997; Pelli 1997). Eye movements were recorded with an SR Eyelink 1000 video eye tracker.
Procedure. Participants sat 57 cm in front of a screen with head
movements restricted by a chin and head rest. Before each trial, a gray screen was presented for 250 ms, followed by a 0.234° centrally located black fixation spot that was on for 750 ms. As the fixation spot disappeared, an instance of the random dot stimulus was displayed for 3 s, followed by 1.5 s of the gray screen before the sequence restarted (Fig. 1D). First, for the free exploration presentation observers were instructed to view each stimulus keeping their gaze within the large stimulus diameter. Each block contained 160 trials (80 symmetric⫹ 80 asymmetric). Symmetric stimuli had either a vertical (40) or a horizontal (40) axis of symmetry, and conditions were randomized
during presentation. Each block lasted⬃18 min. After a few trials to allow participants to familiarize themselves with the task, four blocks were collected, giving 160 trials per symmetry condition and 320 trials for the control asymmetric condition per participant. Once the data for the free exploration had been completed, a second experiment was carried out. For the active exploration presentation, all stimuli were symmetric and the axis of symmetry (1 of 4 cardinal or oblique axes) had to be discriminated and reported (Fig. 1, B–D). Stimulus duration, presentation, and number of blocks were the same as for the free exploration task. Participants were instructed to report the axis’ orientation by pressing one of four adjacent buttons corresponding to horizontal (H), left oblique (LO), vertical (V), and right oblique (RO). Responses were only recorded during the 3-s stimulus presentation time, a longer duration than average response times for the discrim-ination. Within each block there were 40 randomized presentations of each of the four axes.
Eye movement analysis. Recorded eye movements were cleaned
and categorized with standard criteria implemented in bespoke MATLAB routines and used, for instance, to remove blinks and other incidents of lost pupil signal. To detect microsaccades, we applied an adaptive velocity-threshold method proposed by Engbert and Kliegl (2003). This method is fully described within that article, and here we highlight its key features. A dynamic estimate of speed is calculated from derivatives of a local five-sample range of raw positions (x and
y separately). Instantaneous speed estimates are compared against a
speed thresholdx,ywith separate x and y components. Speeds above the threshold indicate saccade onsets. In the threshold,x,yis
calcu-lated from a standard deviation based on the local speed median, and
Fig. 1. Visual stimulus and task. A: control stimulus, made up of black and white dots randomly placed on a gray background within a circular region of diameter 23.4° of visual angle. Dot positioning results in no overall structure.
B: mirror-symmetric stimulus, symmetric about the horizontal axis. Light
dashed outer circular and straight lines (not shown during experiments) illustrate the stimulus circumference and midline. The smaller circle indicates an 8° diameter within which most gaze samples remained (92–99%). C: left oblique axis of symmetry. Symmetry along this axis is less vivid than on the cardinal axes. D: task illustration: 0.75-s initial fixation followed by a 3-s stimulus presentation with eye movements recorded, followed by a 1.5-s blank before the sequence restarts. In the active task, during the 3-s presentation the response is recorded through 1 of 4 button presses corresponding to the axes.
by 10.220.33.3 on September 26, 2016
http://jn.physiology.org/
not the mean. In the present work we made slight modifications: a value of ⫽ 5 was used for higher sensitivity instead of the value of 6 used in the original article. We also enforced longer exclusion durations between distinct saccades to avoid artifacts (30 ms). Eye position samples composed of saccades, drifts, and possible tremors were combined for the six participants (i.e., 1 participant did not complete the active task) to generate group gaze position density maps. These were analyzed by applying the first of two model distribution functions used in the present work, a two-dimensional (2D) elliptical Gaussian, to characterize spatial distributions of gaze (see APPENDIX, Elliptical Gaussian Fitting). These 2D eye position
distributions were generated by assigning valid samples for each of the conditions into a 300⫻ 300 bin square with sides of 24° of visual angle (0.08° bins). For visualization, these heat maps were resampled into 50⫻ 50 bins of 0.48° sides displayed over the stimulus area using an 8-bit pixel color scale. In each heat map, the pixel of maximum density is identified and its density calculated as a percentage of the total number of samples. This pixel maximum is given in the key of the figures (see Fig. 2). The fitting procedure generates parameters corresponding to ellipses enclosing⬃68% of data points for display. From all detected saccades, we obtained start and end points, amplitudes, and directions. Visual inspection of eye movement traces revealed occasional artifacts (⬍0.5% of saccades) that were then either excluded or corrected for start and end positions. A four-peak Lorentzian function was fitted to one-dimensional saccade direction distributions separately for each participant and for each condition (seeAPPENDIX, Four-Peak Lorentzian Function Fitting). These
distri-butions were obtained for all saccades under a given condition by extracting each direction and binning it into 1 of 50 bins spanning the 360° space, resulting in a width of 7.2°. The fitting procedure was used to obtain estimates of the underlying continuous density func-tions across direcfunc-tions. A statistical comparison can be carried out between the fitted density traces. The mean and variance of the participant-specific best-fitting traces allow a two-sample t-test to be carried out across the bins spanning the full direction space at a significance level of P⬍ 0.05. For the free exploration condition we compared fits of direction densities obtained under the control asym-metric condition to those under each cardinal axis—symasym-metric con-ditions H and V. For the active exploration condition, a comparison was carried out between pairs of orthogonal direction traces, e.g., H-V and LO-RO. From these t-tests, the specific points of significant differences between the traces along the 50 direction bins, particularly around cardinal and oblique axes (see Fig. 3D and Fig. 5D), indicate whether peaks are 1) perpendicular, 2) parallel, or 3) independent of symmetry axes.
A direction-selectivity index (DSI) was calculated as the ratio of the number of saccades N⌬Swithin a 40° wedge around a given axis of symmetry in both directions (20° counterclockwise and 20° clock-wise) to the total number of saccades. The control condition takes an equivalent wedge from a stimulus presentation in the absence of an axis of symmetry. DSI (N⌬S/Ntot) for each 250-ms interval gives a value between 0 and 1, to be compared to the expected value of 0.111 when there is no bias (i.e., 40°/360°) for saccade direction. DSI gives a dynamic indication of the relative extent to which saccades occur along a given orientation by contrasting symmetric and control conditions.
RESULTS
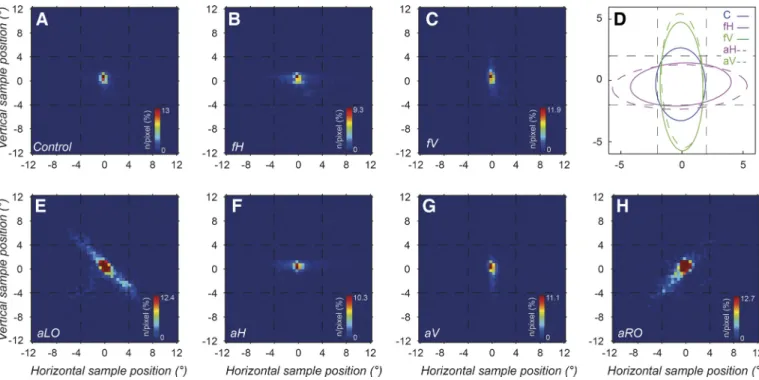
Gaze position. We characterized gaze during the tasks by
analyzing the 2D shapes of eye position distributions. Valid eye position samples for all participants were used to generate heat maps (seeMATERIALS AND METHODS). For the control
asym-metric stimulus condition, eye positions were largely isotropic (see distribution of orange-red areas in Fig. 2A), extending a little along both cardinal axes. When an axis of symmetry was
present in the free exploration condition, sampling was ex-tended along this axis either horizontally (Fig. 2B) or vertically (Fig. 2C). Differences between the control and symmetry conditions were quantified by fitting an elliptical Gaussian function to heat maps (see MATERIALS AND METHODS). Ellipses
are shown for the each of the three free exploration conditions (continuous line plots) characterized by their x and y center positions, semimajor and minor axis lengths, and ellipse ori-entation angle theta (Fig. 2D). The fits were significant when tested with the nonparametric Kolmogorov-Smirnov test (at a level of P⬎ 0.05; seeAPPENDIX, Elliptical Gaussian Fitting and
Nonlinear Fitting Validation). The control condition was best
fitted by an almost circular ellipse (dark blue solid line in Fig. 2D), a little broader along the V than the H direction. In the presence of a symmetric pattern, ellipses were clearly elon-gated along this axis (solid green and purple curves, Fig. 2D). Therefore most samples lie close to central fixation, even taking into account elongation along cardinal axes. The area enclosed by these ellipses encompassing 68% of the collected samples is ⬃20–30°2 of visual angle across conditions (see
APPENDIX, Elliptical Gaussian Fitting). This covers only the
central 7% of the stimulus area of 452°2in total. Figure 2, E–H, illustrate corresponding results for the active exploration con-ditions, with four different orientations of the symmetry axes. The gaze patterns were very similar, with the comparable elliptical fits for the cardinal axes shown by dashed lines in Fig. 2D. The scene sampling is seen to similarly occur along the axes of symmetry but shows a nonsignificant trend extending marginally further along this axis for active compared with free exploration, based on the fitted width parameters in the direc-tion parallel to the axis (see Fig. 2D, solid vs. dashed traces, and Table A1,APPENDIX).
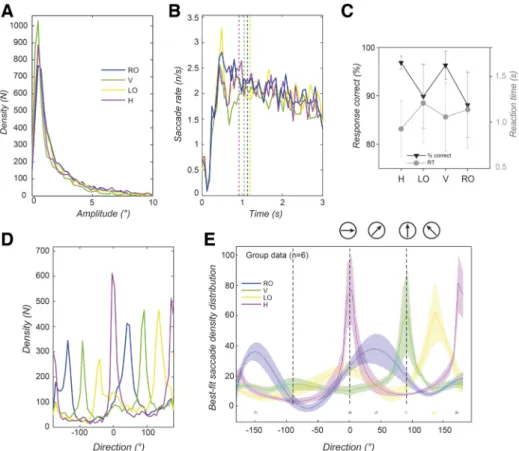
Saccade characteristics for free exploration: amplitudes, rates, and directions. Considering saccades as fast movements
that place the fovea within regions of interest, we identified them with standard criteria (Engbert and Kliegl 2003) and computed histograms of various saccade properties. Distribu-tions of saccade amplitudes (sizes) are first computed, assign-ing values for each recorded saccade into 1 of 50 bins spannassign-ing 0 –12° of visual angle (i.e., bin size: 0.24°). These distributions shown in Fig. 3A are not measurably modulated by the pres-ence of symmetry (compare blue trace to other traces). Across conditions a similar number of saccades were measured with an average and standard deviation of 5,384 ⫾ 197 per condi-tion. Most were small [small ⬍ 2°: 3,805 ⫾ 117 (71%) and micro ⬍ 1°: 2,688 ⫾ 133 (50%)]. Saccade rates were then computed by assigning each saccade to 1 of 50 time bins of 16.67-ms width based on onset time over the course of the 3-s trial. Rates were found to largely overlap for the control, H, and V symmetry conditions, shown in Fig. 3B (control blue trace overlaps with other traces). The traces show a peak of ⬃2.5–3 saccades/s at 500 ms from stimulus onset and then a gentle decline down to 1.5–2 saccades/s.
Saccades generated by the oculomotor system during the different conditions were therefore unchanged in numbers, rates, and sizes, but only in the directions as suggested by Fig. 2. The distributions of saccade direction in Fig. 3C show prominent peaks in the direction parallel to the axis of sym-metry where it was present (purple and green traces) and smaller peaks around both these axes in the control (dark blue trace). For data obtained from each participant, we fitted the
by 10.220.33.3 on September 26, 2016
http://jn.physiology.org/
corresponding histograms with a four-peak Lorentzian function (see MATERIALS AND METHODS) and found that the function
modeled the empirical distributions when a Kolmogorov-Smir-nov test was applied (APPENDIX, Nonlinear Fitting Validation).
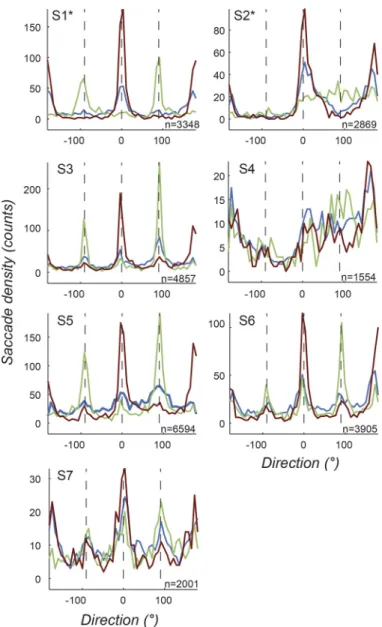
Means and standard errors of the fitted distribution functions for the seven participants are shown in Fig. 3D. We apply a two-sample t-test comparing points along each of the pair of cardinal traces (purple and green) to the control condition (blue trace). At critical points of comparison corresponding to the cardinal axes (0°, 90°, 180°, and 270°), we find a significant difference between the control and the cardinal direction con-ditions. For example, at 0° for the H-Control comparison and 90° for the V-Control comparison the directions are both significantly different from the control [t(12) ⫽ 2.23, P ⫽ 0.046 for H and t(12) ⫽ 3.21, P ⫽ 0.0075 for V]. The individual participant data behind this group fitting are shown in Fig. 4. The total number of saccades identified per partici-pant is also shown in each plot. It can be seen that the peaks lie in the cardinal direction (green and purple lines), which is consistent with the result of the averages of Fig. 3, C and D, irrespective of whether participants were naive or not (2 authors are indicated by * after participant ID). The exceptions occur where a low number of saccades (⬍2,500) were recorded during the task, in which case peaks are less prominent. This supports the conclusion that saccades preferentially occur along orientations parallel to symmetry axes (i.e., significantly more saccades in the direction parallel to the axis of symmetry).
Active scene sampling: saccades. We similarly consider the
sampling of the scene by characterizing the eye movements recorded during the active task. Participants discriminated the axis of symmetry by pressing one of four buttons correspond-ing to H, LO, V, and RO axes of orientation (see Fig. 1). Saccade amplitudes have a distribution similar to those mea-sured under the free exploration conditions when compared across the four symmetry axis conditions in the discrimination task (Fig. 5A). The number and proportion of microsaccades (⬍1°) were comparable for the active exploration task (i.e., 2,647⫾ 171 compared with 2,687 ⫾ 133 for the free explo-ration, both 50% of the total saccades). Most saccades (70 ⫾ 4%) were smaller than 2°.
Saccade rates were calculated as done for the free explora-tion task. Results show largely overlapping curves, with an initial suppression before 250 ms rising to a peak at 500 ms of 2–2.5 saccades/s before a gentle decline from around 1,000 ms, in Fig. 5B. This saccade rate trend is similar to that seen for the free exploration, with the exception that the maximum rate is higher by⬃0.5 saccade/s for the active task (compare Fig. 3B and Fig. 5B). We note that the mean reaction time across participants and conditions is 1.18 s, and mean reaction times for the four different axis conditions are indicated by the dotted vertical lines within Fig. 5B and plotted in Fig. 5C. The most prominent difference in the peak rate between the tasks occurs within a critical decision making epoch for the active task based on reaction time.
Fig. 2. Gaze positions from eye movement data collected during the symmetry tasks, combined for all participants. Heat maps are obtained from distributions
of all valid eye movement responses excluding blinks, collected within a 24°⫻ 24° space covering the stimulus. For visualization, this space is split into 50 ⫻
50 bins over which the 2-dimensional histograms are computed. The display shows the normalized density values on an 8-bit intensity color scale from blue to red (inset), normalized to % of samples at the strongest red pixels with the maximum density. Heat maps collected under the free exploration condition presentation appear in A–C and those under the active exploration condition in E–H. A: in the control distribution, gaze is centered around fixation. B: the horizontal axis condition shows gaze also centered around fixation and extending along the H-axis. C: the vertical axis condition shows gaze extended along the V-axis. D: 5 ellipses drawn within a zoomed-in 12° stimulus area, corresponding to elliptical fits of the gaze distributions. They correspond to the 3 free exploration cases, control (C), horizontal (fH), and vertical (fV) symmetry axes, and 2 active exploration cases for comparison, horizontal (aH) and vertical (aV) symmetry axes. Gaze is seen to be elongated along the axis of symmetry where present, more so for the active cases. E–H: the 4 active stimulus cases. E: for the left oblique symmetry axis, gaze extends along this axis. F: the active horizontal axis gaze distribution is similar to the free exploration in B. G: the vertical active condition is also similar to that for the free exploration task in C. H: the right oblique axis condition shows gaze extending along the corresponding axis.
by 10.220.33.3 on September 26, 2016
http://jn.physiology.org/
The direction distributions across these four conditions were analyzed in the same way as those for the free exploration condition. Peaks were seen to occur in the directions parallel to the axis of symmetry (Fig. 5D). Using the fitting procedure applying the summation of four-peak Lorentzian functions separately for each participant, there was a significant fit for all conditions based on a Kolmogorov-Smirnov test (seeAPPENDIX,
Four-Peak Lorentzian Function Fitting and Nonlinear Fitting Validation). When the resulting traces of orthogonal axis
conditions are compared in a two-sample t-test at the angles corresponding to cardinal and oblique axes [i.e., LO-RO at 45°,
t(10) ⫽ 3.28, P ⫽ 0.008 and H-V at 90°, t(10) ⫽ 2.26, P ⫽
0.047] the best-fitting peaks significantly occur around the respective axes of symmetry shown in Fig. 5E, where the standard errors are shown by the light shaded areas. These group results are consistent with the effect seen in the different colored traces (compare blue to orange and green to purple) for all participants in Fig. 6. The average number of saccades for each of the oriented axis conditions combining all participant data is very similar to those recorded for the free exploration
task (i.e., 5,375⫾ 301 for active compared with 5,385 ⫾ 197 for passive task).
The proportion of correct responses and reaction times give an indication of the relative difficulty of the discrimination conditions. The group data indicate that the tasks were easy and participant responses were⬎90% correct (see Fig. 5C for reaction time and response performance results). Ranking dis-crimination performance across symmetry axis orientation con-ditions according to average percentage correct gives H, V, LO, and then RO, a rank order that is the same as the relative strength of the different peaks in saccade directions (see colors in Fig. 5, D and E).
Dynamics of direction selectivity. To investigate the
tempo-ral dynamics of the observed modulation of saccade direction by symmetry, we computed a DSI for each 250-ms temporal
Fig. 4. Saccade direction distributions for 7 individual participants under the free exploration task. Three conditions are plotted, horizontal (magenta traces) and vertical (green) symmetry and the control asymmetric (blue). Each plot corresponds to 1 participant (S1*–S7). Note that S1* and S2* are authors and therefore not naive to the hypothesis. The total number of saccades is also indicated for each subject. Overall, the individual data are consistent with group fits in Fig. 3, showing peaks along symmetry axes when present. Trends are generally clearer when participants make a larger number of saccades. Fig. 3. Saccade properties for all participants during the free exploration task.
A: saccade amplitude density, plotted after separation into 50 linearly spaced
bins between 0 and 12° of visual angle. Three conditions are shown, H, V, and Control (C), for all plots. For all conditions, at least 85% of saccades are smaller than 4°, with half smaller than 1°. These proportions are similar for the 3 conditions. B: saccade rates over the course of a trial, in fifty 16.67-ms intervals. Traces overlap for the 3 conditions and fall gradually after an initial suppression around 250 ms and a peak around 500 ms. C: saccade direction density for the group of participants. Samples are separated into 50 direction bins. There are strong biases in the density distribution for the symmetric stimuli (H, purple; V, green). Smaller biases along the cardinal axes can also be seen in the control condition (blue). D: group saccade density traces showing mean and SEs of the individual continuous function fits based on data from the 7 participants. The resulting traces separate at the symmetry axes for the horizontal and vertical cases compared with the control condition. The significance testing indicated by asterisks at these axes takes the form of a 2-sample t-test at each direction bin between the control and respective symmetric condition. Axes of symmetry are indicated at the top by arrows in circles.
by 10.220.33.3 on September 26, 2016
http://jn.physiology.org/
bin from the onset of the visual pattern until the end of the trial. The DSI was defined as the ratio of saccades made within a 40° direction wedge around the axis of symmetry to the total number of saccades (seeMATERIALS AND METHODS). As a control
condition, for each main axis (H, V, RO, and LO), we evalu-ated the DSI by taking into account the saccades executed in the free exploration task during the observation of the asym-metric controls. Figure 7 shows the time course of the DSI along the horizontal and vertical axes (Fig. 7, A and B) for the active and free exploration tasks compared with the control condition. In Fig. 7, C and D, the DSI estimated in the active task is compared to the control condition for the oblique axes. The vertical dashed lines in Fig. 7 indicate the mean reaction time for the ongoing perceptual discrimination task, and the gray shading shows ⫾1 standard deviation of the recorded values.
For all symmetry axes, direction selectivity increases rapidly (within the first 500 ms) in the symmetric test conditions and then remains rather constant until the end of the trial, with the exception of the horizontal axis condition, where selectivity rises continuously. The control DSI remains nearly constant at a lower level (close to the value expected for a uniform random distribution of saccades, ⬃0.111) for the V, RO, and LO
conditions. For the horizontal selectivity, the rise of the control DSI in time reflects a bias in favor of the horizontal direction. The red and blue asterisks in Fig. 7 indicate the time bins in which the DSI estimated during the active (red asterisks) and passive (blue asterisks) tasks becomes significantly higher than the control according to the nonparametric Kruskal-Wallis test for mean differences performed at a significance threshold of
P⫽ 0.05 across the range of values within the trace. Note that
the DSIs remained largely stable after the subjects had reported their perceptual decisions, showing that the bias persisted over the trial duration.
DISCUSSION
Symmetry is a ubiquitous feature of objects within our visual environments to which humans and other animals are highly sensitive (Treder 2010; Wagemans 1995). Humans are very fast and efficient at detecting mirror-symmetric stimuli (Car-mody et al. 1977; Wagemans et al. 1991). The perceptual interpretation of complex scenes is also fundamentally affected by symmetry. Ambiguous structure-from-motion stimuli, for example, tend to be perceived as transparent instead of cylin-drical in the presence of symmetry (Treder and Meulenbroek 2010; Wallach and O’Connell 1953). At higher cognitive
Fig. 5. Saccade patterns recorded during the symmetry discrimination task. Traces shown combine data from 6 participants. A: density of saccade amplitudes in 50 bins between 0 and 12° for the four symmetry axis conditions: Right Oblique (RO), Vertical (V), Left Oblique (LO), and Horizontal (H). Traces show little difference between conditions. Most saccades are small, and the distributions peak between 0 and 0.5°. B: saccade rates over the course of the 3-s trials calculated in 16.67-ms intervals show overlapping traces for all 4 symmetry axis conditions. Trace colors as in A. The peak of the saccade rates occurs around 0.5 s. Vertical dotted lines indicate the average reaction times in the discrimination task for each of the conditions. C: reaction times (right-hand side y-axis) and % correct (left-hand side y-axis) are plotted for the 4 axis conditions. D: saccade direction density plotted for the range of directions in 50 bins. In these plots, direction peaks are seen to correspond exactly with the stimulus axes of symmetry. E: group saccade density traces showing means and SEs of the individual continuous function fits based on data from 6 participants. Arrows within circles indicate the orientation of the 4 stimulus axes of symmetry in the discrimination task. The resulting traces allow us to contrast orthogonal axes traces i.e., H against V cases and RO against LO. The significance testing indicated at each of the axes (vertical dashed lines) takes the form of a 2-sample t-test across each direction bin in the distribution between each of the orthogonal pairs of traces (H-V and RO-LO).
by 10.220.33.3 on September 26, 2016
http://jn.physiology.org/
levels, symmetry causes an underestimation of element num-bers compared with estimates from asymmetric controls, pos-sibly due to symmetry-evoked redundancy reduction compu-tations (Apthorp and Bell 2015), and human faces are typically judged to be healthier and more attractive when symmetric (Rhodes 2006). This series of evidence suggests that symmetry has far-reaching effects on the fast integrative visual processes combining disparate bits of information to extract the percep-tual organization of complex visual scenes. It is therefore not surprising that symmetry can also influence active vision by determining gaze patterns during visual search tasks (Kootstra et al. 2011; Locher and Nodine 1973).
However, the nature of such high sensitivity is still highly disputed between the proponents of symmetry processing be-ing a low-level mechanism and those viewbe-ing it as a predom-inantly high-level mechanism. Our strategy was to investigate how fixational eye movements are patterned by axes of mirror symmetry and how such spatio-temporal characteristics of eye movements would depend on the cognitive task at hand. As expected, most eye movements and fixations remained rela-tively near the stimulus center. Saccades were generally small (50% or more of saccades were smaller than 1°) and
presum-ably largely involuntary. Thus fixation tended to remain around the “center of mass” of the visual stimuli (Findlay 1982; He and Kowler 1989). However, we observed small but highly consistent elongations of gaze distributions along the axes of symmetry. Directions of saccades of all sizes were strongly biased parallel to the axis of symmetry. Previous work looking at saccade direction distributions during an orientation discrim-ination of textured ellipses showed similar elongations of distributions, which in that case occurred along the longer axis of elliptically shaped stimuli (Hicheur et al. 2013). This was also consistent with other previous findings linking the direc-tion of fixadirec-tional eye movements to visual task performance. Suppressing certain eye movement directions hindered orien-tation discrimination (Rucci et al. 2007). Furthermore, in the face of high-precision perceptual tasks, goal-directed micro-saccades served to finely relocate the visual target to improve performance (Poletti et al. 2013). It has generally been sug-gested that such fixational eye movements have an additional
Fig. 7. Dynamic saccade selectivity calculated as the ratio of the number of saccades recorded in a small 40° wedge centered on the direction of the axis of symmetry to the total number of saccades. Data are combined across all 6 participants. Selectivity is calculated within 12 bins of 250 ms, and the statistical test for significance indicated by asterisks is a nonparametric
Kruskal-Wallis test with a significance level of P⬍ 0.05. The average reaction
times for each axis condition are plotted as black vertical dashed lines, with SDs given by gray shading. A: for the V axis of symmetry, the selectivity index is plotted against time in seconds for the control (V-control), which shows lower selectivity than both the free exploration passive) and active (V-active) traces. The traces are significantly different for both cases from around
the bin centered on 875 ms, with a consistent difference of⬃0.2 in selectivity.
B: for the horizontal axis of symmetry, dynamic selectivity is plotted with
traces in the same format as above. Baseline selectivity in this axis orientation is higher even for the control due to H-biases and the active (H-active) and free
exploration (H-passive) traces, which are ⬃0.2 selectivity units above the
control (H-control), are only significant in the bins centered on 1,125 and 1,625 ms, respectively. C: selectivity in the RO direction for the active task (RO-active) is significantly higher than the control (RO-control) from 625 ms after onset. D: for the LO direction, the active task selectivity (LO-active) is again significantly higher than the control (LO-control) from 625 ms after onset. Fig. 6. Saccade direction distributions for 6 individual participants under the
active exploration discrimination task. Four conditions are plotted together: horizontal (magenta traces) and vertical (green), left oblique (orange), and right oblique (blue) symmetry. Again, among the 6 participants (S1*–S7), the first 2, S1* and S2*, were nonnaive authors of the present study. The total number of saccades is indicated for each participant. Note that subjects S4 and
S7 made fewer saccades and therefore the distributions are less systematically
aligned with the axis of symmetry. On the contrary, these peaks are more prominent in participants with a larger number of saccades. Overall, the individual data are consistent with Fig. 5, showing peaks along symmetry axes during the discrimination tasks.
by 10.220.33.3 on September 26, 2016
http://jn.physiology.org/
active sampling role beyond countering visual fading (Mc-Camy et al. 2014; Otero-Millan et al. 2008). The currently observed oriented behavior should therefore result in optimal sampling along the axis in the presence of symmetry. Interest-ingly, such fixational patterns were identical when observers were instructed to freely view the stimuli or to discriminate the symmetry axis orientation, a challenging perceptual task under some axis orientation conditions. The consistency of this result across tasks suggests that symmetry processing is an automatic mechanism that is at least in part operating at a low level, and as such optimally shapes the constraints on fixation.
Evidence for automatic symmetry processing through a sustained saccade direction distortion. The main novelty of the
present study is the strong spatial patterning of fixational eye movements in the presence of mirror symmetry. The symmetry axis orientation shaped all types of eye movements. Gaze locations were aligned along it and directions of the predom-inantly small saccades as well as larger ones were also strongly oriented parallel to it, both demonstrating that fixation main-tains the fovea on the symmetry axis and movements explore it over several degrees of visual angle. Our DSI illustrated the dynamics of the saccade directional bias. We found that the saccadic selectivity for the axis of symmetry started as early as 500 ms after stimulus onset and was then sustained until the end of the trial, continuing after the discrimination decision had been made and reported. Such a pattern of temporal dynamics is consistent with human electroencephalography studies showing that event-related potentials associated with symmetric presentations are sustained, starting at 250 –300 ms after presentation onset (Makin et al. 2013; Norcia et al. 2002; Wright et al. 2015), although it should be noted that most electroencephalography studies monitor and discard trials in which eye movements are produced.
The spatio-temporal patterns of fixation along the symmetry axis were the same when subjects were asked to fixate the image (i.e., free exploration) or to perform an orientation discrimination task about the axis of symmetry (i.e., active exploration). In each task, the total number of saccades and the total area covered by fixational movements were only margin-ally affected by the presence and the orientation of a symmetry axis. The orientation of fixation patterns was, however, con-sistently very strongly affected. The exact trajectory of fixa-tional eye movements is often described as a Brownian motion in which the diffusion process can be biased by low-level visual features (Engbert 2006; Rucci and Victor 2015). We clearly demonstrate here that the axis of symmetry is one of these features, acting as an attractor line along which the active eye could optimally structure visual information extraction. The magnitude of this active scanning seems to be scaled (but not qualitatively modified) depending upon the task demand, as suggested by the increasing spread of fixation area along the axis, and the slight increase in saccade rate during the early phase of symmetry discrimination. However, the main spatio-temporal properties of the fixation pattern must be determined by an automatic mechanism detecting the location and orien-tation of the axis of symmetry as a salient feature of the image and sending this information downstream to the oculomotor system finely controlling fixational eye movements (Hafed et al. 2009).
Automatic but not a bug: a role for symmetry axis scanning.
The fact that the spatial properties of the symmetry-dependent
pattern of fixation remain unchanged when human observers must discriminate mirror symmetry axis orientation argues for an automatic processing of symmetry information and its role in the oculomotor control of the active eye. This should, however, not be mistaken for evidence against a functional role for fixational eye movement or its adaptability to task-specific constraints. During symmetric orientation discrimination, sam-pling of the stimulus area extended slightly more along the axis of symmetry. This suggests that the specific fixation behavior observed with mirrored patterns can be boosted, when re-quired, to adjust coverage area along the symmetry axis. This role could be achieved with a functional contribution by fixational eye movements in the analysis of image symmetry, similar to what has been found for other low-level detection and discrimination tasks (e.g., Martinez-Conde et al. 2006; Poletti et al. 2013; Spotorno et al. 2016; Yuval-Greenberg et al. 2014). In an orientation discrimination task in which a textured elliptical shape was embedded in a luminance noise back-ground, saccade rates were lower for dynamic noise than under static noise within a critical window of ⬃2 s from stimulus onset and directional biases along the longer axis were mea-sured during the same time window (Hicheur et al. 2013). Reaction times were slightly longer on average for dynamic backgrounds, implying that the discrimination was more diffi-cult under the condition that also generated fewer saccades and a more stochastic spatio-temporal oculomotor pattern. The explanation for the directional effects of saccades observed was argued in terms of allocation of spatial attention, and in that context we note that saccade rates were only comparable to those recorded in the present tasks (⬎1.0 s⫺1) up to⬃500 ms from stimulus onset. Stimulation with a large simple symmetric stimulus may provide a stronger input than oriented shapes and explain some of the differences. To verify this, the relationship between eye movement patterns and different visual properties that determine image spatial structure (e.g., luminance, shape, symmetry) needs to be further studied in order to better understand how these different features are weighted and integrated to control fixation.
Is the sustained perturbation of saccade generation reported here over a 3-s duration also attributable to allocation of spatial attention along the symmetry axis, or does an alternative low-level mechanism provide a more plausible explanation? For symmetry, we lean toward an interpretation of lower-level mechanisms because of both the persistence of the effect well beyond the discrimination response and its consistency across active and passive exploration conditions. Coherently, some neurophysiological studies have argued that a direct enhance-ment of early visual signals (e.g., primary visual cortex) could be achieved by microsaccades. Such selective enhancement, however, requires that extraretinal information about eye movements is taken into account by the visual system (Marti-nez-Conde et al. 2013; Troncoso et al. 2015). More empirical evidence is still needed to disentangle the contributions of lower-level and cognitive mechanisms to the automatic sym-metry processing and in particular to characterize how this relates to spatial attention. Again, a direct comparison between the different visual features related to spatial structure would help in better understanding whether and how symmetry can specifically shape the interplay between attention and fixation. Two decades of intensive research on visual fixation have overturned the classic view of fixational eye movements.
by 10.220.33.3 on September 26, 2016
http://jn.physiology.org/
Nowadays, fixational movements are seen as a part of a strategy for an optimal spatio-temporal structuring of the visual inflow (see McCamy et al. 2014; Rucci et al. 2016; Rucci and Victor 2015). How can they specifically help in the processing of symmetric images? Our results clearly rule out two alterna-tive strategies that could be proposed for extracting symmetry information and provide strong evidence for a third plausible alternative. We show that saccades do not predominantly occur in a direction perpendicular to the axis of symmetry, as might be expected if performing point-by-point temporal correlation within the foveal area. Moreover, our results demonstrate that even once symmetry had been detected, redundancy was not exploited in the simplest way by exploring only one half of the given dot stimuli. Rather, gaze remained predominantly within the center of mass of the large stimulus area so that the fovea was continuously drifted over a limited central region of interest. We reasoned that, once integrated over time, such sampling movements parallel to the axis of symmetry would yield a stronger signal for local filter correlations detecting symmetry. A similar scheme was proposed in the retinal models of fixational eye movements, which generate sampling improvements by noise enhancement and temporal integration (Zozor et al. 2009). If the role of small saccades is to extend the representation of the dot elements over space and time along the orientation of the axis of symmetry, then after a few eye movements aligned with the axis of symmetry, the “elongated” dots created by persistent sets of effective dipoles generated at each small saccade become easier to detect with local orien-tated filters.
Finally, our results highlight the need for an extension of standard methods of computing visual saliency based on lumi-nance, color, and orientation filters (Itti et al. 1998; Itti and Koch 2001). It has previously been found that symmetry influenced where observers looked in ways that could not be entirely accounted for by the standard saliency models (Koot-stra et al. 2011; Locher and Nodine 1973). Our finding of a profound change of eye movements in the presence of sym-metry supports the previous work in proposing that saliency estimation should take local symmetry information into ac-count. This approach was indeed taken by some of the most sensitive computer vision models (Jenkinson and Brady 2002; Marola 1989). In a biologically plausible framework, high sensitivity is achieved by using multiscale filters sim-ilar to those applied to the standard saliency models (Itti et al. 1998). Locally pairing luminance filters (i.e., with odd-sine and even-coodd-sine phases) can generate sensitivity to local symmetry (Kovesi 1997; Osorio 1996). Further work extending this framework could prove invaluable in estab-lishing a biologically plausible, canonical computation of hierarchical processing.
APPENDIX
Elliptical Gaussian Fitting
The elliptical Gaussian function was used to characterize the 300 ⫻ 300 pixel position density maps obtained by binning valid eye samples to obtain 2D distributions over a 24°⫻ 24° stimulus area. The function is defined by six principal param-eters and can be written in the form of the equation
f
共
x, y兲
⫽ Amp ⫻ exp冉
⫺共
x⫺ xO兲
2 2a2 ⫺theta⫻共
x⫺ xO兲共
y⫺ yO兲
ab ⫺共
y⫺ yO兲
2 2b2冊
(1) A nonlinear least-squares fitting procedure is applied to Eq.1 with group data collected under a given symmetry condition,
implemented in MathWorks MATLAB with the standard “fit” function.
Purpose. For the seven different experimental symmetry
conditions described in MATERIALS AND METHODS, the optimal
2D-elliptical Gaussian parameters (Amp, xO and yO center
positions, a and b widths, i.e., the semimajor and minor axes, and a theta parameter for orientation angle) are obtained. A validation of each fit is then carried out with an implementation of the method described in Nonlinear Fitting Validation below. Five of these six parameters, excluding Amp, were then used to generate ellipses enclosing⬃68% of data points based on the position heat maps and assuming approximately Gaussian distributions (e.g., Fig. 2D). The resulting distributions can be compared for the different test conditions. The results of the fits obtained for the seven experimental conditions, restricted to the width parameters, the corresponding coverage area (ab), and x and y center positions, are shown in Table A1.
Four-Peak Lorentzian Function Fitting
The Lorentzian function is a continuous distribution charac-terized by three parameters per peak. In our case, the choice of four peaks allows a good fit to be made of all the data and requires 13 parameters. It was chosen here to model the one-dimensional saccade direction distributions measured in the experiments as it generates sharp peaks similar to those that were observed in the data (see Fig. 3C, Fig. 4, Fig. 5D, and Fig. 6). There were no underlying assumptions about the physiol-ogy with this function choice. Four peaks were chosen as the minimal parametric complexity that could model the expected two dominant peaks (corresponding to 1 axis of orientation of symmetry resulting in paired peaks in opposite directions) in the possible presence of other smaller peaks. The identification of such dominant peaks was required to compare the relative Table A1. Semimajor and minor axis width parameters, resulting coverage area of ellipse, and x- and y-center positions for ellipses fitted
Stimulus x Width (a) y Width (b) Area, °2 x-Center y-Center
Con (F) 2.03⫾ 1.63 2.98ⴞ 0.1 19.0 ⫺0.31 ⫺0.12 V (F) 1.75⫾ 1.41 4.12ⴞ 2.82 22.7 ⫺0.33 ⫺0.11 H (F) 5.25ⴞ 0.13 1.75⫾ 0.02 28.9 ⫺0.49 ⫺0.04 RO (A) 3.19⫾ 0.18 2.94⫾ 0.15 29.4 ⫺0.23 ⫺0.35 V (A) 1.81⫾ 0.02 5.51ⴞ 0.3 31.4 ⫺0.54 ⫺0.18 LO (A) 5.47ⴞ 0.78 1.70⫾ 0.06 29.3 ⫺0.01 0.02 H (A) 3.18⫾ 0.84 3.44⫾ 0.84 34.3 ⫺0.33 0.13
Values are semimajor and minor axis width parameters, the resulting coverage area of the ellipse, and the x- and y- center positions for the ellipses fitted for the 7 task conditions. The conditions containing (F) correspond to the free exploration cases, while the conditions containing (A) correspond to the active discrimination task. Widths in bold indicate cases in which one axis was found to be wider than the other when SEs of the fits are taken into account.
All fits return center positions close to the stimulus center (xO⬍ 0.54°; yO⬍
0.35°)
by 10.220.33.3 on September 26, 2016
http://jn.physiology.org/
peak directions under our alternative hypotheses on axis align-ment that we sought to test. The function takes the form
f
共
兲
⫽ C ⫻兺
i Ampi⫻ Sigi 2 Sigi 2⫹共
⫺ i兲
2 , i僆兵
1, 2, 3, 4其
(2)C is a constant capturing the isotropically distributed
background number of saccades. Ampi are the magnitudes
of the four respective maxima in the distribution corre-sponding to four different identified peaks. The peak direc-tion is given by i. Finally, distribution width parameters
for each peak Sigiare used in the fitting, bringing the total
number of fitted parameters to 13. The nonlinear fitting procedure is implemented in MATLAB, using the standard function “nlinfit.”
Purpose. The best-fitting Amp, Sig, and parameters
cor-responding to the cardinal directions are compared to the control for the free exploration task, and orthogonal axis pairs are compared in the active discrimination task. A two-sample
t-test at a significance level of P ⫽ 0.05 enables a direct
comparison of the hypotheses that 1) peaks in directions of saccades are not affected by the axis of symmetry, 2) peaks in directions preferentially occur perpendicular to the axis of symmetry, or 3) peaks in directions preferentially occur paral-lel to the axis of symmetry. The fitted functions were tested and found to provide a satisfactory fit for all the distributions when checked with the Kolmogorov-Smirnov test described in
Non-linear Fitting Validation. Nonlinear Fitting Validation
A two-sample Kolmogorov-Smirnov goodness-of-fit test was used to confirm that the distribution functions used pro-vided an acceptable fit of the experimental eye movement data as described in Elliptical Gaussian Fitting and Four-Peak
Lorentzian Function Fitting. The test is a nonparametric
method to quantify the difference between the cumulative distribution function of the reference (e.g., the elliptical Gauss-ian function or the multipeak LorentzGauss-ian) and the measured distribution. This difference generates the KS statistic and a corresponding probability distribution. The null hypothesis is that the samples are drawn from the same distribution, and this is the test applied for fits in this work, with the threshold set at a significance level of P ⫽ 0.05. The test is implemented in MathWorks MATLAB.
ACKNOWLEDGMENTS
We thank volunteer participants for their time and the members of the InViBe Team for their fruitful discussions. We also thank reviewers for their constructive criticism and suggestions during the peer review process.
GRANTS
This research was funded by the Agence National de la Recherche (Grant SPEED, ANR-13-SHS2-0006) and the Centre National de la Recherche Scientifique (CNRS). J. Bell was supported by Australian Research Council (ARC) Grants DP110101511 and LP130100181. A. Montagnini was also supported by the Agence National de la Recherche (Grant REM, ANR-13-APPR-0008-02).
DISCLOSURES
No conflicts of interest, financial or otherwise, are declared by the author(s).
AUTHOR CONTRIBUTIONS
A.I.M., A.M., J.B., and G.S.M. conception and design of research; A.I.M. and A.M. performed experiments; A.I.M., A.M., and G.S.M. analyzed data; A.I.M., A.M., J.B., and G.S.M. interpreted results of experiments; A.I.M., A.M., and G.S.M. prepared figures; A.I.M. and G.S.M. drafted manuscript; A.I.M., A.M., J.B., and G.S.M. edited and revised manuscript; A.I.M., A.M., J.B., and G.S.M. approved final version of manuscript.
REFERENCES
Apthorp D, Bell J. Symmetry is less than meets the eye. Curr Biol 25:
R267–R268, 2015.
Barlow HB, Reeves BC. The versatility and absolute efficiency of detecting
mirror symmetry in random dot displays. Vision Res 19: 783–793, 1979.
Bertamini M, Makin AD. Brain activity in response to visual symmetry.
Symmetry (Basel) 6: 975–996, 2014.
Brainard DH. The Psychophysics Toolbox. Spat Vis 10: 433– 436, 1997. Carmody DP, Nodine CF, Locher PJ. Global detection of symmetry. Percept
Mot Skills 45: 1267–1273, 1977.
Delius JD, Nowak B. Visual symmetry recognition by pigeons. Psychol Res
44: 199 –212, 1982.
Driver J, Baylis GC, Rafal RD. Preserved figure-ground segregation and
symmetry perception in visual neglect. Nature 360: 73–75, 1992.
Engbert R. Microsaccades: a microcosm for research on oculomotor control,
attention, and visual perception. Prog Brain Res 154: 177–192, 2006.
Engbert R, Kliegl R. Microsaccades uncover the orientation of covert
atten-tion. Vision Res 43: 1035–1045, 2003.
Findlay JM. Global visual processing for saccadic eye movements. Vision Res
22: 1033–1045, 1982.
Giurfa M, Eichmann B, Menzel R. Symmetry perception in an insect. Nature
382: 458 – 461, 1996.
Hafed ZM, Clark JJ. Microsaccades as an overt measure of covert attention
shifts. Vision Res 42: 2533–2545, 2002.
Hafed ZM, Goffart L, Krauzlis RJ. A neural mechanism for microsaccade
generation in the primate superior colliculus. Science 323: 940 –943, 2009.
He PY, Kowler E. The role of location probability in the programming of
saccades: implications for “center-of-gravity” tendencies. Vision Res 29: 1165–1181, 1989.
Hicheur H, Zozor S, Campagne A, Chauvin A. Microsaccades are
modu-lated by both attentional demands of a visual discrimination task and background noise. J Vis 13: 2013.
Itti L, Koch C. Computational modelling of visual attention. Nat Rev Neurosci
2: 194 –203, 2001.
Itti L, Koch C, Niebur E. A model of saliency-based visual attention for rapid
scene analysis. IEEE Trans Pattern Anal Mach Intell 20: 1254 –1259, 1998.
Jenkinson M, Brady M. A saliency-based hierarchy for local symmetries.
Image Vis Comput 20: 85–101, 2002.
Kootstra G, de Boer B, Schomaker LR. Predicting eye fixations on complex
visual stimuli using local symmetry. Cognit Comput 3: 223–240, 2011.
Kovesi P. Symmetry and asymmetry from local phase. In: AI’97, Tenth
Australian Joint Conference on Artificial Intelligence, 1997, p. 185–190.
Kowler E. Eye movements: the past 25 years. Vision Res 51: 1457–1483,
2011.
Laubrock J, Kliegl R, Rolfs M, Engbert R. When do microsaccades follow
spatial attention? Atten Percept Psychophys 72: 683– 694, 2010.
Locher PJ, Nodine CF. Influence of stimulus symmetry on visual scanning
patterns. Percept Psychophys 13: 408 – 412, 1973.
Machilsen B, Pauwels M, Wagemans J. The role of vertical mirror symmetry
in visual shape detection. J Vis 9: 11.1–11.11, 2009.
Makin AD, Rampone G, Pecchinenda A, Bertamini M.
Electrophysiolog-ical responses to visuospatial regularity. Psychophysiology 50: 1045–1055, 2013.
Marola G. Using symmetry for detecting and locating objects in a picture.
Comput Vision Graph Image Process 46: 179 –195, 1989.
Martinez-Conde S, Macknik SL, Troncoso XG, Dyar TA. Microsaccades
counteract visual fading during fixation. Neuron 49: 297–305, 2006.
Martinez-Conde S, Otero-Millan J, Macknik SL. The impact of
microsac-cades on vision: towards a unified theory of saccadic function. Nat Rev
Neurosci 14: 83–96, 2013.
McCamy MB, Otero-Millan J, Di Stasi LL, Macknik SL, Martinez-Conde S. Highly informative natural scene regions increase microsaccade
produc-tion during visual scanning. J Neurosci 34: 2956 –2966, 2014.
Norcia AM, Candy TR, Pettet MW, Vildavski VY, Tyler CW. Temporal
dynamics of the human response to symmetry. J Vis 2: 132–139, 2002.
by 10.220.33.3 on September 26, 2016
http://jn.physiology.org/
Osorio D. Symmetry detection by categorization of spatial phase, a model.
Proc Biol Sci 263: 105–110, 1996.
Otero-Millan J, Troncoso XG, Macknik SL, Serrano-Pedraza I, Martinez-Conde S. Saccades and microsaccades during visual fixation, exploration,
and search: foundations for a common saccadic generator. J Vis 8: 21.1– 21.18, 2008.
Pelli DG. The VideoToolbox software for visual psychophysics: transforming
numbers into movies. Spat Vis 10: 437– 442, 1997.
Poletti M, Listorti C, Rucci M. Microscopic eye movements compensate for
nonhomogeneous vision within the fovea. Curr Biol 23: 1691–1695, 2013.
Rhodes G. The evolutionary psychology of facial beauty. Annu Rev Psychol
57: 199 –226, 2006.
Rolfs M. Microsaccades: small steps on a long way. Vision Res 49: 2415–
2441, 2009.
Rucci M, Iovin R, Poletti M, Santini F. Miniature eye movements enhance
fine spatial detail. Nature 447: 851– 854, 2007.
Rucci M, McGraw PV, Krauzlis RJ. Fixational eye movements and
percep-tion. Vision Res 118: 1– 4, 2016.
Rucci M, Victor JD. The unsteady eye: an information-processing stage, not
a bug. Trends Neurosci 38: 195–206, 2015.
Spotorno S, Masson GS, Montagnini A. Fixational saccades during grating
detection and discrimination. Vision Res 118: 105–118, 2016.
Treder MS. Behind the looking-glass: a review on human symmetry
percep-tion. Symmetry (Basel) 2: 1510 –1543, 2010.
Treder MS, Meulenbroek RG. Integration of structure-from-motion and
symmetry during surface perception. J Vis 10: 5.1–5.17, 2010.
Troncoso XG, McCamy MB, Jazi AN, Cui J, Otero-Millan J, Macknik SL, Costela FM, Martinez-Conde S. V1 neurons respond differently to object
motion versus motion from eye movements. Nat Commun 6: 8114, 2015.
Wagemans J. Detection of visual symmetries. Spat Vis 9: 9 –32, 1995. Wagemans J, Van Gool L, d’Ydewalle G. Detection of symmetry in
tachistoscopically presented dot patterns: effects of multiple axes and skewing. Percept Psychophys 50: 413– 427, 1991.
Wallach H, O’Connell DN. The kinetic depth effect. J Exp Psychol 45:
205–217, 1953.
Wright D, Makin AD, Bertamini M. Right-lateralized alpha
desynchroniza-tion during regularity discriminadesynchroniza-tion: hemispheric specializadesynchroniza-tion or directed spatial attention? Psychophysiology 52: 638 – 647, 2015.
Yarbus AL. Eye Movements and Vision. New York: Plenum, 1967. Yuval-Greenberg S, Merriam EP, Heeger DJ. Spontaneous microsaccades
reflect shifts in covert attention. J Neurosci 34: 13693–13700, 2014.
Zozor S, Amblard PO, Duchene C. Does eye tremor provide the hyperacuity
phenomenon? J Stat Mech 2009: P01015, 2009.
by 10.220.33.3 on September 26, 2016
http://jn.physiology.org/