HAL Id: hal-00295703
https://hal.archives-ouvertes.fr/hal-00295703
Submitted on 28 Jul 2005
HAL is a multi-disciplinary open access
archive for the deposit and dissemination of
sci-entific research documents, whether they are
pub-lished or not. The documents may come from
teaching and research institutions in France or
abroad, or from public or private research centers.
L’archive ouverte pluridisciplinaire HAL, est
destinée au dépôt et à la diffusion de documents
scientifiques de niveau recherche, publiés ou non,
émanant des établissements d’enseignement et de
recherche français ou étrangers, des laboratoires
publics ou privés.
modelling and analysis atmospheric general circulation
model
B. Croft, U. Lohmann, K. von Salzen
To cite this version:
B. Croft, U. Lohmann, K. von Salzen. Black carbon ageing in the Canadian Centre for Climate
modelling and analysis atmospheric general circulation model. Atmospheric Chemistry and Physics,
European Geosciences Union, 2005, 5 (7), pp.1931-1949. �hal-00295703�
www.atmos-chem-phys.org/acp/5/1931/ SRef-ID: 1680-7324/acp/2005-5-1931 European Geosciences Union
Chemistry
and Physics
Black carbon ageing in the Canadian Centre for Climate modelling
and analysis atmospheric general circulation model
B. Croft1, U. Lohmann2, and K. von Salzen3
1Department of Physics and Atmospheric Science, Dalhousie University, Halifax, Canada 2Institute of Atmospheric and Climate Science, ETH Zurich, Zurich, Switzerland
3Canadian Centre for Climate modelling and analysis, Meteorological Service of Canada, Victoria, Canada
Received: 1 March 2005 – Published in Atmos. Chem. Phys. Discuss.: 10 March 2005 Revised: 30 June 2005 – Accepted: 30 June 2005 – Published: 28 July 2005
Abstract. Black carbon (BC) particles in the atmosphere
have important impacts on climate. The amount of BC in the atmosphere must be carefully quantified to allow evalu-ation of the climate effects of this type of aerosol. In this study, we present the treatment of BC aerosol in the develop-mental version of the 4th generation Canadian Centre for Cli-mate modelling and analysis (CCCma) atmospheric general circulation model (AGCM). The focus of this work is on the conversion of insoluble BC to soluble/mixed BC by physical and chemical ageing. Physical processes include the conden-sation of sulphuric and nitric acid onto the BC aerosol, and coagulation with more soluble aerosols such as sulphates and nitrates. Chemical processes that may age the BC aerosol in-clude the oxidation of organic coatings by ozone.
Four separate parameterizations of the ageing process are compared to a control simulation that assumes no ageing oc-curs. These simulations use 1) an exponential decay with a fixed 24 h half-life, 2) a condensation and coagulation scheme, 3) an oxidative scheme, and 4) a linear combina-tion of the latter two ageing treatments. Global BC burdens are 2.15, 0.15, 0.11, 0.21, and 0.11 Tg C for the control run, and four ageing schemes, respectively. The BC lifetimes are 98.1, 6.6, 5.0, 9.5, and 4.9 days, respectively. The sensitiv-ity of modelled BC burdens, and concentrations to the fac-tor of two uncertainty in the emissions invenfac-tory is shown to be greater than the sensitivity to the parameterization used to represent the BC ageing, except for the oxidation based parameterization. A computationally efficient parameteriza-tion that represents the processes of condensaparameteriza-tion, coagula-tion, and oxidation is shown to simulate BC ageing well in the CCCma AGCM. As opposed to the globally fixed age-ing time scale, this treatment of BC ageage-ing is responsive to varying atmospheric composition.
Correspondence to: B. Croft (croft@mathstat.dal.ca)
1 Introduction
Aerosol particles in the atmosphere, such as black carbon (BC), have a significant influence on global climate. These particles both scatter and absorb radiation, thus impacting radiative transfer through the atmosphere (direct and semi-direct effects). Additionally, aerosols act as cloud condensa-tion and ice nuclei, which influence cloud properties (indirect effects). The first indirect effect is based on the premise that for a given amount of cloud liquid water content, increased aerosol number implies more, and smaller cloud droplets, and hence a more strongly reflective cloud. The second indi-rect effect suggests that a cloud with more but smaller cloud droplets will be less likely to precipitate (i.e. enhanced life-time) due to a slower growth of the individual droplets. Black carbon aerosols have a role to play in all of these climate ef-fects. For this reason, the concentration of BC aerosols must be accurately determined by atmospheric general circulation models (AGCMs).
Black carbon particles may exist in the atmosphere as ei-ther insoluble particles, or in mixtures that are considered soluble. BC in a soluble mixture will be more efficiently removed by dry and wet deposition processes, and have a shorter atmospheric residence time (Chylek et al., 1999; Hitzenberger et al., 2001; Zuberi et al., 2005). AGCMs must quantify the amount of BC that exists in the insoluble versus soluble/mixed state. For simplicity, many AGCMs assume that surface based sources are comprised of BC that is 80% insoluble, and 20% soluble (Cooke et al., 1999; Lohmann et al., 1999; Koch, 2001; Chung and Seinfeld, 2002; Cooke et al., 2002). Following emission, BC is subject to atmo-spheric processes, which include oxidation, condensation and coagulation. These processes, termed the ageing pro-cesses, act to change the solubility of the BC aerosol. Pa-rameterization of the BC ageing processes in AGCMs is key to the determination of the atmospheric abundance of this aerosol.
To date, many AGCMs have assumed that the conversion from insoluble to soluble BC follows an exponential decay process with a half-time in proximity to 24 h (Cooke et al., 1999; Lohmann et al., 1999; Koch, 2001; Chung and Sein-feld, 2002). This approach has an obvious limitation since decay rate should vary depending on the physical or chemi-cal process that dominates the ageing. Coagulation should be enhanced in regions of greater total aerosol number concen-tration. Additionally, regions with large fossil fuel burning emissions will have higher concentrations of sulphuric and nitric acid vapours available for condensation, as compared to regions dominated by open burning emissions. The rela-tive importance of oxidarela-tive processes is not well quantified in a global sense. However, laboratory studies have shown oxidation to play a role in the BC ageing process (Zuberi et al., 2005; Decesari et al., 2002; P¨oschl et al., 2001).
The focus of this study is to examine the relative impact of several parameterizations of the BC ageing process on the BC burdens, concentrations and lifetimes. To this end, four separate parameterizations are employed in the development version of the Canadian Centre for Climate modelling and analysis (CCCma) AGCM. These will be discussed in greater depth in the model description section. One parameterization is based on condensation and coagulation processes (Riemer et al., 2004a). This parameterization was originally designed for use in regions dominated by fossil fuel burning. A sec-ond parameterization is based exclusively on oxidation, fol-lowing P¨oschl et al. (2001) and Tsigaridis and Kanakidou (2003). A third and novel parameterization assumes that the processes of oxidation, condensation, and coagulation may be treated in an additive manner. These three parameteri-zations are compared to the parameterization used by many AGCMs, which assumes a fixed e-folding time, and addition-ally to a control simulation that assumes no ageing occurs.
An overview of the developmental version of the 4th gen-eration CCCma AGCM, and the details of the various treat-ments for BC ageing are in Sect. 2. In Sect. 3, the mod-elled BC burdens, concentrations and lifetimes are presented. A comparison is made between the separate parameteriza-tions, which shows the relative importance of the physical and chemical processes involved in BC ageing. This section also includes comparisons with previous modelling studies, and with another emission inventory. As well, the sensitiv-ity of the modelled BC burdens to the factor of two uncer-tainty in the emission inventories (Bond et al., 2004), and the model resolution is examined. Section 4 shows comparisons with observed surface layer concentrations for several sites in both continentally influenced, and remote locations.
2 Model description
A developmental version of the fourth generation CCCma AGCM has been used for this study (von Salzen et al.,
2005)1. The spectral transform method is used with trian-gular truncation at wave number 47 (T47) to represent the horizontal spatial structure of temperature, specific humid-ity, surface pressure, vortichumid-ity, divergence, and the mass mix-ing ratios of cloud liquid and ice water, and chemical tracers. The model equations are solved on 35 vertical levels using a hybrid pressure-sigma grid. Physical terms, and nonlinear processes are evaluated on a horizontal grid at a resolution of 3.75×3.75◦. The time step used is 20 min.
An interactive sulphur cycle is included in the model (Lohmann et al., 1999; von Salzen et al., 2000). Sulphate aerosol concentrations affect clear-sky radiative transfer di-rectly and indidi-rectly via the first and second indirect effect in stratiform clouds (Haywood and Boucher, 2000; Lohmann and Feichter, 1997). In the model, the tracer quantity that is transported is the transformed variable,
s =
( q0
[1 + p ln(q0/q)]1/p , if q < q0,
q , if q ≥ q0,
where q is the physical variable (i.e. specific humidity, chem-ical tracer mixing ratios, and cloud liquid and ice water), and
q0 and p are constants. This is a generalization of the hy-brid variable transformation proposed by Boer (1995). The use of this transformed variable alleviates to a considerable extent the undesirable overshoots and undershoots that can occur when spectrally transporting rapidly varying functions (Merryfield and Holloway, 2003). In particular, unphysical negative values, and the undesirable effects that accompany them are largely suppressed. Although the transport algo-rithm is conservative with respect to s, the physical variable
q no longer is precisely conserved under transport. How-ever, by judiciously choosing q0and p, the degree of global
non-conservation can be effectively controlled. Therefore,
q0 and p are assigned separately for each tracer according to a criterion that non-conservation errors do not exceed a certain threshold. The model also includes a method that lo-cally corrects for any residual changes in global tracer mass that may be caused by transport of the hybrid variable. The AGCM includes an updated version of the dust source flux parameterization described in Reader et al. (1999), with a single global source strength parameter, dependence on wind friction speed rather than wind speed, and improved soil-moisture dependence.
2.1 Carbon aerosol simulation
The two prognostic variables for black carbon (BC) in the AGCM are the insoluble BC and the soluble/mixed BC mass mixing ratios. Soluble/mixed BC is the form that can act as cloud condensation or ice nuclei. Black carbon emissions are from Bond et al. (2004) for the fossil fuel and bio-fuel
1von Salzen, K., McFarlane, N. A., and Lazare, M.: The role
of shallow convection in the water and energy cycles of the atmo-sphere, Climate Dynamics, in press, 2005.
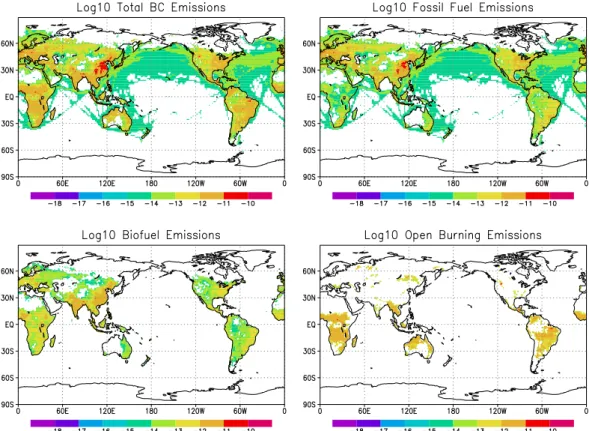
Fig. 1. Log10of annual mean column black carbon emissions (kg C/m2/s) from Bond et al. (2004) for fossil fuel and bio-fuel burning, and
from van der Werf et al. (2003) for open burning.
burning emissions, and from van der Werf et al. (2003) for open burning, including large agricultural fires. These emis-sion inventories are for the year 1996 and 2000, respectively. The annual BC emissions are 3.04, 1.63, and 3.32 Tg C/yr for fossil fuel, bio-fuel, and open burning, respectively. Figure 1 shows the global distribution of column BC emissions. The open burning emissions are emitted into layers up to 6 km above the surface, whereas fossil fuel and bio-fuel are into layers up to 100 m. The distribution of these emissions into vertical layers is shown in the four panels of Fig. 2.
The emissions are assumed to be 80% insoluble and 20% soluble/mixed. Compounds may become attached to the black carbon and undergo chemical processes. This alters the solubility of the aerosol. These processes are termed ageing. Many models assume ageing to be an exponential decay pro-cess with a fixed half life close to 24 h (Cooke et al., 1999; Lohmann et al., 1999; Chung and Seinfeld, 2002).
The aerosols are removed from the atmosphere by the pro-cesses of wet and dry deposition. The dry deposition flux is proportional to the BC concentration in the lowest model layer and a dry deposition velocity. This is 0.025 cm/s over dry surfaces and 0.2 cm/s over wetted surfaces for the solu-ble/mixed BC, and 0.025 cm/s over all surfaces for the insol-uble BC. The equation for dry deposition is
Fd =ρ · Mi·Vd (1)
where ρ is the air density, Miis the mass mixing ratio of the
tracer and Vdis the dry deposition velocity that depends on
surface type.
The wet deposition is proportional to the precipitation for-mation rate (Feichter et al., 1996; Lohmann et al., 1999; von Salzen et al., 2000). There is both in-cloud and below cloud scavenging. Only the soluble/mixed BC is subject to in-cloud scavenging. For the convective clouds, the in-cloud scaveng-ing rate for soluble/mixed BC has the form,
δMuCu
δz = −Co·fo·Mu·Cu (2)
where Co accounts for the conversion from cloud water to
rainwater in the timestep following Lord (1982), fo is the
fraction of the tracer dissolved in the cloud droplets and is assumed to be unity for all particles larger than a certain crit-ical size, Muis the upward mass flux of air in the convective
region and Cu is the concentration of the tracer in the
up-draft region. The CCCma AGCM does not include below cloud scavenging for the convective clouds. The stratiform in-cloud scavenging of soluble/mixed BC over the timestep,
δt, is given by,
δC δt =a
H Cc
Fig. 2. Log10of annual mean black carbon emissions (kg C/m2/s) into layers from surface to 100 m, 100–500 m, 500–1000 m, and 1000– 6000 m from Bond et al. (2004) for fossil fuel and bio-fuel burning, and from van der Werf et al. (2003) for open burning.
where C is the tracer concentration, Cc is the in-cloud
con-centration of the tracer, a is the cloud fraction, and H is a Henry’s law constant. τ is given by
τ = LW C
Qaut+Qacc
(4) where LW C is the cloud liquid water content, Qaut is the
rate of autoconversion of cloud liquid water, and Qaccis the
rate of accretion of cloud liquid water by rain. The strati-form below cloud scavenging gives the change in the tracer concentration over the timestep, δt , as,
δC = k · C · Ko·Pr·δt (5)
where the collection efficiency, Ko, is 0.3, Pr is the
precip-itation rate, C is the tracer concentration, and the constant
kis 5.2 m3kg−1s−1. The below cloud scavenging efficiency is assumed to be the same for both the insoluble, and solu-ble/mixed BC, and sulphate. There remains uncertainty with regard to the magnitude and sign of the bias that this assump-tion may cause in the modelled removal rates.
In this study, several physically and chemically based treatments for BC ageing are examined using the CCCma AGCM. Three processes that contribute to BC ageing are, coagulation with soluble aerosols, condensation of sulphuric and nitric acid gases onto the aerosol, and BC aerosol sur-face coating oxidation by ozone. The condensation of
semi-volatile organic gases onto the BC aerosol is an additional process that is neglected in this study, but may well be of importance.
Using a mesoscale model, Riemer et al. (2004a) repre-sented the processes of condensation and coagulation over a region roughly the size of one AGCM grid box, but in more explicit detail than an AGCM permits. These authors find that in a region dominated by significant fossil fuel burning emissions, the process of condensation is dominant during the day, and coagulation is dominant at night. Ageing by the process of condensation is found to be very rapid. During the day, the e-folding time for the ageing process was found to be 8 h below 250 m, and above this, and up to 2–3 km, the e-folding time was 2 h. During the night time, Riemer et al. (2004a) found that the e-folding time, τ , in hours, was dominated by the process of coagulation, and may be param-eterized as a function of the internally mixed aerosol number concentration (Na),
τ = exp(−aNa+b), (6)
where Nais less than 4100 cm−3, and as
τ = −c + dNa, (7)
where Na is more than 4100 cm−3. The constants, a,
1.48·105h cm−3, respectively. Another form of this relation
has more recently been proposed as
τ = a Na + b N2 a (8) by Riemer et al. (2004b), The constants, a and b, are 6·104h cm−3 and 3·108h cm−6, respectively. This relation is not used here, since this was not available at the time that this study was conducted. However, since both forms of this relation are very similar over the range of Na that
predom-inates globally, not much difference is expected in the re-sults. A preliminary run of a simulation using Equation 8 (not shown) gives a global and annual mean BC burden that differs by less than 0.1% from an otherwise identical simu-lation that uses Eqs. (6) and (7). The Riemer et al. (2004a) parameterization for both day-time and night-time ageing is applied in the CCCma AGCM. The results of these exper-iments are called COND-COAG. Note that the day-time e-folding time is assumed to be 2 h for all grid boxes that are 250 m or more above ground ground level, and 8 h for all grid boxes below this altitude. Table 1 shows a summary of all model simulations conducted.
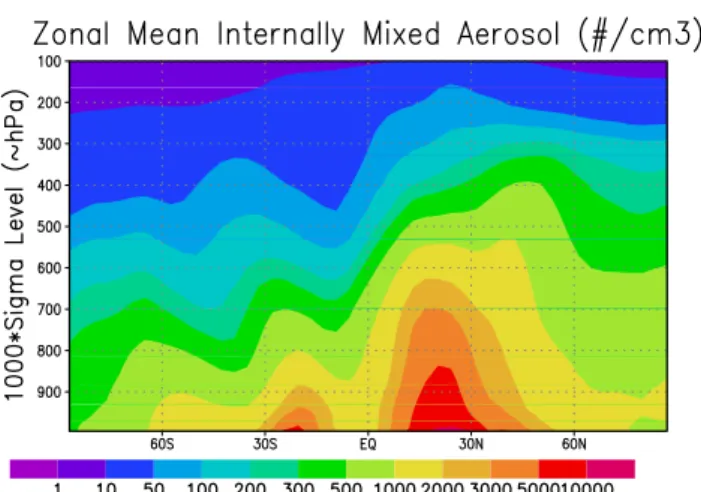
The zonal mean internally mixed aerosol number concen-tration is shown in Fig. 3, for the FIX-LIFE simulation. Co-agulation is enhanced in regions of greater aerosol number following the Riemer et al. (2004a) parameterization. In the COND-COAG simulation, the internally mixed aerosol is as-sumed to include all of the mass of sulphate, soluble/mixed BC and OC, and accumulation mode dust and sea salt. The conversion from mass mixing ratio to number concentration is made assuming a log-normal size distribution with a mode radius of 0.069 µm, and standard deviation of 1.538 follow-ing Lesins and Lohmann (2005)2. The lognormal assumption gives the following relation between number concentration,
Na, and mass mixing ratio,
Na= ρaM ρi (π 6D 3exp(9/2) ln2σ g)−1 (9)
where ρais the air density, M is the mass mixing ratio, D is
the modal diameter and σg is the standard deviation for the
lognormal distribution. M is the sum of the BC, OC, sul-phate, dust, and sea salt mass mixing ratios. ρiis the
collec-tive density, weighted by the density of the respeccollec-tive com-ponents of the internally mixed aerosol.
Compounds may coat the BC aerosol, and then become oxidized (P¨oschl et al., 2001). A pseudo-first order decay rate coefficient for the rate of oxidation of a BC coating (benzo[a]pyrene) by ozone has been determined from lab-oratory studies by P¨oschl et al. (2001). These authors find that the decay rate coefficient, k, is dependent on the number of available sites on the BC aerosol, and the sticking
coeffi-2Lesins, G. and Lohmann, U.: Using MODIS and AERONET
to determine GCM aerosol size, J. Atmos. Sci., submitted, 2005.
Fig. 3. Zonal and annual mean internally mixed aerosol number
concentration (number cm−3). Vertical axis is model hybrid sigma level scaled by 1000, but roughly corresponds to hPa.
cients, residence times, and concentration of both ozone and water vapour molecules;
k = K∞kO3[O3] 1 + kO3[O3] +kH2O[H2O]
, (10)
where K∞is the pseudo-first-order decay rate coefficient in
the limit of high O3(0.015 s−1) and kO3 and kH2O are the adsorption rate coefficients of ozone and water vapour, re-spectively. These are given by,
ki =
So,iωi
4[SS]S
τi, (11)
where So,i is the sticking coefficient of O3 and H2O
(3.3·10−3and 0.4·10−3, respectively), ωi is the mean
ther-mal velocity , [SS]S is the surface concentration of
adsorp-tion sites (5.7·1014cm−2), and τi is the mean residence time
of O3and H2O on the surface sites (5 s and 3·10−3s,
respec-tively). Water vapour acts to impede the oxidation by ozone since these gases compete to occupy the available sites on the aerosol. The lifetime of the BC coating with respect to oxi-dation was found by these authors to be in the order of 5 to 15 min for dry versus humid conditions. In poorly oxidizing environments, this lifetime will be longer. This parameteri-zation is tested in the simulation called OXID.
Additionally, it is important to note that the rate of oxi-dation of a surface coating is not synonymous with the rate of production of a soluble aerosol particle. In particular, the material to be oxidized is not likely to be distributed homo-geneously over the BC aerosol. In reality, there are phys-ical shielding effects that slow the rate of the ageing. BC aerosols are not uniform spheres, but have been observed to exhibit a chain structure that collapses to a clump like struc-ture (Abel et al., 2003). Species that are deposited on the BC aerosol could be physically shielded from the oxidants by the layering of both themselves and the BC as suggested
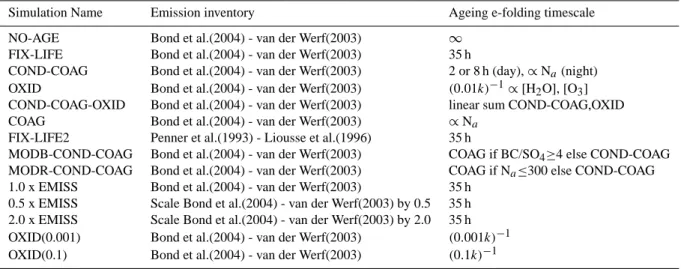
Table 1. Summary of simulations conducted showing assumptions regarding the BC ageing process, and emissions inventory used.
Simulation Name Emission inventory Ageing e-folding timescale
NO-AGE Bond et al.(2004) - van der Werf(2003) ∞
FIX-LIFE Bond et al.(2004) - van der Werf(2003) 35 h
COND-COAG Bond et al.(2004) - van der Werf(2003) 2 or 8 h (day), ∝ Na(night)
OXID Bond et al.(2004) - van der Werf(2003) (0.01k)−1∝[H2O], [O3]
COND-COAG-OXID Bond et al.(2004) - van der Werf(2003) linear sum COND-COAG,OXID
COAG Bond et al.(2004) - van der Werf(2003) ∝Na
FIX-LIFE2 Penner et al.(1993) - Liousse et al.(1996) 35 h
MODB-COND-COAG Bond et al.(2004) - van der Werf(2003) COAG if BC/SO4≥4 else COND-COAG
MODR-COND-COAG Bond et al.(2004) - van der Werf(2003) COAG if Na≤300 else COND-COAG
1.0 x EMISS Bond et al.(2004) - van der Werf(2003) 35 h
0.5 x EMISS Scale Bond et al.(2004) - van der Werf(2003) by 0.5 35 h 2.0 x EMISS Scale Bond et al.(2004) - van der Werf(2003) by 2.0 35 h
OXID(0.001) Bond et al.(2004) - van der Werf(2003) (0.001k)−1
OXID(0.1) Bond et al.(2004) - van der Werf(2003) (0.1k)−1
Table 2. Global and annual mean black carbon burdens, lifetimes, and deposition rates.
NO-AGE FIX-LIFE COND-COAG OXID COND-COAG-OXID
Emission (Tg C/yr) 8.01 8.01 8.01 8.01 8.01
Burden (Tg C) 2.153 0.145 0.109 0.209 0.108
Lifetime (days) 98.1 6.6 5.0 9.5 4.9
Wet dep (Tg C/yr) 5.07 6.09 5.99 6.00 5.98
Dry dep (Tg C/yr) 2.64 1.92 2.02 2.01 2.03
by P¨oschl et al. (2001). There is little guidance to date on how to model the effects of physical shielding. As an initial approach, the reaction rate constant is scaled by a factor in the simulation OXID. The sensitivity to this scaling factor is considered in Sect. 3, and comparisons with surface observa-tions are shown in Sect. 4.
To date, no AGCM studies have attempted to combine the processes of coagulation, condensation, and oxidation. This will be the first study to do so with the simulation COND-COAG-OXID. As a first step, it is assumed that these pro-cesses can be combined in a linearly additive manner. This may under-estimate the ageing time scale since this assumes that the processes occur entirely independently, and do not compete with each other on time scales in the order of one model time-step. Unfortunately, there is no laboratory evi-dence available to suggest how these processes interact. Ta-ble 1 summarizes the simulations conducted in this study, and shows the assumptions made about the ageing time-scale, and the emissions inventories used.
3 Burdens, concentration and lifetimes
In total five primary simulations were conducted with the CCCma AGCM. All results shown are time averages from 3-year model runs following a 5-month spin up period, and use monthly mean climatological sea surface temperatures that are representative for the second half of the 20th century. The first simulation (NO-AGE) assumes no ageing i.e. there is no conversion from insoluble to soluble/mixed BC. This simu-lation serves to motivate the work, and demonstrates that it is important to represent the ageing process in a AGCM, but is a very unlikely scenario. The second simulation (FIX-LIFE) assumes an exponential decay of the insoluble BC to the sol-uble/mixed state with a fixed half life of 24 h (i.e. an e-folding time of 35 h). The remaining simulations are COND-COAG, OXID and COND-COAG-OXID, as discussed in the previ-ous section and outlined in Table 1.
Fig. 4. Annual mean black carbon burdens (mg C/m2) from the five primary simulations. Same colorbar applies to all plots.
The global and annual mean BC burdens, lifetimes, and deposition rates for the five simulations are shown in Ta-ble 2. Geographical distributions of the burdens are shown in Fig. 4. The NO-AGE simulation gives a global and annual mean burden that is more than an order of magnitude higher than any of the other simulations. This suggests that the ageing parameterization is clearly important in an AGCM. This high burden is predicted because a higher percentage of the total BC resides in the insoluble state. Insoluble BC is less efficiently removed by the process of wet deposition, the primary removal process. Note that wet and dry deposition account for roughly 75 and 25 percent of the total
deposi-tion, respectively, in all of the simulations except NO-AGE. Aside from NO-AGE, the simulations give burdens that are all within a factor of two of each other. The lifetime of BC is found to be on the order of one week. The exception is the NO-AGE simulation that has a lifetime close to three months. The BC ageing is fastest in the COAG and COND-COAG-OXID simulations. The ageing in these simulations is primarily controlled by the assumption that the day-time age-ing time-scale is 2 h in all grid boxes that are 250 m or more above ground level, and 8 h for grid boxes below this height. This time-scale is due to condensation of sulphuric acid, as-suming that sulphate production and condensation dominate
Fig. 5. Zonal and annual mean BC concentrations (ng/m3) from four of the simulations. Vertical axis is model hybrid sigma level scaled by 1000, but roughly corresponds to hPa.
the day-time ageing, but shut off at night. This follows the work of Riemer et al. (2004a) where the process of condensa-tion is modelled as in Binkowski and Shankar (1995). There does remain uncertainty with regard to how the condensation of sulphuric acid varies depending on the composition of the pre-existing aerosol. We also note that Riemer et al. (2004a) ignored the in-cloud production of sulphate that could occur at night. Thus, the night-time ageing, due to coagulation alone, might be too slow. One might also question the use of this fixed day-time e-folding time in remote regions where sulphate production is lower, and further in regions where sulphate production is low, but BC concentrations are still relatively high, such as in areas where open burning is the dominant BC source as opposed to fossil fuel burning. These considerations are further investigated in the following sub-section.
The results of the COND-COAG and COND-COAG-OXID simulations are very similar since to the contribution
of oxidation to the BC ageing process is modelled to be quite small. This small contribution was modelled for two primary reasons. Firstly, previous studies have suggested that this contribution is small (Saathoff et al., 2003). Secondly, com-parison of the BC concentrations from the COND-COAG simulation with observations, as shown in Sect. 4, suggests that the added effect of oxidative processes should not be too large. Sensitivity to the assumptions regarding the oxidation parameterization is shown in a following subsection. A pa-rameterization based on oxidation of the organic coating of BC has been studied previously by Tsigaridis and Kanaki-dou (2003) using a global 3-dimensional chemistry/transport model. The calculated lifetimes of the primary hydrophobic carbonaceous aerosol due to oxidation were smaller than in this study. Tsigaridis and Kanakidou (2003) reported these lifetimes to be in the same order of magnitude as those of Cooke et al. (1999) i.e. 1.15 days, but with high spatial differ-ences largely due to the water vapour distribution. However,
Fig. 6. Annual mean percent of BC existing in the soluble/mixed state as determined by the ratio of column burdens from four of the BC
ageing simulations.
one must bear in mind that this result would be sensitive to these authors assumptions regarding the aerosol size, and the thickness of oxidized coating required to consider the aerosol hydrophylic. The validity of these assumptions on a global scale needs further justification before one could definitively conclude on the contribution of oxidation to the BC ageing process, and likewise for this study.
Figure 5 shows the zonal mean BC concentrations. The trends seen here are similar to those seen in the previous figure. The peak concentrations occur near the surface in the midlatitudes of the Northern Hemisphere due to fossil fuel burning. A secondary peak near the equator is associ-ated with open and bio-fuel burning. In the OXID simula-tion, the BC concentrations decay slower with height than in the other simulations, except for NO-AGE. This reflects the slower ageing due to oxidation. Concentrations decay the fastest with height in the COND-COAG-OXID simulation. This difference will have a potentially significant impact on estimates of the indirect effect due to ice nucleation in the upper troposphere since in the FIX-LIFE and OXID simula-tions have considerably more BC mass to act as ice nuclei (Lohmann, 2002) in the upper troposphere.
Figure 6 shows the fraction of the total BC that resides in the soluble/mixed state for four of the simulations as deter-mined by taking the ratio of column burdens. We can see
that in the NO-AGE simulation less than 10% of the BC aerosol exists in a soluble state. The 20% of BC emissions assumed to be soluble/mixed has been efficiently removed by the wet deposition processes. In all other simulations, over the oceans the percent in the soluble state is mostly over 90%. Over the continents, the transfer of BC to the solu-ble mixed state is much faster in the COND-COAG-OXID simulation as compared to the FIX-LIFE simulation. In the FIX-LIFE simulation, extensive continental zones exist where only about 60% of the BC is in the soluble mixed state. Whereas in the COND-COAG-OXID simulation, continen-tal BC is generally in excess of 80% in the soluble mixed state. This will have implications on estimates of the semi-direct and insemi-direct effect of the BC aerosols (Lohmann and Feichter, 2005), since only the portion of BC in the soluble mixed state can act as cloud condensation nuclei.
3.1 Sensitivity to condensation and coagulation parameter-ization
This subsection examines the sensitivity of the BC bur-dens to the conbur-densation and coagulation parameterizations. The Riemer et al. (2004a) parameterization, used in the COND-COAG simulation, was originally developed for re-gions dominated by fossil fuel burning. The question arises, how appropriate is the 2 h day-time e-folding time in 1)
Fig. 7. Annual mean surface layer BC and SO2mass mixing ratios (µg C/ kg air and µg S/kg air, respectively) from the FIX-LIFE simulation
are shown on left. Surface layer black carbon to SO2ratio (kg C/kg S), and inverse are shown on right, and regions dominated by open and
bio-fuel burning are enclosed within the labelled contours.
remote regions away from BC emission sources, and 2) re-gions dominated by open and bio-fuel burning? The COND-COAG simulation may under-estimate burdens in these re-gions since there is less sulphuric acid available for conden-sation there. To give an upper bound on the BC burdens due to these concerns, two sensitivity simulations are conducted, MODR-COND-COAG and MODB-COND-COAG.
The MODR-COND-COAG simulation assumes no age-ing due to condensation in remote regions, i.e. where the internally mixed aerosol number concentration is less than 300 cm−3(Peng et al., 2002). Instead, the coagulation pa-rameterization is applied during the day-time, as well as dur-ing the night-time in these relatively cleaner, and remote re-gions. In the non-remote regions, the day-time condensation parameterization remains unmodified. Note that the mod-elled number concentrations are high in comparison to cer-tain observations (Peng et al., 2002). This is partly due to the choice of one globally applicable mode radius for the log-normal distribution. This radius is relatively low for re-gions dominated by sea salt and dust aerosols (see Hess et al., 1998). However, this mode radius was used since this was one of the only values for a global mode radius available. As a result, the BC burden in the MODR-COND-COAG simu-lation might err towards being too low, since less regions fall into the remote category than if the modelled number con-centrations were lower.
The MODB-COND-COAG is a sensitivity test applied to regions dominated by open and bio-fuel burning. In these re-gions, BC mass concentrations are high, but SO2mass
con-centrations are relatively much lower (Hobbs et al., 2003; Abel et al., 2003). Thus, relatively less sulphuric acid vapour should be available to contribute to the BC ageing than in regions where fossil fuel emissions dominate. From a theo-retical standpoint Kanakidou et al. (2005) have shown that the ageing time-scale due to condensation should be pro-portional to the ratio of the mass of the insoluble aerosols over the the sulphate production rate. Assuming the sul-phate production rate to be proportional to the SO2
concen-tration, a BC/SO2 ratio of 0.25 or greater is used to
iden-tify these regions of open and bio-fuel burning where age-ing by sulphuric acid condensation is expected to be less. In these areas, as an extreme case, the day-time ageing due to condensation is assumed to be negligible, and instead the coagulation parameterization is applied throughout the diur-nal cycle. Outside these regions, the day-time condensation parameterization remains unmodified. Figure 7 shows that this threshold effectively separates the regions where bio-fuel and open burning dominate over fossil fuel burning. This simulation is likely to over-estimate the ageing time-scale since the process of condensation of semi-volatile organic gases, as well as sulphuric acid condensation, is neglected. The BC burdens and deposition rates from these sensitivity
Table 3. Global and annual mean BC burdens, lifetimes, and deposition rates from the sensitivity studies related to the condensation and
coagulation parameterization.
COND-COAG MODR-COND-COAG MODB-COND-COAG COAG
Emission (Tg C/yr) 8.01 8.01 8.01 8.01
Burden (Tg C) 0.109 0.113 0.140 0.171
Lifetime (days) 5.0 5.1 6.4 7.8
Wet dep (Tg C/yr) 5.99 5.96 5.96 5.99
Dry dep (Tg C/yr) 2.02 2.05 2.05 2.02
Table 4. Global and annual mean BC burdens, lifetimes, and
de-position rates from the sensitivity studies related to the oxidation parameterization.
OXID(0.001) OXID(0.01) OXID(0.1)
Emission (Tg C/yr) 8.01 8.01 8.01
Burden (Tg C) 0.483 0.209 0.106
Lifetime (days) 22.0 9.5 4.8
Wet dep (Tg C/yr) 5.75 6.00 6.00
Dry dep (Tg C/yr) 2.24 2.01 2.01
tests are shown in Table 3. The best prediction of the BC burden for the open burning dominated regions may then lie somewhere between the result the MODB-COND-COAG and COND-COAG simulations.
The global and annual mean BC burdens from the MODR-COND-COAG and MODB-MODR-COND-COAG give the upper bounds on the BC burden estimates as compared to the COND-COAG simulation. Recent work (Abel et al., 2003) suggests that BC does age rapidly in the open burning zones, and so there is reason to believe that the COND-COAG sim-ulation may, in fact, be closer to reality for these regions, although not technically correct. Additionally, one may ar-gue that in the remote regions, there is less sulphuric acid, but there is also less BC, and so the ageing time-scale developed for the more polluted regimes may still be appropriate. This further supports the idea that the COND-COAG simulation maybe closer to reality than either of these two sensitivity tests. An additional sensitivity test was conducted to show the relative importance of the processes of coagulation on a global scale. This simulation (COAG) assumed that coagula-tion was the only process contributing to BC ageing over the entire diurnal cycle. The BC burdens and deposition rates from this sensitivity test are also shown in Table 3. Both condensation and coagulation are shown to contribute signif-icantly to BC ageing.
Table 5. Global and annual mean BC burdens, lifetimes, and
depo-sition rates from the sensitivity studies related to emissions. Emis-sions are scaled by factors shown in table. All results shown are for the FIX-LIFE simulation.
0.5 x EMISS 1.0 x EMISS 2.0 x EMISS
Emission (Tg C/yr) 4.00 8.01 16.02
Burden (Tg C) 0.071 0.145 0.317
Lifetime (days) 6.5 6.6 7.2
Wet dep (Tg C/yr) 2.98 6.09 12.29
Dry dep (Tg C/yr) 1.02 1.92 3.73
3.2 Sensitivity to oxidation parameterization
The OXID simulation gave the slowest ageing but this is de-pendent on the scaling factor (0.01) chosen in the parameteri-zation to account for the physical shielding effects. To inves-tigate the impact of this factor, two other values are chosen, 0.1 and 0.001. Since this is the first study to use this factor, and its choice was rather arbitrary, a wide range of values were selected. The resulting burdens are shown in Table 4. There is a high sensitivity to this factor. The global and an-nual mean BC burden when the factor was set to 0.1 was almost the same as that from the COND-COAG simulation. Since there is no evidence available to suggest that the age-ing by oxidation processes should be as significant as that by condensation and coagulation on a global scale, this simu-lation likely under-estimates of the ageing time-scale due to oxidation. Unfortunately, there is a high level of uncertainty associated with this factor, and it can not be used with any degree of confidence. Further laboratory studies are needed to investigate how the rate of soot oxidation relates to the rate of production of a soluble aerosol (i.e. an aerosol that could act as a cloud condensation or ice nuclei at typical at-mospheric supersaturations). This will help to improve the high uncertainty related to this scaling factor, and the oxida-tion parameterizaoxida-tion as a whole.
Table 6. Simulations with different emissions inventories, and comparison with previous studies. FIX-LIFE and FIX-LIFE2 simulations use
the combined Bond et al. (2004)–van der Werf et al. (2003) and Liousse et al. (1996)–Penner et al. (1993) inventories, respectively. FIX-LIFE FIX-LIFE2 Lohmann et al. (1999) Koch (2001) Chung and Seinfeld (2002) Stier et al. (2005)
Emissions (Tg C/yr) 8.01 13.1 11.7 12.4 12.0 7.7
Burdens (Tg C) 0.15 0.23 0.26 0.15 0.22 0.11
Lifetimes (days) 6.6 6.5 8.1 4.4 6.4 5.4
Fig. 8. Annual mean black carbon burdens (mg C/m2) from simulations with a fixed 24 h ageing half life, and using different inventories. Simulation FIX-LIFE1 uses the Bond et al. (2004) and van der Werf et al. (2003) inventories, and FIX-LIFE2 uses the Penner et al. (1993) and Liousse et al. (1996) inventories.
3.3 Sensitivity to emissions and resolution
The BC emission inventory used in this study has roughly a factor of two uncertainty (Bond et al., 2004). Table 5 shows the global and annual mean results from simulations where the emissions were both increased and decreased by a factor of two. There is a high sensitivity to this factor of two un-certainty in the emissions. This highlights the importance of ongoing work to prepare accurate emission inventories. In-deed, in terms of the modelled BC burden, there is a greater sensitivity to the factor of two uncertainty in the emissions inventory than there is to any of the ageing tions with the exception of the oxidation based parameteriza-tion. One of the few studies published to date using this same emission inventory in an AGCM was the study was by Stier et al. (2005). This study used an explicit representation of the processes of condensation and coagulation that was more computationally demanding than the parameterizations pre-sented here. These authors found a annual and global mean BC burden of 0.11 Tg C. This is the same as the result of the COND-COAG simulation of this study.
Another frequently used emission inventory combines the open burning emissions from Liousse et al. (1996) and the fossil fuel burning emissions from Penner et al. (1993). This inventory is representative of the mid 1980’s, whereas the in-ventory used elsewhere in this study is representative of the latter 1990’s. The FIX-LIFE simulation has been repeated
with this inventory and is shown as FIX-LIFE2. The burdens, lifetimes and deposition rates are shown in Table 6. One must be cautious not to conclude that global BC emissions have decreased as significantly as shown in the Table 6. Ob-servations from the IMPROVE (Interagency Monitoring of Protected Visual Environments) dataset do show a downward trend in BC surface concentrations, but the significant differ-ence between these emission inventories may largely reflect uncertainties in the inventories themselves. A comparison of the geographic distribution of the BC burdens is shown in Fig. 8. Over much of Europe and Asia, BC burdens are higher by a factor of between 2 and 3 in the FIX-LIFE2 sim-ulation. The FIX-LIFE simulation does have higher BC bur-dens in the southern portion of Africa. The inventory used in FIX-LIFE had higher open burning emissions in this region. Also shown in Table 6 is a comparison with other studies. These results show that the global BC burden has a high sen-sitivity to the inventory used. Indeed, the burdens are roughly proportional to the emissions in the global and annual mean. Thus, a factor of two uncertainty in the emissions is expected to translate into a factor of two uncertainty in the predicted BC burdens.
Another issue to consider is the impact of model resolu-tion on the BC burdens, concentraresolu-tions, and lifetimes. To in-vestigate this further, the model was also run at a T63 resolu-tion. The global and annual BC burden was found to decrease by only about 3 percent when applying the BC emissions at
Fig. 9. Annual mean surface layer BC concentrations (µg/m3) from four of the simulations.
this resolution as compared to the T47 resolution used else-where in this study. The global and annual mean BC lifetime was found to be 4.8 days when applying the COND-COAG-OXID ageing parameterization at this higher resolution, as opposed to 4.9 days at T47 resolution. This gives confidence that the parameterization of the BC ageing is robust since very similar results are found at higher resolution model runs.
4 Comparison with surface layer observations
There is a limited availability of observations of monthly mean BC surface layer concentrations over the complete annual cycle. Figure 9 shows the modelled surface layer BC concentrations for the simulations NO-AGE, FIX-LIFE, OXID, and COND-COAG-OXID. Figure 10 shows a com-parison of observations with modelled results for four conti-nentally influenced sites. Figures 11 and 12 are similar but for seven remote sites. To summarize on a regional scale, the IMPROVE data was domain averaged over all sites par-ticipating in the IMPROVE project, and reporting BC con-centrations between June 1998 and June 2002, to obtain the monthly means. AGCM results are also domain averaged over the corresponding model grid boxes. Details regard-ing the other datasets can be found in the respective papers quoted with each figure. Note that all plots in this section show concentration on a logarithmic scale.
For the continentally influenced sites, there is a tendency for the model to under-estimate the observations. This is par-ticularly evident for the sites in Japan and Austria. Even the NO-AGE simulation is less than these observations. This is with the exception of the Austrian FIX-LIFE2 simulation, which uses the older emissions inventory that appears to per-form better. In part, the under-estimation problem may occur since these observations are taken closer to an urban plume, and are not representative of the mean of the GCM grid box. Otherwise, the NO-AGE simulation over-estimates the sur-face concentrations. This points to the importance of the ageing parameterization in AGCMs. For the remote sites, the over-estimation is greater, one or two orders of magni-tude. This is expected given the longer distance from the emission sources, and the greater time frame that ageing pro-cesses occurred.
The model results compare best with the observations for the IMPROVE domain, and the Alert site. Both datasets are means over a 3–4 year period and appropriate to the year of the emissions inventory. This improves the comparison. Additionally, the IMPROVE comparison has the benefit of a wider spatial coverage of observations, which will be more representative of the GCM grid box means. Particularly near the poles, natural variability can cause large differences be-tween years, and thus a dataset averaged over several years is desirable. Also, there is likely less inter-annual variability
2 4 6 8 10 12 10−2 10−1 100 101 102 Month Number ug EC/m3 IMPROVE Domain 2 4 6 8 10 12 10−2 10−1 100 101 102 ug EC/m3 Month Uji 2 4 6 8 10 12 10−2 10−1 100 101 102 ug EC/m3 Month Vienna & Streithofen
2 4 6 8 10 12 10−2 10−1 100 101 102 ug EC/m3 Month Mace Head OBS NA FL1 CCO OX FL2
Fig. 10. Continentally influenced monthly mean surface layer BC concentrations from U.S.A. IMPROVE domain average from 1998–
2002, Mace Head, Ireland (Cooke et al., 1997), Uji, Japan (H¨oller et al., 2002), and Vienna-Streithofen, Austria (Puxbaum et al., 2004). Observations are in red. For Uji, open circles are data prior to correction for small particle mass. Simulations shown are NO-AGE (NA), FIX-LIFE (FL1), COND-COAG-OXID (CCO), OXID (OX), FIX-LIFE2 (FL2). Legend shown applies to all plots.
in the North American fossil fuel dominated emissions com-pared to the Southern Hemisphere emissions, which are dom-inated by open burning. Additionally, several of the observa-tions are from the early and mid-1990s, such as for the Mace Head site, and this affects the comparison.
In many cases, the COND-COAG-OXID simulation gives BC concentrations slightly lower than the FIX-LIFE simula-tion, i.e. the ageing half life is predicted to be less than 24 h. The opposite is seen at the Antarctica site. Slower ageing is expected there since this region of the southern hemisphere has lower aerosol number concentrations, which slows the ageing process. The COND-COAG-OXID has the advantage over the FIX-LIFE simulation in that it captures these region-ally varying effects.
A statistical comparison can be made between the model simulations in order to help draw conclusions regarding the performance of these parameterizations. The annual mean model to observation ratio, and the correlation coefficient be-tween modelled and observed surface layer monthly mean BC concentrations are shown in Table 7. The COND-COAG simulation is shown to perform best both in terms of
captur-ing the seasonal cycle and in predictcaptur-ing the magnitude of the BC concentrations. While the improvement over the FIX-LIFE simulation is not as large as one might like to see, this crude physically based parameterization does show a prelim-inary improvement. In future work, this parameterization may be refined by linking the ageing time-scale more pre-cisely to the rate of sulphate production and uptake of soluble mass on the BC aerosol. This will be possible as further lab-oratory and field studies are conducted to better investigate these physical and chemical processes. The approach shown in Kanakidou et al. (2005) that links the ageing time-scale to the rate of sulphate production, relative size of the aerosols, mass of insoluble aerosol, and number concentration is the accumulation mode shows promise. However, there is need to better validate the parameters used in the equations, and extend the approach to include the heterogenous and aque-ous phase reactions that may be of importance (i.e. chemical ageing).
Table 7 shows that the simulation OXID gave the greatest over-estimation of the concentrations in comparison to obser-vations. This result is highly dependent on the tunable factor
2 4 6 8 10 12 100 101 102 103 104 ng EC/m3 Month Alert 2 4 6 8 10 12 10−1 100 101 102 103 ng EC/m3 Month Amsterdam Island 2 4 6 8 10 12 10−1 100 101 102 103 ng EC/m3 Month Halley 2 4 6 8 10 12 10−1 100 101 102 103 ng EC/m3 Month Mauna Loa OBS NA FL1 CCO OX FL2
Fig. 11. Remote site monthly mean surface layer BC concentrations at Alert averaged over period 1999–2001 (Sharma et al., 2004), Mauna
Loa (Bodhaine, 1995), Amsterdam Island (Wolff and Cachier, 1998), and Halley (Wolff and Cachier, 1998). Observations are in red. Simulations shown are NO-AGE (NA), FIX-LIFE (FL1), COND-COAG-OXID (CCO), OXID (OX), FIX-LIFE2 (FL2). Legend shown applies to all plots.
of 0.01 that was used. The tuning factor can be increased to give a model to observation ratio quite close to unity. How-ever, this was not done since there is no evidence available yet to suggest that ageing due to oxidation should be a more dominant process on a global scale than coagulation and con-densation. Further, a greater global coverage of observations is needed before there can be any reasonable level of cer-tainty about the value of this tuning factor used in the OXID and COND-COAG-OXID simulations. Thus, there remains a very high level of uncertainty pertaining to the oxidation parameterization.
In considering the collective of the 11 observation sites in the annual mean, the model does estimate the BC concentra-tions within a factor of two of the observaconcentra-tions. However, in a more specific regional, and month to month comparison some of the simulations do predict closer to within a factor of ten. The comparison is generally poorer at the remote sites. This reflects both the uncertainty in the transport processes, combined with the longer time that errors in the ageing and removal processes have had to compound. Additionally, at the majority of the sites, the FIX-LIFE2 simulation, which
Table 7. Ratio of monthly mean modelled to observed surface
layer BC concentrations, and correlation between monthly mean observed and predicted concentrations. Results shown are the mean over the 11 surface comparison sites for the simulations NO-AGE, FIX-LIFE, OXID, COND-COAG, and COND-COAG-OXID.
Ratio Correlation NO-AGE 77.6 0.50 FIX-LIFE 1.96 0.80 COND-COAG 1.73 0.82 OXID 2.39 0.82 COND-COAG-OXID 1.75 0.82
uses an older emissions inventory, is often the farthest from the observations.
Open burning is known to contribute significantly to global BC emissions and burdens. However, there is a scarcity of observations of BC concentrations from the open burning re-gions of Africa and South America over the complete annual
2 4 6 8 10 12 10−1 100 101 102 103 ng EC/m3 Month Barrow 2 4 6 8 10 12 10−1 100 101 102 103 ng EC/m3 Month Cape Grim 2 4 6 8 10 12 10−1 100 101 102 103 ng EC/m3 Month South Pole OBS NA FL1 CCO OX FL2
Fig. 12. Remote site monthly mean surface layer BC concentrations at Barrow (Bodhaine, 1995), Cape Grim (Heintzenberg and Bigg, 1990)
and Amundsen-Scott, South Pole (Bodhaine, 1995). Observations are in red. Simulations shown are NO-AGE (NA), FIX-LIFE (FL1), COND-COAG-OXID (CCO), OXID (OX), FIX-LIFE2 (FL2). Legend shown applies to all plots.
Table 8. Comparison of surface layer BC concentrations (ng/m3) from regions dominated by open burning regions with three model simulations FIX-LIFE (FL), COND-COAG-OXID (CCO), and FIX-LIFE2 (FL2). The FL and CCO simulations use the combined Bond et al. (2004) and van der Werf et al. (2003) emission inventories. The FL2 simulation uses the combined Liousse et al. (1996) and Penner et al. (1993) emission inventories.
Lon Lat Date Observed FL CCO FL2 Reference
Central Africa 17–19 E 2–12 N Nov/Dec 3363 1047.2 923.8 1586.5 Ruellan et al. (1999)
Ivory Coast 5.1 W 6.2 N Annual 1300 541.5 475.6 2241.2 Wolff and Cachier (1998)
South America 79.7 W 2.25 S June 520 122.2 106.1 813.7 Andreae et al. (1984)
cycle. Open burning does have a strong seasonal cycle as is shown in Fig. 13. Given the importance of these regions, a preliminary comparison was made with available obser-vations. This comparison is shown in Table 8. The model tends to under-estimate the concentrations for the majority of the comparisons. The FIX-LIFE2 simulation gives con-centrations within a factor of 2 of the observations. The
FIX-LIFE and COND-COAG-OXID simulations give concentra-tions that are within a factor of 3 to 4 of the observaconcentra-tions, with a more consistent tendency to under-estimate the ob-servations than the FIX-LIFE2 simulation. Given the signif-icance of open burning emissions, and the high spatial and temporal variation of these emissions, as shown in Fig. 13, new satellite retrievals should be of great help in validating
Fig. 13. Seasonal cycle of BC burdens (mg C/m2) from the COND-COAG-OXID simulation.
the predicted BC concentrations in the coming years. In summary, one must exercise caution in drawing clusions related to comparisons of AGCM surface layer con-centrations with observations. Factors to consider include, 1) how representative are the observations, taken at one site, of the grid box mean, 2) is there significant variability in the concentrations on an inter-annual basis that sensitizes the comparison to the year of the emissions scenario used by the model, and 3) may the uncertainty in the emission scenario used vary considerably on a regional basis. The best match of comparison conditions are likely for the IMPROVE do-main and at Alert. Results here demonstrate that the ageing parameterizations work well as opposed to the assumption of no ageing.
5 Conclusions
Four separate parameterizations of the BC ageing process, suitable for use in a AGCM, have been examined in this study. The assumption of no ageing was shown to be clearly unphysical, and significantly over-estimated the observed BC surface layer concentrations. This occurred since a high percentage of the total BC mass remained in the insolu-ble fraction. Thus, there was less efficient removal by wet deposition, which was shown to account for roughly 75% of the total deposition. A parameterization developed by
Riemer et al. (2004a) to represent BC ageing by condensa-tion and coagulacondensa-tion processes was tested for the first time in an AGCM. This parameterization represented the BC ageing process reasonably on a global basis, despite being designed in a domain dominated by fossil fuel burning. Results from this simulation suggested that the global and annual mean half-life for the conversion of insoluble BC to soluble BC is less than the 24 h. For the first time, a parameterization that included the processes of condensation, coagulation, and ox-idation was developed and used in an AGCM. The contri-bution of oxidation to the BC ageing process was modelled to be small. However, there remains a very high level of un-certainty associated with the oxidative parameterization. The contribution of oxidation to BC ageing on a global is simply not conclusively known as yet. On a global scale, conden-sation and coagulation contribute significantly to BC ageing. The assumption of an exponential decay of insoluble BC to the soluble/mixed state with a fixed 24 h half life was also shown to represent BC burdens reasonably. However, this approach has the disadvantage in that it is not responsive to varying regional conditions. BC burdens were 2.15, 0.15, 0.11, 0.21, and 0.11 Tg C, for the simulations, assuming 1) no ageing, 2) a fixed half life of 24 h, 3) ageing by condensa-tion and coagulacondensa-tion, 4) ageing by oxidacondensa-tion with ozone, and 5) ageing by condensation, coagulation, and oxidation com-bined, respectively. For the same simulations respectively,
BC lifetimes were 98.1, 6.6, 5.0, 9.5, and 4.9 days.
The sensitivity of the modelled BC burdens and concen-trations to the factor of two uncertainty in the emissions in-ventories was shown to be greater than the sensitivity to the parameterization used to represent BC ageing, except for the oxidation based parameterization. This highlights the impor-tance of work to reduce the uncertainties in BC emission in-ventories, and to better understand the processes of chemical ageing. Future changes in atmospheric composition will lead to changes in the BC ageing time-scale. A physically and chemically based BC ageing treatment will allow the AGCM to better respond to these changes in oxidants and pollutants, as opposed to the use of a fixed e-folding time.
In terms of future research directions, more spatially ex-tensive observations of BC burdens, seasonal fluctuations, and deposition rates are needed, both to validate modelling efforts, and to more clearly define the atmospheric abundance of this important aerosol. Further experiments are needed to better understand the mechanisms by which the processes of oxidation, coagulation, and condensation (not only of inor-ganic acids but also of semi-volatile orinor-ganic gases) interact and convert insoluble BC particles into particles can act as cloud condensation or ice nuclei. Ultimately, this will help to resolve one of the major uncertainties in climate modelling and research, the role of cloud-aerosol interactions.
Acknowledgements. The authors wish to acknowledge the Meteo-rological Service of Canada that generously provided the valuable computer time required by this project. The authors thank Nicole Riemer for helpful discussions. This work was supported by the National Science and Engineering Research Council of Canada, and the Canadian Foundation for Climate and Atmospheric Science collaborative research grants.
Edited by: U. P¨oschl
References
Abel, S. J., Haywood, J. M., Highwood, E. J., Li, J., and Buseck, P. R.: Evolution of biomass burning aerosol properties from an agricultural fire in southern Africa, Geophys. Res. Lett., 30, doi:10.1029/2003GL017 342, 2003.
Binkowski, F. S. and Shankar, U.: The regional particulate matter model, 1. Model description and preliminary results, J. Geophys. Res., 100, 26 191–26 209, 1995.
Bodhaine, B. A.: Aerosol absorption measurements at Barrow, Mauna Loa and the South-Pole, J. Geophys. Res., 100, 8967– 8975, 1995.
Boer, G. J.: Analyzed and forecast large-scale tropical divergent flow, Mon. Wea. Rev., 123, 3539–3553, 1995.
Bond, T. C., Streets, D. G., Yarber, K. F., Nelson, S. M., Woo, J.-H., and Klimont, Z.: A technology-based global inventory of black and organic carbon emissions from combustion, J. Geo-phys. Res., 109, D14 203, doi:10.1029/2003JDO03 697, 2004. Chung, S. H. and Seinfeld, J. H.: Global distribution and climate
forcing of carbonaceous aerosols, J. Geophys. Res., 107, D19 407, doi:10.1029/2001JD001 397, 2002.
Chylek, P., Kou, L., Johnson, B., Boudala, F., and G.Lesins: Black carbon concentrations in precipitation and near surface air in and near Halifax, Nova Scotia, Atmos. Environ., 33, 2269–2277, 1999.
Cooke, W. F., Jennings, S. G., and Spain, T. G.: Black carbon mea-surements at Mace Head, 1989–1996, J. Geophys. Res., 102, 25 339–25 346, 1997.
Cooke, W. F., Liousse, C., Cachier, H., and Feichter, J.: Con-struction of a 1×1 fossil fuel emission data set for carbona-ceous aerosol and implementation and radiative impact in the ECHAM4 model, J. Geophys. Res., 104, 22 137–22 162, 1999. Cooke, W. F., Ramaswamy, V., and Kasibhatla, P.: A general
circu-lation model study of the global carbonaceous aerosol distribu-tion, J. Geophys. Res., 107, doi:10.1029/2001JD001 274, 2002. Decesari, S., Facchini, M. C., Matta, E., Mircea, M., Fuzzi, S.,
Chughtai, A. R., and Smith, D. M.: Water soluble organic com-pounds formed by oxidation of soot, Atmos. Environ., 36, 1827– 1832, 2002.
Feichter, J., Kjellstr¨om, E., Rodhe, H., Dentener, F., Lelieveld, J., and Roelofs, G.-J.: Simulation of the tropospheric sulfur cycle in a global climate model, Atmos. Environ., 30, 1693–1707, 1996. Haywood, J. and Boucher, O.: Estimates of the direct and indirect
radiative forcing due to tropospheric aerosols: A review, J. Geo-phys. Res., 38, doi:10.1029/1999RG000 078, 2000.
Heintzenberg, J. and Bigg, E. K.: Tropospheric transport of trace substances in the Southern Hemisphere, Tellus, 42B, 355–363, 1990.
Hess, M., Koepke, P., and Schult, I.: Optical properties of aerosols and clouds: The software package OPAC, Bull. Am. Meterol. Soc., 79, 831–844, 1998.
Hitzenberger, R., Berner, A., Giebl, H., Drobesch, K., Kasper-Giebl, A., Loeflund, M., Urban, H., and Puxbaum, H.: Black carbon (BC) in alpine aerosols and cloud water - concentrations and scavenging efficiencies, Atmos. Environ., 35, 5135–5141, 2001.
Hobbs, P. V., Sinha, P., Yokelson, R. J., Christian, T. J., Blake, D. R., Gao, S., Kirchstetter, T. W., Novakov, T., and Pilewskie, P.: Evo-lution of gases and particles from a savanna fire in South Africa, J. Geophys. Res., 108, doi:10.1029/2003GL017 342, 2003. H¨oller, R., Tohno, S., Kasahara, M., and Hitzenberger, R.:
Long-term characterization of carbonaceous aerosol in Uji, Japan, At-mos. Environ., 36, 1267–1275, 2002.
Kanakidou, M., Seinfeld, J. H., Pandis, S. N., Barnes, I., Dentener, F. J., Facchini, M. C., Dingenen, R. V., Ervens, B., Nenes, A., Nielsen, C. J., Swietlicki, E., Putaud, J. P., Balkanski, Y., Fuzzi, S., Horth, J., Moortgat, G. K., Winterhalter, R., Myhre, C. E. L., Tsigaridis, K., Vignato, E., Stephanou, E. G., and Wilson, J.: Organic aerosol and global climate modelling: A review, Atmos. Chem. Phys., 5, 1053–1123, 2005,
SRef-ID: 1680-7324/acp/2005-5-1053.
Koch, D.: Transport and direct radiative forcing of carbonaceous and sulfate aerosols in the GISS GCM, J. Geophys. Res., 106, 20 311–20 332, 2001.
Liousse, C., Penner, J. E., Chung, C., Walton, J. J., Eddleman, H., and Cachier, H.: A global three-dimensional model study of car-bonaceous aerosols, J. Geophys. Res., 101, 19 411–19 432, 1996. Lohmann, U.: A glaciation indirect effect caused by soot aerosols,
Lohmann, U. and Feichter, J.: Impact of sulfate aerosols on albedo and lifetime of clouds: A sensitivity study with the ECHAM4 GCM, J. Geophys. Res, 102, 13 685–13 700, 1997.
Lohmann, U. and Feichter, J.: Global indirect aerosol effects: a review, Atmos. Chem. Phys., 5, 715–737, 2005,
SRef-ID: 1680-7324/acp/2005-5-715.
Lohmann, U., Feichter, J., Chuang, C. C., and Penner, J. E.: Pre-diction of the number of cloud droplets in the ECHAM GCM, J. Geophys. Res., 104, 9169–9198, 1999.
Lord, S. J.: Interaction of a cumulus cloud ensemble with large-scale environment, part III; Semi-prognostic test of the Arakawa-Schubert cumulus parameterization, J. Atmos. Sci., 39, 88–103, 1982.
Merryfield, W. J. and Holloway, G.: Application of an accurate ad-vection algorithm to sea-ice modelling, Ocean Modelling, 5, 1– 15, 2003.
Peng, Y., Lohmann, U., Leaitch, R., Banic, C., and Couture, M.: The cloud albedo-cloud droplet effective radius relationship for clean and polluted clouds from RACE and FIRE.ACE, J. Geo-phys. Res., 107, doi:10.1029/2000JD000 281, 2002.
Penner, J. E., Eddleman, H., and Novakov, T.: Towards the devel-opment of a global inventory for black carbon emissions, Atmos. Environ., 27A, 1277–1295, 1993.
P¨oschl, U., Letzel, T., Schauer, C., and Niessner, R.: Interac-tion of ozone and water vapor with spark discharge soot aerosol particles coated with benzo[a]pyrene: O3and H2O adsorption, benzo[a]pyrene degradation, and atmospheric implications, J. Phys. Chem., 105, 4029–4041, 2001.
Puxbaum, H., Gomiscek, B., Kalina, M., Salam, A., Stopper, S., Preining, O., and Hauck, H.: A dual study PM2.5 and PM10
aerosol chemistry in the larger region of Vienna, Austria, Atmos. Environ., 38, 3949–3958, 2004.
Reader, M. C., Fung, I., and McFarlane, N.: The mineral dust aerosol cycle during the Last Glacial Maximum, J. Geophys. Res., 104 D8, 9381–9398, 1999.
Riemer, N., Vogel, H., and Vogel, B.: A parameterisation of the soot aging for global climate models, Atmos. Chem. Phys. Discuss., 4, 2089–2115, 2004a.
Riemer, N., Vogel, H., and Vogel, B.: Soot aging time scales in polluted regions during day and night, Atmos. Chem. Phys., 4, 1885–1893, 2004b,
SRef-ID: 1680-7324/acp/2004-4-1885.
Saathoff, H., Naumann, K.-H., Schaiter, M., Schock, W., Mohler, O., Schurath, U., Weingartner, E., Gysel, M., and Baltensperger, U.: Coating of soot and (NH4)2SO4particles by ozonlysis
prod-ucts of α-pinene, J. Aerosol. Sci., 34, 1297–1321, 2003. Sharma, S., Lavoue, D., Cachier, H., Barrie, L., and Gong,
S. L.: Long-term trends of the black carbon concentrations in the Canadian arctic, J. Geophys. Res., 109, D15 203, doi:10.1029/2003JD004 331, 2004.
Stier, P., Feichter, J., Kloster, S., Vignati, E., Wilson, J., Ganzeveld, L., Tegen, I., Werner, M., Balkanski, Y., Schult, M., and Boucher, O.: The aerosol-climate model ECHAM5-HAM, Atmos. Chem. Phys., 5, 1125–1156, 2005,
SRef-ID: 1680-7324/acp/2005-5-1125.
Tsigaridis, K. and Kanakidou, M.: Global modelling of secondary organic aerosol in the troposphere: A sensitivity analysis, Atmos. Chem. Phys., 3, 1849–1869, 2003,
SRef-ID: 1680-7324/acp/2003-3-1849.
van der Werf, G. R., Randerson, J. T., Collatz, G. J., and Giglio, L.: Carbon emissions from fires in tropical and subtropical ecosys-tems, Global Change Biology, 9, 547–562, 2003.
von Salzen, K., Leighton, H. G., Ariya, P. A., Barrie, L. A., Gong, S. L., Blanchet, J.-P., Spacek, L., Lohmann, U., and Kleinman, L. I.: Sensitivity of sulfate aerosol size distributions and CCN concentrations over North America to SOxemissions and H2O2
concentrations, J. Geophys. Res., 105, 9741–9765, 2000. Wolff, E. W. and Cachier, H.: Concentrations and seasonal cycle of
black carbon in aerosol at a coastal Antarctic station, J. Geophys. Res., 103, 11 033–11 041, 1998.
Zuberi, B., Johnson, K. S., Aleks, G. K., Molina, L. T., and Molina, M. J.: Hydrophylic properties of aged soot, Geophys. Res. Lett., 32, L01 807, doi:10.1029/2004GL021 496, 2005.