HAL Id: inserm-01165024
https://www.hal.inserm.fr/inserm-01165024
Submitted on 18 Jun 2015HAL is a multi-disciplinary open access archive for the deposit and dissemination of sci-entific research documents, whether they are pub-lished or not. The documents may come from teaching and research institutions in France or abroad, or from public or private research centers.
L’archive ouverte pluridisciplinaire HAL, est destinée au dépôt et à la diffusion de documents scientifiques de niveau recherche, publiés ou non, émanant des établissements d’enseignement et de recherche français ou étrangers, des laboratoires publics ou privés.
Hypertension and lower walking speed in the elderly:
the Three-City study.
Julien Dumurgier, Alexis Elbaz, Carole Dufouil, Béatrice Tavernier,
Christophe Tzourio
To cite this version:
Julien Dumurgier, Alexis Elbaz, Carole Dufouil, Béatrice Tavernier, Christophe Tzourio. Hypertension and lower walking speed in the elderly: the Three-City study.. Journal of Hypertension, Lippincott, Williams & Wilkins, 2010, 28 (7), pp.1506-14. �10.1097/HJH.0b013e328338bbec�. �inserm-01165024�
Hypertension and Lower Walking Speed in the Elderly: the Three-City Study
Julien Dumurgiera,b, Alexis Elbaza,b, Carole Dufouila,b, Béatrice Tavernierc, Christophe
Tzourioa,b
Short title: Hypertension and lower walking speed
a
INSERM, U708, F-75013, Paris, France
b
UPMC Univ Paris 06, UMR_S 708, F-75005, Paris, France
c
CHU de Dijon, Department of Geriatrics, F-21000, Dijon, France
There are no conflicts of interest.
Correspondence to Julien Dumurgier, MD, MsC, INSERM Unité 708, Hôpital de la
Salpêtrière, 47 Bvd de l'Hôpital, 75651 Paris Cedex 13, France. E-mail:
[email protected]. Tel: +33 1 42 16 25 61; Fax: +33 1 42 16 25 41
Objective The brain is one of the main targets of hypertension. However, little is
known about the relation between hypertension and motor performances. We studied
the association between hypertension and walking speed in a cohort of elderly
people.
Methods Analyses are based on participants (65-85 years) from the Dijon (France)
center of the Three-City study (n=3604), followed every two years. Persistent
hypertension was defined by the use of antihypertensive drugs at baseline or at first
follow-up, or by high blood pressure (≥140/90 mmHg) at baseline and first follow-up. Walking speed was measured over 6 meters, at baseline and fourth follow-up
(n=1774) after a mean (SD) duration of 7.0 (0.5) years. Brain MRI was performed in
1590 participants. Generalized linear models were used to assess the relation
between hypertension and baseline walking speed or walking speed change.
Results At baseline, mean (SD) walking speed (m/s) was lower in hypertensive
subjects (1.51 [0.31]) than in non-hypertensive subjects (1.59 [0.30], P<0.001).
During follow-up, hypertensive subjects had a higher mean annual decline in walking
speed (cm/s per year; 2.30 [3.4]) than non hypertensive subjects (1.87 [3.3],
P=0.004). The number of antihypertensive drugs was associated with lower walking
speed at baseline and higher walking speed decline. Adjustment for MRI white matter
abnormalities attenuated these relations.
Conclusion Persistent hypertension was associated with both lower walking speed
and higher decline in walking speed in the elderly. These results may be partly
explained by white matter abnormalities, and support the hypothesis of a contribution
Condensed abstract
Little is known about the relationship between hypertension and motor performances
in the elderly. We studied the association between hypertension and walking speed
in a large cohort of well-functioning French elderly subjects (n=3604). Hypertensive
subjects had a lower walking speed at baseline, and a higher decline of walking
speed over a mean follow-up of 7 years. These results may be partly explained by
white matter abnormalities, and support the hypothesis of a contribution of vascular
risk factors to motor dysfunction in the elderly.
Key words: hypertension, gait, aging, epidemiology, cerebrovascular disorders
Abbreviations: 3C, Three-City Study; BMI, body mass index; BP, blood pressure;
MMSE, Mini-Mental State Examination; NSAID, non-steroidal anti-inflammatory drug;
Introduction
The etiology of gait disorders and decreased motor performances in the elderly is
likely to be multifactorial [1], and recent evidence points to the role of vascular risk
factors such as diabetes mellitus [2], increased homocysteine [3], or low HDL
cholesterol [4]. Hypertension is highly prevalent among the elderly [5], and is a major
risk factor for cerebrovascular disease, including clinical stroke and subclinical
cerebral white matter lesions [6]. While some studies have shown that hypertension
is a risk factor for cognitive decline and dementia [7, 8], little is known about its
relation with motor function in the elderly.
Walking speed is a simple and reliable measure that is considered as a surrogate for
overall quality of gait and motor function [9], and provides similar information as does
a more comprehensive summary measure of physical performance [10]. Decreased
walking speed has been shown to be strongly associated with adverse health-related
events such as falls [11], disability [12], hospitalization [13], and death [10].
The aim of this study was therefore to investigate the cross-sectional and longitudinal
association between hypertension and walking speed in a sample of
community-dwelling nondisabled elderly subjects, as part of the Three-City (3C) study.
Methods
Study Population
The 3C study is a prospective cohort of community-dwelling persons aged 65 years
and over living in three French cities (Bordeaux, Dijon, and Montpellier). The study
design has been described elsewhere [14]. A specific sub-study on motor function
(1999-2000) in subjects aged 85 years old or younger. At baseline, 3604 participants
were included for cross-sectional analyses, after exclusion of those with conditions
that strongly affected motor function (dementia, disabling stroke, hip fracture,
Parkinson’s disease). Following the baseline examination, participants were seen at
4 follow-up surveys. The first, second, and fourth follow-up examinations took place
over periods of 2 years. They consisted in at home interviews followed by an
examination at the study center. The third follow-up consisted in self-administered
questionnaire mailed at home, and data collection took place during one year. After
the baseline measure of walking speed, it was measured again at the fourth
follow-up, after a mean (SD) duration of 7.0 (0.5) years. A total of 1774 subjects were
included for longitudinal analyses, after exclusion of subjects with incident diseases
affecting motor function (dementia, disabling stroke, hip fracture, Parkinson’s
disease) and those with missing values for a walking speed measure at the fourth
follow-up. The flow-chart of participants enrolled in the analyses is presented in
Figure 1.
The study protocol was approved by the Ethical Committee of the University- Hospital
of Bicêtre (France) and written informed consent was obtained from each participant.
Data Collection
Baseline demographic and medical data were collected at home during face-to-face
interviews using a standardized questionnaire administered by trained psychologists.
Education level was defined as no school or primary without diploma, primary with
diploma, secondary without a baccalaureate degree, baccalaureate or university
degree. Weight and height were measured and used to calculate body mass index
athletic activities; low physical activity level was considered for subjects who
answered “very little or none” for the daily duration of walking and had no athletic
activity. The interview also included an inventory of all drugs prescribed during the
preceding month. The name of the medication was recorded, and all drugs were
subsequently coded according to the French translation of the WHO ATC
classification [15]. Chronic consumption of non-steroidal anti-inflammatory drugs
(NSAIDs) for joint pain was assessed and used as surrogate for rheumatic disease.
Depressive symptoms were assessed using the Center for Epidemiologic Studies
Depression Scale (CES-D) [16]. Global cognitive function was assessed by the
Mini-Mental State Examination (MMSE) [17]. Subjects were considered as diabetic if they
used antidiabetic agents or if their fasting glucose level was equal to or greater than
7.0 mmol/L. Hypercholesterolemia was defined as total cholesterol ≥ 7.25 mmol/L or by use of lipid-lowering drugs. Smoking status was classified as current, past, or
never. History of coronary heart disease and peripheral artery disease was assessed
by questionnaire. Exertional dyspnea was self-declared using the New York Heart
Association classification [18].
Definition of Hypertension
At each examination, blood pressure (BP) was measured twice at home by the
interviewers after at least 5 minutes of rest in a seated position, with an appropriately
sized cuff placed on the right arm and using a validated digital electronic tensiometer
(OMRON M4). The mean of both measures was used in the analyses. Use of
antihypertensive drugs was determined according to the number and the type of
antihypertensive drugs taken to lower blood pressure: diuretics, beta-blockers,
angiotensin converting enzyme inhibitors, calcium channel blockers, and others (ATC
Participants were considered as having persistent hypertension if they were treated
by antihypertensive drugs for hypertension at baseline or at first follow-up, or if they
had high blood pressure (systolic BP ≥ 140 mmHg or diastolic BP ≥ 90 mmHg) at baseline and at first follow-up. This definition of persistent hypertension was therefore
based on two measures taken at two different time-points (baseline and first follow-up
examinations; mean [SD] delay between the two measures = 1.8 [0.17] years) in
order to reduce the risk of misclassifying hypertensive status [19, 20].
Walking Speed Assessment
At baseline, following the home interview, participants aged 85 years old or younger
were invited to the study center where walking speed was measured. Two
photoelectric cells connected to a chronometer were placed in a corridor 6 meters
apart. Participants were asked to walk in the corridor at their maximum speed. The
time needed to cover 6 meters was measured by the photoelectric cells, and walking
speed was computed as 6 meters divided by time in seconds.
To assess the reproducibility of this measure, we performed a test-retest study in 51
subjects (mean [SD] age = 71.1[3.4] years). Two measures of maximum walking speed were taken five minutes apart. The intraclass correlation coefficient (SE) was 0.92 (0.02), thus showing high reproducibility, as in previous studies.[21]
Walking speed was measured again using the same protocol at the fourth follow-up,
in subjects aged 85 years old or younger at that time who agreed to come to the
defined as the baseline walking speed measurement minus the follow-up walking
speed measurement, divided by the duration between the two measurements.
Brain MRI
Brain MRI was proposed to all participants aged ≤ 80 years enrolled between June 1999 and September 2000 (N=2673); 2285 subjects (82%) accepted but only 1924
scans were performed because of financial limitations. Exclusion criteria for MRI
were cardiac pace-maker, valvular prosthesis, or other internal electrical/mag-
netic devices; history of neurosurgery/aneurysm; claustrophobia; and presence of
metal fragments. The detailed MRI protocol has been previously described [22, 23].
MRI acquisition was performed on a 1.5T Magnetom (Siemens, Erlangen, Germany).
Fully automated image processing software was developed to measure white matter
lesions (WML) volume [23]. The presence of lacunar infarcts was assessed visually
by a neurologist using a standardized assessment grid.
Statistical Analysis
Baseline characteristics of the study population are presented overall and according
to tertiles of walking speed and to hypertensive status, and were compared using the
chi-square statistic for categorical variables or the Student t-test for continuous
variables.
Generalized linear models were used to study the relation between walking speed
(considered as the dependent variable) and hypertensive status. In a first model, in
addition to hypertension, three covariates strongly associated with walking speed and
hypertension (age, sex, BMI) were included. In a second model, we included
univariate analyses (education level, MMSE, physical activity, hypercholesterolemia,
smoking, NSAIDs use). In a third model, we included variables associated with either
hypertension or walking speed. In a fourth and final model, we adjusted for potential
mediators: history of coronary heart disease or peripheral artery disease, and
exertional dyspnea.
For longitudinal analyses, the characteristics of the study sample are presented
overall and according to tertiles of annual walking speed change, and were
compared using the chi-square statistic for categorical variables or the Student t-test
for continuous variables. Generalized linear models were used to study the relation
between annual walking speed decline (considered as the dependent variable) and
hypertension. In a first model, in addition to hypertension, age, sex, baseline walking
speed, and BMI were included. In a second model, we included additional covariates
associated both with walking speed decline and hypertension (education level,
hypercholesterolemia, smoking, physical activity level, diabetes mellitus, psychotropic
drug use). In a final model, we included history of coronary heart disease and
peripheral artery disease, as well as exertional dyspnea as covariates.
We studied the relation between the number of different antihypertensive drugs used
at the same time and baseline walking speed or annual walking speed decline; we
considered that a higher number of antihypertensive drugs represents a surrogate
marker for the severity of hypertension [24, 25].
Because of a large difference in walking speed in men and women, all analyses were
To investigate differences in walking speed across the main categories of
antihypertensive drugs, we restricted the analyses to subjects treated for
hypertension with a monotherapy and we defined the following 4-level categorical
variable: users of diuretics, beta-blockers, angiotensin converting enzyme inhibitors,
calcium channel blockers; mean walking speed was compared across the levels of
this variable using the Tukey-Kramer method to adjust for multiple comparisons.
We performed sensitivity analyses. As beta-blockers can induce fatigue or dyspnea
during physical exercise [26], we excluded participants using beta-blockers, to
investigate whether the relations observed were explained by this category of drugs.
We also used multiple imputation procedures to impute missing values of walking
speed at the fourth follow-up using a general linear regression model (10
imputations) including baseline predictors (age, gender, BMI, walking speed,
hypertensive status) and the delay between baseline and follow-up examinations
(SAS Proc MI). Imputed data sets were analyzed as complete data and the 10 sets of
results were pooled using SAS Proc MIANALYZE.
Finally, to investigate whether MRI abnormalities related to hypertension (WML
volume, lacunar infarcts) explained the association between hypertension and
walking speed, we repeated our cross-sectional and longitudinal analyses among
subjects who performed a brain MRI at baseline. In a first model we adjusted for age,
sex, and BMI. In a second model, we added WML volume and presence of lacunar
All P values were two-tailed; P ≤ 0.05 was considered to be statistically significant. Statistical analyses were performed using SAS version 9.1 (SAS Institute, Cary, NC,
USA).
Results
Baseline characteristics of the study population (N=3604) are presented in Table 1.
The mean (SD) age of the participants was 73.4 (4.6) years, 61.9% of them were
women, and 71.4% had persistent hypertension. Subjects who walked slower were
older, heavier, more often women, and were more likely to have depressive
symptoms and exertional dyspnea than those who walked faster. They also had a
lower educational, MMSE, and physical activity level, were more often treated for
hypercholesterolemia, and used more frequently NSAIDs and psychotropic drugs.
These associations remained significant after adjustment for age and sex. Subjects
who walked faster were more often ever-smokers and current alcohol drinkers than
those who walked slower; however, this relation was explained by a strong
confounding effect of sex and age, and it was no longer significant after adjustment
for these two variables (smoking, p=0.88; alcohol, p=0.14). Hypertension was
associated with older age, male sex, higher BMI, lower education, MMSE, and
physical activity level, and other vascular risk factors (diabetes,
hypercholesterolemia, smoking), exertional dyspnea, and history of coronary and
peripheral artery disease (Table 1); these associations remained significant after
adjustment for age and sex, except for peripheral artery disease (p=0.11) and
smoking (p=0.46).
The cross-sectional relation between hypertension and walking speed at baseline is
[0.31] m/s) than non-hypertensive subjects (1.59 [0.30]). This difference was
significant after adjustment for age, sex, and BMI (model 1, P value <0.001). There
was a progressive decrease in mean walking speed with an increasing number of
antihypertensive drugs used (p for trend <0.001). Further adjustment for potential
confounders (models 2 and 3) or mediators (model 4) yielded similar findings. This
relation was present and of the same magnitude in men and women (Table 2).
Among subjects treated for hypertension with a monotherapy, there were no
significant differences in baseline walking speed across the main types of
antihypertensive drugs (p-values ranging from 0.11 to 0.99 after adjustment for age,
sex, and BMI).
Among the 2755 subjects eligible for a walking speed assessment at the fourth
follow-up, a second measure was not available for 981 subjects (Figure 1). They
walked slower and were older, heavier, more often women, and more likely to have
hypertension, depressive symptoms, diabetes mellitus, and a low physical activity
level at baseline than subjects with a second walking speed measure. Table 3
presents the baseline characteristics of the participants included in longitudinal
analyses (N=1774). A higher annual decline in walking speed was associated with
older age, male sex, higher BMI, higher baseline walking speed, lower education and
physical activity level, smoking, use of psychotropic drugs, diabetes mellitus,
coronary disease, and exertional dyspnea.
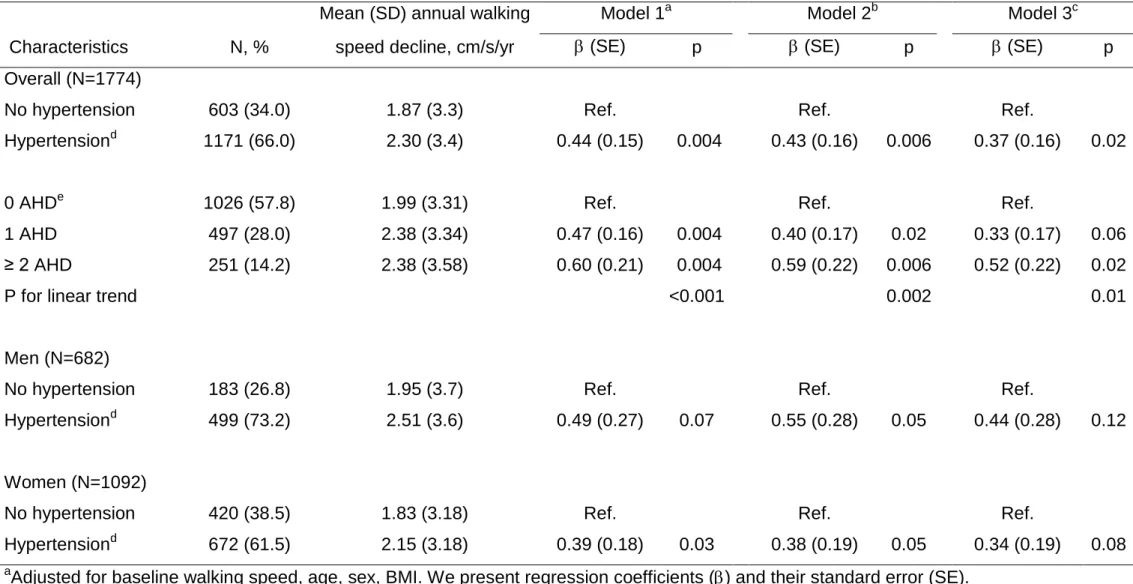
Analyses of the relation between hypertension and annual walking speed decline are
presented in Table 4. After adjustment for baseline walking speed, age, sex, and BMI
(model 1), subjects with hypertension had a higher mean annual decline in walking
p=0.004). An increasing number of antihypertensive drugs was also associated with
a higher annual rate of walking speed decline (model 1, p for linear trend <0.001).
Further adjustment for potential confounders (model 2) or mediators (model 3)
yielded similar results. This association was not modified by gender (interaction
p-values ranging from 0.87 to 0.93). Among subjects treated for hypertension with a
monotherapy, there were no significant differences in annual decline in walking
speed across the main types of antihypertensive drugs (p-values ranging from 0.40 to
0.99 after adjustment for age, sex, BMI, and baseline walking speed).
In sensitivity analyses, we excluded beta-blocker users from the analyses
(cross-sectional analysis, N=717; longitudinal analysis, N=300). At baseline, after
adjustment for age, sex and BMI, hypertension was still associated with lower walking speed (model 1, β [SE] = -0.033 [0.011], p=0.002). After adjustment for baseline walking speed, age, sex and BMI, hypertension was still associated with a higher annual decline in walking speed (model 1, β [SE] = 0.42 [0.16], p=0.009).
In longitudinal analyses including multiple imputation of missing values of walking
speed at the fourth follow-up in 981 participants, we found that, after adjustment for
baseline walking speed, age, sex, and BMI, hypertension was still associated with higher annual decline in walking speed (model 1, β [SE] = 0.31 [0.14], p=0.03). Additional adjustment for potential confounders or mediators did not modify these relations (model 3, β [SE] = 0.28 (0.14), p=0.04).
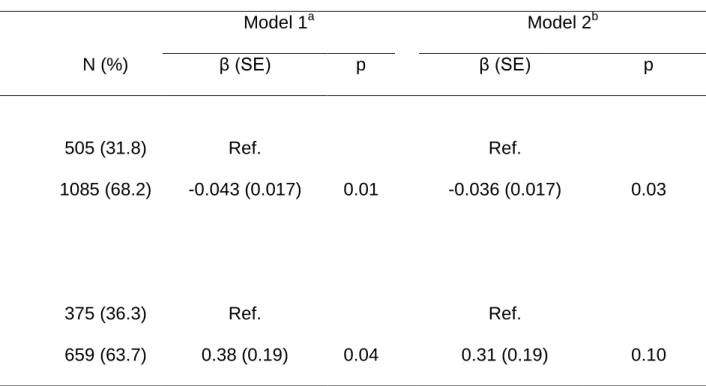
At baseline, a brain MRI was available for 1590 subjects (figure 1). The mean (SD)
age of subjects with a MRI was 73.2 (4.1) years, 60.5% of them were women, and
of subjects had at least one lacunar infarct. Table 5 presents the relation between
hypertension and walking speed among subjects who performed a brain MRI at
baseline. Adjustment for WML volume and the presence of lacunar infarcts
attenuated the relation between hypertension and baseline walking speed (decrease
in regression coefficient = 16.3%), and walking speed decline (decrease in
regression coefficient = 18.4%).
Discussion
In this large prospective cohort of non-institutionalized elderly individuals,
hypertension was associated with lower walking speed at baseline and with a higher
annual rate of decline in walking speed over follow-up. Using the number of
antihypertensive drugs used as a surrogate for the severity of hypertension, we found
that these associations were characterized by a dose-effect pattern. These relations
were present both in men and women, and remained after adjustment for several
potentials confounders and mediators. Adjustment for WML volume and presence of
lacunar infarcts at MRI attenuated these relations.
Few studies have investigated the relation between hypertension and motor function
in the elderly. In the Women’s Health Initiative, hypertensive women aged 50 to 79
years old had a lower walking speed as part of their baseline assessment [27]. In
other studies, hypertension was associated with slower long-distance corridor walk
[28], and increasing systolic blood pressure was associated with the decline in a
composite measure of lower limb function [29]. Hypertension was also found to be
associated with direct or indirect markers of physical fitness like activities of daily
To study the relation between motor performances and hypertension, we used a
simple and reliable test, i.e. walking speed, that can be assessed with high reliability
in many settings. In addition, using the number of drugs used as a surrogate for
hypertension severity [24, 25], our findings are suggestive of dose-effect pattern.
Finally, we adjusted our analyses for several potential confounders or mediators and
found consistent results in cross-sectional and longitudinal analyses.
We defined persistent hypertension based on two measures of blood pressure taken
at two different time points in order to reduce the risk of misclassifying hypertensive
status. Indeed, the prevalence of high blood pressure (≥140/90 mm Hg) was
considerably higher at baseline (67.6%) than at the first (47.6%) or second follow-up
(46.4%) exams. An excess of participants with high blood pressure at baseline in
cohort studies has already been described [20], and may be partly explained by a
white-coat effect. Participants who had high blood pressure at two subsequent time
points were more likely to be truly hypertensive; our approach is in agreement with
international recommendations requiring two separate measures of elevated blood
pressure for the diagnosis of hypertension [33].
Various mechanisms may account for the association between hypertension and
lower walking speed. Hypertension is a major risk factor for cerebrovascular disease,
including stroke and WML seen on cerebral MRI [6]. Several studies have shown that
WML are associated with worse motor performances [34, 35], suggesting
perturbations of neural networks due to small vessel pathology [36]. In our analyses,
adjustment for white matter abnormalities attenuated the relations between
suggests that white matter abnormalities may be an intermediate factor in the relation
between hypertension and lower walking speed in the elderly. We therefore
hypothesize that the relation between hypertension and walking speed may be, at
least partly, explained by the central neurological consequences of hypertension.
Alternative mechanisms may be involved. Hypertension is a major risk factor for
atherosclerosis and leads to peripheral artery and coronary disease, which may be
responsible for poorer physical performances. However, adjustment for these
conditions did not modify the observed relations. A class-effect of antihypertensive
drugs is unlikely as no difference was found for the different antihypertensive drugs
used; further, exclusion of subjects treated by beta-blockers did not modify our
results. Similarly, a small trial performed in healthy subjects found no effect of
beta-blockers on walking speed [37].
This study has several strengths, including its large size, the measure of walking
speed using of an automated method, the inclusion of numerous potential
confounders in the analyses, and the confirmation of the association in both sexes
and in both cross-sectional and longitudinal analyses.
The main limitation of this study is a non-negligible proportion of missing values for
walking speed at the fourth follow-up; participants were able to choose if they wanted
to be interviewed at home or at the study center and a walking speed could not be
measured in those who were interviewed at home or refused to participate. In
complete-case analyses (i.e., analyses based on available data), observations with
missing information for any of the predictors are deleted from the analyses [38]. This
yields different sample sizes depending on the predictors included in the model.
Simple approaches (e.g., missing indicators method) do not in general correct this
bias, and require that missingness be independent of the outcome. Multiple
imputation is more generally appropriate and allows asymptotically unbiased
estimation of exposure effects under the weaker assumption of missing at random
conditional on measured variables, including the outcome [38]. This approach is
considered to decrease bias without strongly affecting standard errors of regression
parameters [39]. In order to assess whether missingness may have biased the
association measures, we conducted a sensitivity analysis, by imputing missing
values of walking speed based on its main determinants. We found that the
associations remained in analyses based on multiple imputation; this finding is
reassuring and suggests that missing values were not responsible for an important
bias. Another limitation of the study is that, given its observational nature, we were
unable to study the consequence of blood pressure control on walking speed decline
among treated hypertensive subjects.
In conclusion, hypertension was associated with lower walking speed at baseline and
with a higher annual decline in walking speed over follow-up in a large cohort of
non-institutionalized elderly individuals. These findings suggest that hypertension plays a
role in motor decline in the elderly, partly explained by its consequences on brain
vessels. These data are in line with the involvement of hypertension and other
vascular risk factors in cognitive decline and dementia. Motor decline in the elderly
represents a great challenge for our aging societies, and the optimization of
hypertension care may contribute to prevent motor decline and its severe
Acknowledgements
The 3C study is conducted under a partnership agreement between the Institut
National de la Santé et de la Recherche Médicale (INSERM), the Victor Segalen –
Bordeaux II University, and the Sanofi-Synthélabo Company. The Fondation pour la
Recherche Médicale funded the preparation and initiation of the study. The 3C Study
is also supported by the Caisse Nationale Maladie des Travailleurs Salariés,
Direction Générale de la Santé, Haute Autorité de la Santé, Institut National de Prévention et d'Education pour la Santé (INPES), Conseils Régionaux of Bourgogne, Fondation de France, Ministry of Research-INSERM Program, "Cohortes et
collections de données biologiques," Mutuelle Générale de l’Education Nationale, Institut de la Longévité, Conseil Général de la Côte d’or. Julien Dumurgier was
supported by a PhD grant from the Fondation pour la Recherche Médicale.
References
1 Alexander NB, Goldberg A. Gait disorders: search for multiple causes. Cleve Clin
J Med. 2005; 72:586, 589-90, 592-4 passim.
2 Brach JS, Talkowski JB, Strotmeyer ES, Newman AB. Diabetes mellitus and gait
dysfunction: possible explanatory factors. Phys Ther. 2008; 88:1365-74.
3 Soumare A, Elbaz A, Ducros V, Tavernier B, Alperovitch A, Tzourio C.
Cross-sectional association between homocysteine and motor function in the elderly.
Neurology. 2006; 67:985-90.
4 Volpato S, Ble A, Metter EJ, Lauretani F, Bandinelli S, Zuliani G, et al.
High-density lipoprotein cholesterol and objective measures of lower extremity
performance in older nondisabled persons: the InChianti study. J Am Geriatr Soc.
2008; 56:621-9.
5 Kearney PM, Whelton M, Reynolds K, Muntner P, Whelton PK, He J. Global
burden of hypertension: analysis of worldwide data. Lancet. 2005; 365:217-23.
6 van Dijk EJ, Breteler MM, Schmidt R, Berger K, Nilsson LG, Oudkerk M, et al.
The association between blood pressure, hypertension, and cerebral white
matter lesions: cardiovascular determinants of dementia study. Hypertension.
2004; 44:625-30.
7 Tzourio C, Dufouil C, Ducimetiere P, Alperovitch A. Cognitive decline in
individuals with high blood pressure: a longitudinal study in the elderly. EVA
Study Group. Epidemiology of Vascular Aging. Neurology. 1999; 53:1948-52.
8 Vermeer SE, Prins ND, den Heijer T, Hofman A, Koudstaal PJ, Breteler MM.
Silent brain infarcts and the risk of dementia and cognitive decline. N Engl J Med.
9 Graham JE, Ostir GV, Kuo YF, Fisher SR, Ottenbacher KJ. Relationship between
test methodology and mean velocity in timed walk tests: a review. Arch Phys
Med Rehabil. 2008; 89:865-72.
10 Ostir GV, Kuo YF, Berges IM, Markides KS, Ottenbacher KJ. Measures of lower
body function and risk of mortality over 7 years of follow-up. Am J Epidemiol.
2007; 166:599-605.
11 Morita M, Takamura N, Kusano Y, Abe Y, Moji K, Takemoto T, et al. Relationship
between falls and physical performance measures among community-dwelling
elderly women in Japan. Aging Clin Exp Res. 2005; 17:211-6.
12 Guralnik JM, Ferrucci L, Pieper CF, Leveille SG, Markides KS, Ostir GV, et al.
Lower extremity function and subsequent disability: consistency across studies,
predictive models, and value of gait speed alone compared with the short
physical performance battery. J Gerontol A Biol Sci Med Sci. 2000; 55:M221-31.
13 Penninx BW, Ferrucci L, Leveille SG, Rantanen T, Pahor M, Guralnik JM. Lower
extremity performance in nondisabled older persons as a predictor of subsequent
hospitalization. J Gerontol A Biol Sci Med Sci. 2000; 55:M691-7.
14 The 3C Study Group. Vascular factors and risk of dementia: design of the
Three-City Study and baseline characteristics of the study population.
Neuroepidemiology. 2003; 22:316-25.
15 http://www.theriaque.org. Centre National Hospitalier d’Information sur le
Médicament. 2002.
16 Radloff LS. The CES-D scale: A self report depression scale for research in the
general population. Applied Psychological Measurement. 1977; 1:385-401.
17 Folstein MF, Folstein SE, McHugh PR. "Mini-mental state". A practical method
for grading the cognitive state of patients for the clinician. J Psychiatr Res. 1975;
18 The Criteria Committee of the New York Heart Association. Nomenclature and
Criteria for Diagnosis of Diseases of the Heart and Great Vessels. 9th ed.
Boston, Mass: Little, Brown & Co. 1994:253-256.
19 Turner MJ, van Schalkwyk JM. Blood pressure variability causes spurious
identification of hypertension in clinical studies: a computer simulation study. Am
J Hypertens. 2008; 21:85-91.
20 Bovet P, Gervasoni JP, Ross AG, Mkamba M, Mtasiwa DM, Lengeler C, et al.
Assessing the prevalence of hypertension in populations: are we doing it right? J
Hypertens. 2003; 21:509-17.
21 Ferrucci L, Guralnik JM, Salive ME, Fried LP, Bandeen-Roche K, Brock DB, et al.
Effect of age and severity of disability on short-term variation in walking speed:
the Women's Health and Aging Study. J Clin Epidemiol. 1996; 49:1089-96.
22 Soumare A, Elbaz A, Zhu Y, Maillard P, Crivello F, Tavernier B, et al. White
matter lesions volume and motor performances in the elderly. Ann Neurol. 2009;
65:706-15.
23 Maillard P, Delcroix N, Crivello F, Dufouil C, Gicquel S, Joliot M, et al. An
automated procedure for the assessment of white matter hyperintensities by
multispectral (T1, T2, PD) MRI and an evaluation of its between-centre
reproducibility based on two large community databases. Neuroradiology. 2008;
50:31-42.
24 Srivastava PM, Calafiore P, Macisaac RJ, Patel SK, Thomas MC, Jerums G, et
al. Prevalence and predictors of cardiac hypertrophy and dysfunction in patients
with Type 2 diabetes. Clin Sci (Lond). 2008; 114:313-20.
25 Wallenius S, Kumpusalo E, Parnanen H, Takala J. Drug treatment for
hypertension in Finnish primary health care. Eur J Clin Pharmacol. 1998;
26 Butler J, Khadim G, Belue R, Chomsky D, Dittus RS, Griffin M, et al. Tolerability
to beta-blocker therapy among heart failure patients in clinical practice. J Card
Fail. 2003; 9:203-9.
27 McGinn AP, Kaplan RC, Verghese J, Rosenbaum DM, Psaty BM, Baird AE, et al.
Walking speed and risk of incident ischemic stroke among postmenopausal
women. Stroke. 2008; 39:1233-9.
28 Newman AB, Simonsick EM, Naydeck BL, Boudreau RM, Kritchevsky SB, Nevitt
MC, et al. Association of long-distance corridor walk performance with mortality,
cardiovascular disease, mobility limitation, and disability. Jama. 2006;
295:2018-26.
29 Shah RC, Wilson RS, Bienias JL, Arvanitakis Z, Evans DA, Bennett DA. Blood
pressure and lower limb function in older persons. J Gerontol A Biol Sci Med Sci.
2006; 61:839-43.
30 Newman AB, Arnold AM, Sachs MC, Ives DG, Cushman M, Strotmeyer ES, et al.
Long-Term Function in an Older Cohort-The Cardiovascular Health Study All
Stars Study. J Am Geriatr Soc. 2009.
31 Samper-Ternent R, Al Snih S, Raji MA, Markides KS, Ottenbacher KJ.
Relationship Between Frailty and Cognitive Decline in Older Mexican Americans.
J Am Geriatr Soc. 2008.
32 Hausdorff JM, Herman T, Baltadjieva R, Gurevich T, Giladi N. Balance and gait
in older adults with systemic hypertension. Am J Cardiol. 2003; 91:643-5.
33 Chobanian AV, Bakris GL, Black HR, Cushman WC, Green LA, Izzo JL, Jr., et al.
Seventh report of the Joint National Committee on Prevention, Detection,
Evaluation, and Treatment of High Blood Pressure. Hypertension. 2003;
34 Rosano C, Brach J, Longstreth Jr WT, Newman AB. Quantitative measures of
gait characteristics indicate prevalence of underlying subclinical structural brain
abnormalities in high-functioning older adults. Neuroepidemiology. 2006;
26:52-60.
35 Baezner H, Blahak C, Poggesi A, Pantoni L, Inzitari D, Chabriat H, et al.
Association of gait and balance disorders with age-related white matter changes:
the LADIS study. Neurology. 2008; 70:935-42.
36 Guttmann CR, Benson R, Warfield SK, Wei X, Anderson MC, Hall CB, et al.
White matter abnormalities in mobility-impaired older persons. Neurology. 2000;
54:1277-83.
37 Rechnitzer PA, Cunningham DA, Howard JH. The self-selected walking pace test
and beta blockade. Can J Sport Sci. 1989; 14:178-81.
38 Klebanoff MA, Cole SR. Use of multiple imputation in the epidemiologic literature.
Am J Epidemiol. 2008; 168:355-7.
39 Allison PD. Imputation of categorical variables with PROC MI. SUGI 30
Proceedings. 2005:1-14.
Figure legends
Figure 1. Selection of the participants for cross-sectional and longitudinal analyses.
a
Subjects with a missing value for walking speed at the fourth follow-up, who were
Table 1 Baseline characteristics of the study population, overall and by tertiles of walking speed and by hypertensive status.
Tertiles of walking speed Hypertensiona
Characteristics All < 1.43 m/s 1.43-1.62 m/s > 1.62 m/s pb No Yes pb
N 3604 1304 1013 1287 1029 2575
Age, years, mean (SD) 73.4 (4.6) 74.9 (4.6) 73.4 (4.6) 71.9 (4.1) <0.001 72.2 (4.3) 73.9 (4.7) <0.001 Women, n (%) 2231 (61.9) 1059 (81.2) 663 (65.5) 509 (39.6) <0.001 709 (68.9) 1522 (59.1) <0.001 BMI, kg.m-2, mean (SD) 25.7 (4.0) 26.4 (4.5) 25.5 (3.8) 25.1 (3.4) <0.001 24.3 (3.4) 26.2 (4.1) <0.001 Low education level, n (%)c 1240 (34.3) 618 (47.4) 306 (30.2) 316 (24.6) <0.001 299 (29.1) 941 (36.5) 0.001 MMSE score, mean (SD) 27.5 (1.9) 27.0 (2.0) 27.6 (1.8) 27.8 (1.7) <0.001 27.6 (1.9) 27.4 (1.9) 0.001 Depressive symptoms, n (%)d 460 (12.9) 225 (17.5) 112 (11.1) 123 (9.6) <0.001 129 (12.7) 331 (13.0) 0.80 Low physical activity, n (%)e 599 (17.3) 291 (23.5) 149 (15.3) 159 (12.6) <0.001 147 (14.8) 452 (18.3) 0.01 Diabetes mellitus, n (%) 324 (9.2) 123 (9.7) 93 (9.4) 108 (8.7) 0.65 34 (3.4) 290 (11.6) <0.001 Hypercholesterolemia, n (%)f 1422 (40.2) 550 (42.9) 418 (42.0) 454 (36.0) 0.002 343 (33.8) 1079 (42.8) <0.001 Ex- or current smokers, n (%) 1386 (38.5) 360 (27.6) 376 (37.1) 650 (50.5) <0.001 352 (34.2) 1034 (40.2) 0.001 Current drinker, n (%) 2844 (79.1) 961 (73.8) 796 (78.8) 1087 (84.7) <0.001 815 (79.3) 2029 (79.0) 0.92 Psychotropic drugs use, n (%) 911 (25.3) 455 (34.6) 254 (25.1) 206 (16.0) <0.001 255 (24.8) 656 (25.5) 0.66 NSAIDs for chronic joint pain, n (%) 535 (15.0) 275 (21.4) 123 (12.3) 137 (10.8) <0.001 138 (13.6) 397 (15.6) 0.12 History of coronary disease, n (%) 369 (10.2) 145 (11.1) 105 (10.4) 119 (9.3) 0.29 34 (3.3) 335 (13.0) <0.001 Peripheral artery disease, n (%) 112 (3.2) 49 (3.8) 27 (2.7) 36 (2.8) 0.22 20 (2.0) 92 (3.6) 0.01 Exertional dyspnea, n (%) 494 (13.7) 273 (21.0) 119 (11.8) 102 (7.9) <0.001 106 (10.3) 388 (15.1) 0.01
aAntihypertensive treatment or blood pressure ≥ 140/90 mmHg at baseline and first follow-up. bChi-square statistic for categorical variables or the Student t-test for continuous variables. cPrimary without diploma.
dAssessed by the Center of Epidemiological Studies–Depression Scale. eWalking less than one hour a day and no sport activity.
Table 2 Cross sectional association between hypertension and baseline walking speed
Walking Speed Model 1a Model 2b Model 3c Model 4d Characteristics N (%) mean (SD), m/s β (SE) p β (SE) p β (SE) p β (SE) p Overall (N=3604)
No hypertension 1029 (28.6) 1.59 (0.30) Ref. Ref. Ref. Ref.
Hypertensione 2575 (71.4) 1.51 (0.31) -0.045 (0.010) <.001 -0.041 (0.010) <.001 -0.037 (0.010) <.001 -0.033 (0.010) <.001
0 AHDf 1780 (49.4) 1.58 (0.30) Ref. Ref. Ref. Ref.
1 AHD 1112 (30.9) 1.50 (0.30) -0.041 (0.010) <.001 -0.034 (0.010) .001 -0.028 (0.010) .005 -0.024 (0.010) .02 2 AHD 561 (15.5) 1.46 (0.30) -0.064 (0.013) <.001 -0.057 (0.013) <.001 -0.051 (0.013) <.001 -0.043 (0.013) .001 ≥ 3 AHD 151 (4.2) 1.43 (0.33) -0.101 (0.022) <.001 -0.089 (0.022) <.001 -0.086 (0.023) <.001 -0.071 (0.023) .002
P for linear trend <.001 <.001 <.001 <.001
Men (N=1373)
No hypertension 320 (23.3) 1.76 (0.29) Ref. Ref. Ref. Ref.
Hypertensione 1053 (76.7) 1.66 (0.30) -0.049 (0.018) .007 -0.051 (0.018) .006 -0.045 (0.018) .01 -0.043 (0.018) .02
Women (N=2231)
No hypertension 709 (31.8) 1.51 (0.27) Ref. Ref. Ref. Ref.
Hypertensione 1522 (68.2) 1.40 (0.27) -0.043 (0.012) <.001 -0.036 (0.012) .002 -0.033 (0.012) .004 -0.030 (0.012) .01
aAdjusted for age, sex, BMI. We present regression coefficients (β) and their standard error (SE). b
Additional adjustment for education level, MMSE, physical activity, hypercholesterolemia, smoking, and NSAIDs use for chronic joint pain.
c
Additional adjustment for depressive symptoms, diabetes mellitus, alcohol and psychotropic drugs use.
d
Additional adjustment for coronary heart disease, peripheral artery disease, and exertional dyspnea.
e
Antihypertensive treatment or blood pressure ≥ 140/90 mmHg at baseline and first follow-up.
f
Table 3 Baseline characteristics of the population included in longitudinal analyses, overall and according to tertiles of walking speed decline
Tertiles of annual walking speed decline, cm/s per year
Characteristics All < 0.87 0.87-3.06 >3.06 Pa
N 1774 586 584 604
Age, years, mean (SD) 71.5 (3.6) 71.2 (3.7) 71.5 (3.6) 71.9 (3.6) <0.001 Women, n (%) 1092 (61.6) 379 (64.7) 368 (63.0) 345 (57.1) <0.001 BMI, kg.m-2, mean (SD) 25.4 (3.7) 25.0 (3.6) 25.6 (3.6) 25.7 (3.8) <0.001 Low education level, n (%)b 572 (32.2) 197 (33.6) 212 (36.3) 163 (27.0) <0.001 MMSE score, mean (SD) 27.8 (1.7) 27.8 (1.7) 27.7 (1.8) 27.8 (1.7) 0.48 Depressive symptoms, n (%)c 193 (10.9) 68 (11.7) 57 (9.8) 68 (11.3) 0.29 Low physical activity, n (%)d 242 (14.0) 70 (12.2) 83 (14.6) 89 (15.3) <0.001 Diabetes mellitus, n (%) 138 (7.9) 41 (7.1) 46 (8.0) 51 (8.6) 0.03 Hypercholesterolemia, n (%)e 688 (39.3) 239 (41.1) 237 (41.2) 212 (35.7) 0.24 Ex- or current smokers, n (%) 666 (37.5) 196 (33.4) 225 (38.5) 245 (40.6) 0.31 Current drinker, n (%) 1427 (80.7) 475 (81.2) 466 (79.9) 486 (80.9) 0.18 Psychotropic drugs use, n (%) 234 (13.3) 87 (15.0) 80 (13.8) 67 (11.2) 0.004 NSAIDs for chronic joint pain, n (%) 340 (19.2) 116 (19.8) 108 (18.5) 116 (19.2) 0.27 History of coronary disease, n (%) 137 (7.7) 37 (6.3) 50 (8.6) 50 (8.3) 0.08 Peripheral artery disease, n (%) 31 (1.8) 8 (1.4) 11 (1.9) 12 (2.0) 0.43 Exertional dyspnea, n (%) 173 (9.8) 55 (9.4) 58 (9.9) 60 (9.9) 0.006 Baseline walking speed, m/s, mean (SD) 1.61 (0.29) 1.50 (0.25) 1.58 (0.26) 1.74 (0.30) <0.001
a
Adjusted for baseline walking speed.
b
Primary without diploma.
c
Assessed by the Center of Epidemiological Studies–Depression Scale.
d
Walking less than one hour a day and no sport activity.
e
Table 4 Longitudinal association between hypertension and annual decline in walking speed
Mean (SD) annual walking Model 1a Model 2b Model 3c Characteristics N, % speed decline, cm/s/yr β (SE) p β (SE) p β (SE) p Overall (N=1774)
No hypertension 603 (34.0) 1.87 (3.3) Ref. Ref. Ref.
Hypertensiond 1171 (66.0) 2.30 (3.4) 0.44 (0.15) 0.004 0.43 (0.16) 0.006 0.37 (0.16) 0.02
0 AHDe 1026 (57.8) 1.99 (3.31) Ref. Ref. Ref.
1 AHD 497 (28.0) 2.38 (3.34) 0.47 (0.16) 0.004 0.40 (0.17) 0.02 0.33 (0.17) 0.06 ≥ 2 AHD 251 (14.2) 2.38 (3.58) 0.60 (0.21) 0.004 0.59 (0.22) 0.006 0.52 (0.22) 0.02
P for linear trend <0.001 0.002 0.01
Men (N=682)
No hypertension 183 (26.8) 1.95 (3.7) Ref. Ref. Ref.
Hypertensiond 499 (73.2) 2.51 (3.6) 0.49 (0.27) 0.07 0.55 (0.28) 0.05 0.44 (0.28) 0.12
Women (N=1092)
No hypertension 420 (38.5) 1.83 (3.18) Ref. Ref. Ref.
Hypertensiond 672 (61.5) 2.15 (3.18) 0.39 (0.18) 0.03 0.38 (0.19) 0.05 0.34 (0.19) 0.08
aAdjusted for baseline walking speed, age, sex, BMI. We present regression coefficients (β) and their standard error (SE). b
Additional adjustment for education level, MMSE, hypercholesterolemia, smoking, baseline physical activity level, diabetes mellitus, and psychotropic drug use.
c
Additional adjustment for coronary heart disease, peripheral artery disease, and exertional dyspnea.
d
Antihypertensive treatment or blood pressure ≥ 140/90 mmHg at baseline and first follow-up.
e
Table 5 Relationship between hypertension and baseline walking speed or walking speed decline among subjects who performed a brain MRI at baseline
Model 1a Model 2b
N (%) β (SE) p β (SE) p
Cross-sectional analysesc
No hypertension 505 (31.8) Ref. Ref.
Hypertensiond 1085 (68.2) -0.043 (0.017) 0.01 -0.036 (0.017) 0.03
Longitudinal analysese
No hypertension 375 (36.3) Ref. Ref.
Hypertensiond 659 (63.7) 0.38 (0.19) 0.04 0.31 (0.19) 0.10
a
Adjusted for age, sex, and BMI.
b
Additional adjustment for volume of white matter lesions (WML) (log transformed) and presence of lacunar infarcts
c
Relation between hypertensive status and baseline walking speed.
d
Antihypertensive treatment or blood pressure ≥ 140/90 mmHg at baseline and first follow-up.
e
Relation between hypertensive status and walking speed change over follow-up. Models are also adjusted for baseline walking speed.