HAL Id: halshs-03261109
https://halshs.archives-ouvertes.fr/halshs-03261109
Submitted on 15 Jun 2021
HAL is a multi-disciplinary open access
archive for the deposit and dissemination of sci-entific research documents, whether they are pub-lished or not. The documents may come from teaching and research institutions in France or abroad, or from public or private research centers.
L’archive ouverte pluridisciplinaire HAL, est destinée au dépôt et à la diffusion de documents scientifiques de niveau recherche, publiés ou non, émanant des établissements d’enseignement et de recherche français ou étrangers, des laboratoires publics ou privés.
Migration and nonfarm activities as income
diversification strategies: the case of Northern Ghana
Francesca Marchetta
To cite this version:
Francesca Marchetta. Migration and nonfarm activities as income diversification strategies: the case of Northern Ghana. Revue canadienne d’études du développement / Canadian Journal of Develop-ment Studies, Association canadienne d’études du développeDevelop-ment international, 2013, 34 (1), pp.1-21. �10.1080/02255189.2013.755916�. �halshs-03261109�
1
Migration and non-farm activities as income diversification strategies:
the case of Northern Ghana*
Francesca Marchetta
CERDI, University of Auvergne and CNRS Bd. F. Mitterrand, 65
F-63000, Clermont-Ferrand
e-mail: francesca.marchetta@u-clermont1.fr
Abstract
This article jointly analyses the determinants of participation in non-farm activities and of migration in Northern Ghana, combining household data with community-level information and data on the evolution of the yields of cash and staple crops. Our results confirm the role of education as a key asset to pursue opportunities in the off-farm sector and the role of farm size in reducing the probability to participate in non-farm activities. Poor households do not have enough resources to undertake non-farm activities and they opt for migration as a diversification strategy. Community-level assets are found to play a crucial role for understanding off-farm diversification.
JEL Classification: I32, O15, O55, Q12.
Keywords: income diversification, non-farm activities, migration.
* The author is grateful to the editor John Harriss, to three anonymous referees and to Simone Bertoli, Frank Ellis, Ornella Giambalvo, Leonardo Grilli and Donato Romano for their comments and suggestions; the usual disclaimers apply.
2 Introduction
The objective of this paper is to analyse the determinants of income diversification in the rural areas of Northern Ghana, a sparsely populated region entirely covered by the savannah, with a limited endowment of natural resources and a level of income per capita that falls well short of the national average. This region experienced major economic and institutional changes in the 1990s, when the structural adjustment policies1 implemented by Ghana exposed the producers in the North to an
increased competition with foreign produced goods. Imported rice, poultry and tomato paste induced a significant decline in the demand for locally produced varieties, while the US subsidies provided to cotton farmers limited the profitability of this cash crop (Khor and Hormeku, 2006; CEPA and ODI, 2005). Some public investment projects, which had begun in the early 1970s, were discontinued because of lack of fiscal resources, and the region was neglected in the design of the new economic policies. The substantial flows of foreign aid directed toward Northern Ghana had at most a limited impact on the backwardness of the region (Songstore, 2003). Last but not least, changes in climatic conditions, with shorter rainy seasons and with a more erratic pattern of rainfall, have damaged the agricultural sector, increasing the risks faced by farmers (Dietz et al., 2004; Hesselberb and Yaro, 2006).2
These institutional, economic and environmental changes have affected the livelihood strategies adopted by rural households; while agriculture still represents the prevailing economic activity, survey data show an increasing diversification into non-farm activities and migration.3 Data from
the Core Welfare Indicators Questionnaire (GSS, 2000a, 2005a) reveal that employment in non-agricultural activities has increased between 1997 and 2003, consistently with the theoretical prediction of the literature (Yaro, 2006; Yeboah, 2005; Obeng, 2005; Assan et al., 2009, van der Geest, 2003, Marchetta, 2011; CEPA and ODI, 2005). This change strengthens the case for analysing the household and community-level determinants of the income diversification strategies adopted by rural households, as literature offers diverging perspectives around the development contribution of the participation into non-farm activities, which are mostly informal.4 Following
3
Scoones (1998), we consider the involvement in farming activities, local non-farm activities and migration as an exhaustive description of the possible livelihood strategies that households can opt for.5
There is a vast economic literature on the underlying determinants of income diversification at the individual and at the household level.6 Rural development and a widespread improvement in living
conditions stimulate the consumption of non-farm goods and the investment outside the agricultural sector. Improvements in infrastructures, the growth of urban centres and an increasing population density represent other relevant pull factors (Barrett et al., 2001). With respect to the push factors, households can be induced to diversify their income sources in response to extensive market failures: earnings from non-farm activities provide households with the resources that cannot be obtained from missing credit markets (Reardon and Barret, 2000) and that can allow them to farm their land efficiently, and reduce their exposure to the fluctuations of agricultural output, due to idiosyncratic or covariate shocks. The resilience to covariate shocks depends on the portfolio of assets of each household (Dercon, 2002), with this including both private, such as livestock and land, and public resources, such as access to water and proximity to market.7
This paper contributes to an existing strand of literature analysing income diversification strategies in the rural areas of Northern Ghana. The literature evidences a strong complementarity between the agriculture and non-agricultural sector in Ghana (Knudsen, 2007; Anriquez and Daidone, 2008), and it suggests that education, land scarcity and community assets are key determinants of the participation into non-farm activities (Ackah, 2012; Asmah, 2011).8 Abdulai and Delgado (1999) is,
to the best of our knowledge, the only paper that has focused so far on the determinants of income diversification in Northern Ghana, confirming the key role of education and proximity to markets in shaping the income diversification strategies.
Our paper introduces some methodological contributions that play a relevant role in the analysis. We jointly analyse the determinants of participation in non-farm activities and of migration in
4
Northern Ghana, combining household survey data with community-level information that allows us to better control for the role played by public assets.
The literature on rural income diversification generally analyses the determinants of participation in non-farm activities separately from the determinants of the choice to migrate (see, inter alia, Berdegué et al., 2001; Corral and Reardon, 2001; Escobal, 2001). We endorse the argument by McDowell and de Haan (1997, p.20) who argue that “there is much to gain from seeing migration as one of the livelihood strategies of households rather than isolating migration events”, so that we adopt an approach that jointly analyses these two decisions, as in De Janvry and Sadoulet (2001). Our analysis confirms the role of education as a key determinant of off-farm diversification, with primary education being a key characteristic of remittances recipient households, while higher levels of education are typical of households with an income from non-farm activities. Demographic characteristics and private assets, with the exception of land, have a limited impact on the participation into non-farm activities, differently from the expectations. Conversely, community-level assets, such as proximity to markets and health care facilities, are crucial for understanding off-farm diversification. We also found that the evolution of the yields of both cash and staple crops, which can reflect both differences in soil fertility and the variability in weather conditions, exerts a significant influence on the adopted diversification strategies.
The paper is structured as follows. The next section presents the datasets used in the analysis, briefly illustrating the income generating strategies of our population of interest. We present the relevant descriptive statistics, and then move to the econometric analysis of the determinants of the choice of the livelihood strategies; finally, we draw some concluding remarks.
Income generating strategies of sample population
We draw our data from the fourth round of the Ghana Living Standards Survey, GLSS4 henceforth, conducted by the Ghana Statistical Service in 1998-1999 (GSS, 2000b). This is a multi-purpose
5
survey, which gathers information on several facets of households’ living conditions, and it provides very detailed data on the patterns of household income and consumption. The survey covers a sample of 5,998 households, that is representative at the regional level.9 We use only the
data collected in the rural areas of the three administrative regions of Northern Ghana, thus restricting the sample to 600 households.
Beside the data drawn from the household questionnaire, we also rely on information drawn from a community questionnaire that was administrated in each rural enumeration area. This represents a major methodological innovation that provides us with relevant information on communal assets and infrastructures; such an innovation would have been unfeasible if we were to use the whole sample, as in the other regions it was not possible to match household with community-level data.10
The main content of the community questionnaire regards the economic infrastructures, education and health facilities existing in the communities.
The first step in the analysis of livelihood strategies is to identify and to define all the relevant income generating activities.11 We define as agricultural incomes the incomes derived from farming
either for self-consumption or for selling non-processed crop products in the market, plus the earnings derived from various activities related to agriculture, as the sale of eggs, honey or milk. Income from non-farm activities can be derived from one the following sources: (i) non-farm self-employment income; (ii) cash from non-farm activities; (iii) in-kind revenues from non-farm activities; (iv) wages from employment; (v) revenue from the sale of processed crop products.12
According to the GLSS4, the most common non-farm activity is retail trade. Brewing and food processing are also widespread, while minor activities, which are often performed as a second job, are represented by pottery, wearing apparel and repair services. 5.2 per cent of the households in our sample receive a wage from employment, generally in the public sector.
We consider remittances, which are used as a proxy for the out-migration of a household member, as a distinct source of income, rather than pooling them with the incomes from non-farm activities. Remittances are defined as transfers, both in cash and in kind, received from any sender who resides
6
in another village, as transfers that occur within the same village are unrelated to migration, and they rather reflect reciprocity among households.
Since all the households in our sample derive income from agricultural activities, we can classify households using just four mutually exclusive classes according to their income sources: (i) income from agricultural activities only; (ii) income from agricultural and non-agricultural activities; (iii) income from agricultural activities and remittances; (iv) all income sources.
The data reveal that 31.2 per cent of the households have only agricultural incomes, while 37.9 per cent of the households derive incomes from agricultural and non-agricultural activities; 15.9 per cent of the sample combines agricultural incomes with remittances, and 15.0 per cent obtains incomes from all the three sources.
[TABLE 1 AROUND HERE]
Table 1 reveals that there are relevant differences across the four livelihood strategies both with respect to median income and the incidence of extreme poverty. 52.1 per cent of the households with agricultural and non-agricultural incomes fall below the extreme poverty line, while the incidence of poverty is the highest (76.7 per cent) among the households that combine agricultural incomes and remittances.13 The second data column in Table 2 reveals that agriculture generates
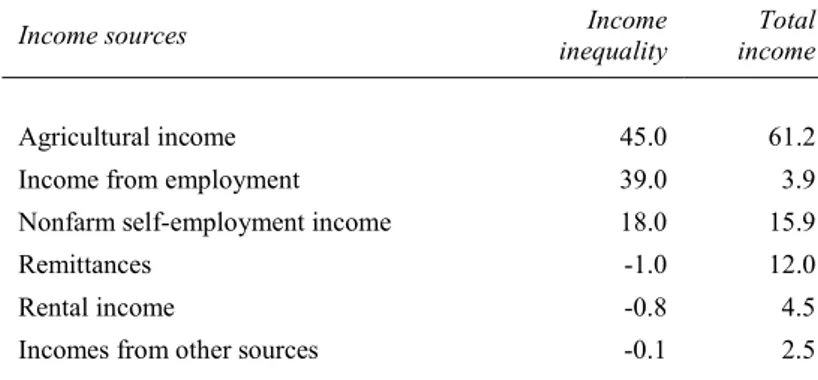
61.2 per cent of household incomes in Northern Ghana, with incomes from non-agricultural activities and remittances contributing to 19.8 and 12.0 per cent of total incomes respectively.14
We use the Theil (1967) index, following Morduch and Sicular (2002), to gauge the role played by the various income sources in explaining income inequality across households, as this measure of income inequality can, differently from the Gini coefficient, be perfectly decomposed. The Theil index T(Yk) for the k source of income is:
𝑇(𝑌 ) = 1 𝑁 𝑦 𝜇 𝑙𝑛 𝑦 𝜇
7
where N is the sample size, yj is the total income per capita for household j, 𝑦 is the household
income from component k and μy is the mean total income per capita over the population of interest.
The Theil index T(Y) is given by the sum of the indexes defined for each component, and it ranges between 0 and ln(N); our data reveals that it stands at 0.17 for rural Northern Ghana. The first data column in Table 2 reports the contribution of each income source to inequality and total income. It indicates that a large part of income inequality across sample households, 45 per cent, is due to agricultural incomes, and this is consistent with their large contribution to total income. It is interesting to observe that incomes from non-farm employment, that generate less than 4 per cent of total incomes, explain 39.0 per cent of the aggregate value of the Theil index, while remittances reduce, but to a very limited extent, income inequality among households. The inequality-reducing effect of rental income depends entirely from the inclusion in this category, as discussed above, of imputed rents, with most households owning their own dwellings.
[TABLE 2 AROUND HERE]
Some working hypotheses on the determinants of income diversification
We review here the main findings of the literature on the determinants of income diversification strategies, which drive the selection of the variables to retain in the econometric analysis. We focus first on household characteristics, moving then to some key community-level variables and to the evolution of agricultural yields.
Household characteristics
“The more labor available to a household the more likely households are to participate in, and receive higher returns from, all activities, and particularly non-farm activities” (Davis et al., 2007, p. 29). Larger households have stronger incentives and a better ability to search for alternative sources of income. This implies that the number of working age members should be positively
8
related to the probability of participating in non-farm activities, which are included in the second and fourth strategy.
Davis et al. (2007) also observe that remittance recipient “would tend to have smaller households” (p. 29). The same conclusion is drawn by Adams et al. (2008) in his study on remittances and poverty in Ghana, where he found a negative impact of the household size on the probability to receive remittances from domestic sources, while Smith (2000) observes that extended families positively influence the probability to migrate. Reardon (1997) states that households are able to send migrants out without affecting domestic production only if they can rely on a sufficiently large labor supply. Thus, the relationship between household size, which is clearly endogenous to migration, and the probability to receive an income from remittances is a priori unclear. Luckily, reverse causality does not represent a pressing concern in our case, as migration out of Northern Ghana occurs predominantly on a seasonal basis, and the GLSS4 also collects information on seasonal migrants who were absent at the time of the survey.
Beyond size, other demographic characteristics are likely to play a role; specifically, households with a high dependency ratio15 are more likely to be pushed towards diversification in off-farm
activities, as they need to search for additional sources of income to feed their dependent members. By the same token, the need to take care of children and elderly members could hinder their ability to leave their household search for a job.16 This is why a testable prediction is that a high
dependency ratio is positively correlated with the probability to participate into non-farm activities, while it is negatively correlated with the likelihood of being a recipient household.
Some studies retain the age of the household head among the determinants of income diversification; this is generally expected to have a negative impact on the probability to have an income from non-farm activities and a positive impact on the probability to receive remittances (Adams et al. 2008; Olatomide and Awoyemi, 2012), although Corral and Reardon (2001) find a positive and statistically significant impact of the age of household head on wage employment, and
9
an insignificant relationship with self-employment; Escobal (2001) finds no significant effect for both income sources.17
The researches on livelihood strategies suggest that the most successful households have a larger share of income from activities other than agriculture; Reardon (1997) provides evidence drawn from 18 case studies that show that the households in the upper income tercile earn a share of total income from non-farm sources that is twice as large as the one recorded in the lowest tercile. The least affluent households remain involved in subsistence agriculture or undertake low-paid casual work in other farms (Ellis, 2003). Reardon et al. (2006) argue that “poor households are more likely to get caught in short-run recovery strategies, while rich households profit from diversification to initiate structural improvement strategies” (p.15). There is a variety of hurdles that can prevent poor people from taking part in non-farm activities: these go from a poor health status to the lack of adequate training and skills, from the lack of financial capital to cover start-up costs to poor community infrastructures. Non-farm activities in Northern Ghana are inaccessible for the poorest, who are not able to overcome the existing entry barriers (Marchetta, 2011; Yaro, 2006). Therefore, we expect a positive relationship between the level income of a household and the probability that it is engaged in non-farm activities.
We also hypothesize a negative relationship between income and remittances receipt, since the literature has evidenced that internal migration is a strategy pursued by the moderately poor (Yaro, 2002; Marchetta, 2011). As Mendola (2008) argues, “asset-poor farm households are more likely to enter into domestic migration, which has lower entry costs, and lower absolute returns” (p. 168). Finally, we suppose that households with an intermediate income fully diversify: they are able to undertake non-farm activities with the support of relatives, who send them a certain amount of money, as suggested by Yaro (2002).18 We resort to a broad categorization of income levels,
building a categorical variable poverty status which takes the value of 0 is the household is in extreme poverty, 1 if it is moderately poor, and 2 if it is non-poor19. We are aware that the
10
may pose a problem of reverse causality, which might be only softened by our use of a broad categorization of income levels, and this is why we also run our model omitting this variable. We computed, and this is new in the literature, the percentage of consumption of home-produced food in household expenditures. A high share of self-consumption can reduce the need to diversify out of agriculture. In other words, among the households having only agricultural incomes, we expect that the ones who do not manage to cover their basic needs with home production are mostly in need and ask for money to relatives and friends. Therefore, we expect a negative relationship between self-consumption and all income sources other than agriculture.
Education is regarded as a key explanatory variable to understand households’ income diversification strategies (see, inter alia, Taylor and Yunez-Naude, 2000, Adams et al., 2008, Berdeguè et al., 2001 and Lanjouw et al. 2001), as “education is often the most valuable asset for rural people to pursue opportunities in the new agriculture, obtain skilled jobs, start business in the rural non-farm economy, and migrate successfully” (World Bank, 2007, p. 9). We expect that education could have the strongest effect in raising the probability to participate in non-farm activities in a context where illiteracy is still widespread. With respect to remittances, the literature does not evidence a strong pattern of selection in education for internal migrants, especially for rural-to-rural migration; de Haan et al. (2000) found, from a series of field studies in Ethiopia, Bangladesh and Mali, that the differences in education between internal migrants and stayers were not significant. Differences in the pattern of selection in education might be observed for rural-to-urban migration; as remittances that are transferred to households with income from all sources often originate from urban areas,20 this could imply that households with a higher level of education
are more likely to fully diversify.
The combination of assets owned by a household is one of the key factors determining the probability to engage in non-farm activities, with de Haan et al. (2000) evidencing its impact on the probability to have a migrant member. This suggests retaining in our analysis information on the ownership of livestock, agricultural equipment and land, as cattle represent the most important store
11
of value for rural households in Northern Ghana (Marchetta, 2011) and for Sub-Saharan Africa more in general (Udry, 1995).
The ownership of agricultural equipment can both increase the productivity of labor engaged in family-run farming activities, thus reducing the probability of diversification, and can be a proxy for the wealth of the household, which could in turn increase their ability to afford the investments connected to the set-up of non-farm activities and internal migration.
The literature evidences the role of farm size in reducing the probability to participate in non-agricultural activities (see, for instance, Winters et al., 2002, Elbers and Lanjouw, 2001 and Adams, 2002) and in increasing the reliance on remittances (Rwelemira et al., 2002; Schrieder and Knerr, 2000; Rogaly and Rafique, 2003). In Northern Ghana, the distribution of land is regulated by customary norms: it is conferred to the paramount chief of each area, or with the tendanaa, the first settler. Land supply is scarce only in some parts of the Upper East region. In such a context, more than size, soil fertility can represent a key determinant of income diversification strategies (Marchetta, 2011). The GLSS4 does not provide information on soil fertility of land productivity, which is included among the determinants of non-farm employment by Escobal (2001), and we resorted to the data collected by the regional offices of the Ministry of Agriculture on the evolution of the yield per hectare of the main crops cultivated in Northern Ghana. A decrease in the yield of staple crops used mostly for self-consumption such as maize, millet and sorghum can strengthen the incentives to diversify out of agriculture, while a decrease in the yield of the crops which can be processed and sold on the market, such as cassava which is used to produce gari or groundnuts which can be used to produce porridge or oil, can reduce the incentives to engage in non-farm activities. We included in the analysis district-level data on the yields per hectare of millet and groundnuts in the three years around the survey, as well as the ratio between these yields and those prevailing in 199221.
12
The positive relationship between access to infrastructures and participation in non-farm activities has been established by a number of studies, including Winters et al. (2002), de Janvry et al. (2005), Berdeguè et al. (2001) and Corral and Reardon (2001). Household-level data often provide no or limited information on community-level variables, such as proximity to markets, schools, health care facilities and public transports. These variables can play a crucial role in enabling activities other than farming. As discussed above, we were able to merge the household-level data contained in the GLSS4 with the community questionnaires administered in each enumeration area, obtaining information on the presence of a local market, on the existence of a hospital that could be reached with a one-hour walk, and whether the village receives regular visits by extension officers. The distance from market is used as a determinant of non-farm income by Escobal (2001) and Jonasson (2005). The presence of a periodical or daily market22 in the village should favor the participation
into non-farm activities, while, by expanding local employment opportunities, it could reduce the likelihood of receiving remittances. The proximity to a hospital can improve the health status of household members, and increase the probability to participate in non-farm activities (Smith et al., 2001), and possibly also increase the ability to migrate (Kothari, 2002). The availability of the assistance of extension officers can contribute to increase land productivity, so reducing the incentives to diversify out of agriculture.
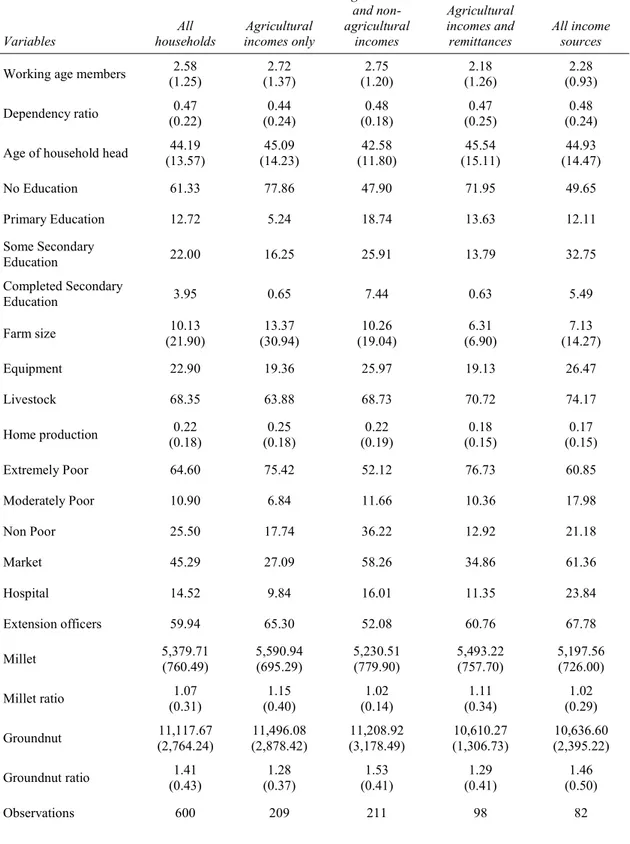
Descriptive statistics
Table 3 provides descriptive statistics for all variables included in the model, both for the whole sample and separately for the four livelihood strategies. This allows us to characterize the salient observable traits of the households engaged in each strategy. The values reported in the first data column of Table 3 are consistent with the idea that “households participating in on farm activities own land, have lower levels of education [and] are located at a distance from infrastructure facilities” (Davis et al., 2007). Furthermore, households who do not diversify are characterized by an high incidence of extreme poverty and they mostly live in areas where the yields of staple crops
13
experienced the highest increase in the years preceding the survey, or where a smaller variation the yields of crops that can be used for food processing, such as groundnuts, prevailed.23
[TABLE 3 AROUND HERE]
If we compare households with an income from agricultural activities and remittances with the households opting for the previous strategy, we see that they have on average a smaller number of working age members, a higher dependency ratio and are slightly better educated. They do not benefit from regular visits of extension officers, but they have a better access to the market. They are also characterized by smaller farm size and they are poorer.
Households engaged in non-farm activities have smaller farm size and younger household head, they more often live in proximity to key facilities such as markets and health care centers and they are characterized by the lowest incidence of extreme poverty. The characteristics of the households who opt for a full diversification are closer with those engaged in non-farm activities than to remittances recipient households.
Modeling income diversification
The multinomial logit model represents the key tool in the multivariate analysis that we conduct here, as such a model is suitable in situations where an agent chooses an alternative i from a menu of n ≥ 2, unordered and mutually exclusive options. The multinomial logit can be derived from an underlying random utility maximization model; specifically, it assumes that the utility that an individual derives from each alternative includes a deterministic component, which is assumed to be a linear function of a vector x, and a stochastic component , which is unobservable for the econometrician. If the stochastic component follows an independently and identically distributed Extreme Value Type-1 distribution, then the probability that an agent j will opt for the alternative i is given by:
14
𝑝𝑟 𝑦 = 𝑖|𝒙 = 𝑒
𝒙 𝜷
∑ 𝑒𝒙 𝜷
The multinomial logit model satisfies the independence of irrelevant alternatives, so that the relative probability of alternative i=2,…, n and 1 depends only on the utility associated to the former (as the coefficients for the base option are normalized to 0):
𝑝𝑟 𝑦 = 𝑖|𝒙 𝑝𝑟(𝑦 = 1|𝒙 ) = 𝑒
𝒙 𝜷
In our application, n = 4, and we select the first livelihood strategy, i.e. agricultural incomes only, as the base outcome; this implies that any element of the estimated vector of coefficients 𝜷 provides information on the impact of the associated regressor on the relative probability of opting for strategy i over the first livelihood strategy. The influence of a regressor on the probability 𝑝 of selecting the strategy i requires computing the partial derivative of 𝑝 with respect to one of the elements in xj:
𝜕𝑝
𝜕𝒙 = 𝑝 (1 − 𝑝 )𝛽 − 𝑝 𝛽
with the partial derivative that needs not to coincide in sign with 𝛽 . We estimate the multinomial logit model with three different nested specifications of x.24 Specifically, the first specification
includes (i) household characteristics (number of working age members, the dependency ratio, age of the household head, the highest level of education,25 farm size in acres,26 dummies for the
ownership of livestock and equipment, share of home production over total27 consumption and
poverty status;28 the second specification includes in x also (ii) community-level variables, related
to the proximity to markets, hospitals and extension officers, and the third one also considers (iii) information on agricultural productivity for millet and groundnuts.29
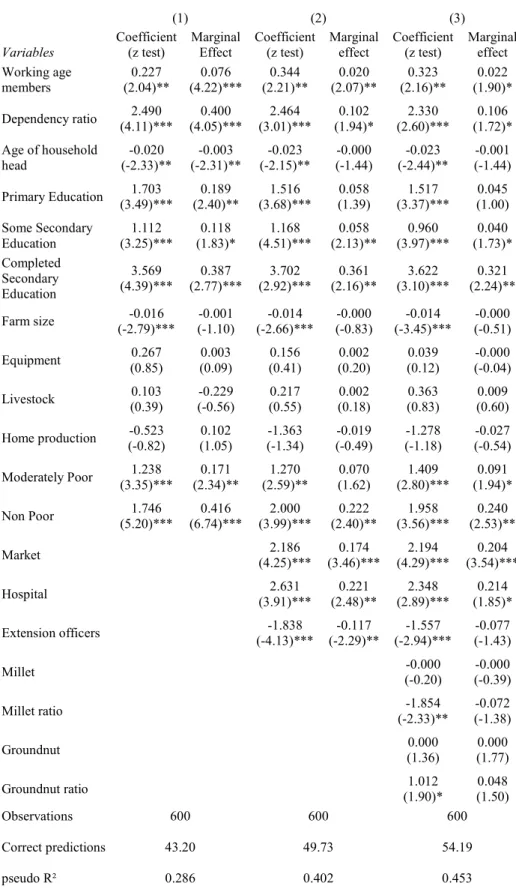
We report for each specification the maximum likelihood R² and the share of correct predictions to gauge the overall goodness of fit of the model.30 Tables 4-6 report the estimates of the three
specifications separately for each of the three livelihood strategies (recall that the coefficients for agricultural income only are normalized to zero). The inclusion of community-level variables
15
among the regressors substantially improves the overall goodness of fit of the model, and the most inclusive specification has a maximum likelihood R² equal to 0.453, and it assigns the highest predicted probability to the strategy that a household actually selected for 54.2 per cent of the sample.
Income from farm and non-farm activities
Table 4 reveals that most of the estimated relationships have the expected sign. Participation into non-farm activities is more likely the larger is the number of working age members. The same occurs for the dependency ratio, which is statistically and economically significant especially in the first specification,31 where community variables are omitted. The age of the household head has the
expected negative impact on the probability to opt for the second livelihood strategy.32 Households
with a higher level of education are also more likely to opt for this strategy over no diversification, and this estimated effect is robust to the inclusion of community variables, revealing that this variable is not capturing the proximity to key infrastructures, including schooling facilities. Farm size has an estimated negative and significant coefficient, while other private assets (livestock and agricultural equipment) are not significant. The share of self-consumption is also not significant, while non-poor households are more likely to engage in non-farm activities.
One of the key findings is the statistical and economic significance of the three community variables, which influence the probability to participate in non-farm activities in the expected direction: proximity to market and hospitals have a positive and highly significant coefficient, while the opposite occurs, as expected, for the visit of extension officers. The variations in the yields of millet and groundnuts have the expected (opposite) signs, though the latter is only marginally statistically significant.
16 Income from farm activities and remittances
Table 5 reports the estimates for 𝜷 for the three proposed specifications. Consistently with the similarity in the levels of household incomes between the households who draw their incomes from agriculture only and those who also rely on remittances evidenced by Table 1, the model produces only a few significant coefficients, though most of them have the expected signs.
The coefficient of the number of working age members is negative and statistically significant, while neither of the two other demographic variables is significant. Primary education, farm size and the share of self-consumption are marginally significant and with the expected signs. As with respect to the previous strategy, private assets do not contribute to explain the choice of the preferred livelihood strategy.
The lack of significance for the market variable suggests that there are not systematic differences in proximity to goods markets between recipient and non-recipient households, while the presence of extension officers in the community reduces the probability to rely on remittances income. The proximity to a hospital is statistically significant only in the second specification. The estimated coefficient for the dummy for non-poor households is not significant, but its marginal effect is negative and significant, suggesting that non-poor households have a lower probability to opt for the third livelihood strategy. Interestingly, a positive variation in the yields of groundnuts reduces the probability to opt for migration, as it expands local opportunities for non-agricultural activities related to food processing.
[TABLE 5 AROUND HERE]
Incomes from all sources
The number of working age members negatively affects the relative probability to opt for a complete diversification, though this result does not survive to the inclusion of community variables and agricultural yields, and neither of the two other variables which describe the demographic
17
characteristics of the households is significant. The variables for education, and in particular secondary education which can allow rural-to-urban migration, have the expected positive signs. Privately owned assets are, once more, not significant, while a key role is played by community-level variables. Full diversification is less likely for households with a high share of self-consumption. Moderately poor households are more likely to opt for a full rather than for no diversification. The evolutions of crop yields have the expected signs, though they are only marginally significant.
[TABLE 6 AROUND HERE]
Comparative analysis
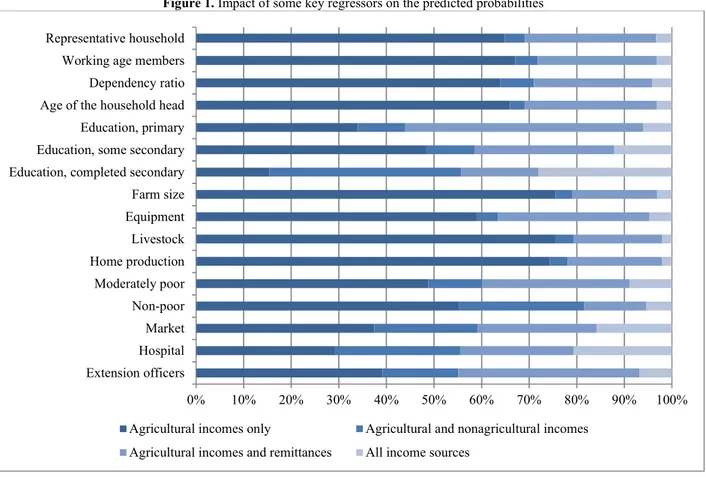
We used the estimates from specification (2) of the multinomial logit model to predict the probability 𝑝̂ to opt for each of the four strategies for a representative household in order to gain a better understanding of the economic significance of the independent variables.33 Then, we model
how the predicted probabilities 𝑝̂ are influenced by a variation in continuous variables by one standard deviation, or by a change in the value of dichotomous variables.
[FIGURE 1 AROUND HERE]
Figure 1 reports the results from this exercise. The four predicted probabilities stand at 𝑝̂ =0.65, 𝑝̂ =0.04, 𝑝̂ =0.28 and 𝑝̂ =0.03, so that this household has a much lower probability to diversify in off-farm activities, (1 − 𝑝̂ ), than the average sample frequency, which stands at 0.69. Figure 1 allows comparing the impact of the different regressors on the probability to opt for each strategy.34
It clearly shows that variations in education, poverty status and community variables imply larger changes in the predicted probabilities. Specifically, primary education is a key determinant of remittances receipt, increasing the predicted probability to receive remittances (𝑝̂ + 𝑝̂ ) by 16
18
percentage points; secondary education increases the likelihood of opting for diversification in non-farm activities alone (𝑝̂ ) by 36 percentage points.
The role of demographic characteristics as determinants of income diversification proved to be less important than expected, with their impacts on the predicted probabilities being only weakly economically significant. Among private assets, the role of farm size is not negligible, with one standard deviation increase in farm size being associated to a reduction in the predicted probability to receive remittances by 10.7 percentage points and to an equivalent increase in the predicted probability of having exclusively incomes from agricultural activities. A similar effect is found for an increase in the share of self-consumption, suggesting that those households that are able to cover their basic needs with their agricultural production have a lower incentive to opt for out-migration. Moving from extreme poverty to moderate poverty, the probability of no diversification decreases by 16 percentage points while the probability to be engaged in non-farm activities (𝑝̂ + 𝑝̂ ) increases by 12.7 percentage points. This probability further increases by 11.6 percentage points when the household moves above the moderate poverty line. The probability of receiving remittances increases when moving from extreme to moderate poverty while it decreases with a further improvement in income.
The role of community facilities in explaining income diversification can be hardly understated: access to a market increases the probability to be engaged in non-farm activities by 30 percentage points, while the corresponding figure for the access to a hospital is 39 percentage points, while these two variables have a limited impact on the probability to be engaged in agricultural incomes and remittances (𝑝̂ ). Conversely, the lack of extension services reduces the likelihood to opt for this strategy by 10.5 percentage points and the probability to be exclusively engaged in agricultural activities by 26 percentage points.
19
This article employs data from the GLSS4 to analyse the determinants of the livelihood strategies adopted by rural households in Northern Ghana through the estimation of a multinomial logit model. We simultaneously model the choices of opting for non-farm activities and migration, and we extensively use community level data and information on the evolution of cash and staple crops in the study area as explanatory variables.
Our results confirm the well-established role of education as a key asset to pursue off-farm employment opportunities and the role of farm size in reducing the probability to participate in non-farm activities. Poor households do not have sufficient resources to undertake non-non-farm activities and they rather resort to out-migration as a diversification strategy, which does not allow them to enjoy substantial improvements in their living conditions. Community-level assets are found to play an important role in shaping households’ choices, suggesting that a narrower focus on household-level characteristics would not allow having a full picture of the determinants of diversification strategies in rural areas. This finding suggests that policies aimed at strengthen the public assets of rural people can expand their job opportunities out of the farm sector, reducing the barriers to the non-farm activities.
1 See Rimmers (1992) and Hutchful (2002) for the economic policies, and their impact on growth,
followed by Ghana since independence and on the structural adjustment policies respectively.
2 See Barrios et al. (2006, 2010) for empirical analysis on the impact of weather anomalies on
internal migration and economic growth in Sub-Saharan African countries.
3 Northern Ghanaians have been heading southward during the dry season to take up agricultural
jobs, returning home in April or May, since the beginning of the twentieth century; most people move to the food crop frontier in the so called middle belt of the country and in the cocoa producing areas in the southwest (Berry, 2009; van der Geest, 2011), but the Greater Accra region has progressively become the largest recipient of internal migrants (GSS, 2005b). Lewis (1954) and
20
Harris and Todaro (1970) laid the theoretical foundations for the analysis of migration out of rural areas.
4 See Hart (1973) for an early contribution on informal economic activities in Ghana.
5 We use term off-farm diversification or activities when referring jointly to migration and local
nonfarm activities.
6 This paper refers implicitly to a unitary household model where the adopted livelihood strategy is
the outcome of a household-level decision; see, inter alia, Newman and Gertler (1994), Yang (1997) and Kimhi (1998) for the analysis of the determinants of individual labor supply decisions in developing countries.
7 An overview of the relevant literature is provided when describing the set up of our empirical
analysis.
8 The literature offers contrasting views on the consequences of these activities on income
inequality (see Canagarajah et al., 2001 and Senadza, 2011 on this).
9 The list of the 1984 population census enumeration areas, which contains population and
household information, was used in the process of sample design. The enumeration areas were first stratified according to the three ecological zones - coastal, forest and savannah - and then within each zone further stratification was conducted with respect to the rural or urban location.
10 Each enumeration area can contain more than one rural community, and the GSS does not
disclose, to ensure confidentiality, the information that would allow connecting households to their community; luckily, in the three Northern regions, we have only one community for each sampled rural enumeration areas.
11 The GLSS4 reports non-negligible rental incomes, but this mostly reflects the imputed value of
the rent for households who own their house, and in this view this income source is not included in our analysis; only 3.2 and 0.8 per cent of the households in our sample report income from renting livestock and equipment respectively.
21
12 The GSS includes (v) in the definition of agricultural income; still, the sale of processed crop
products requires an additional, and often substantial, effort besides the one devoted to farming, and it may requires the use of specific tools. The analytical choice to include the sale of processed crops among non-farm income sources is in line with Assan et al. (2009) and Gordon and Craig (2001), who include among nonfarm activities petty trading in cooked food and drinks; beer-brewing, fish processing, and rice parboiling are some examples of typical activities undertaken in Northern Ghana.
13 The extreme poverty line was set at 700,000 old Ghana cedis per adult equivalent per year
(approximately 260 US dollars) by the GSS on the basis of the cost of purchasing a basket of goods required to achieve minimal nutritional requirements, estimated at the prices prevailing in Accra in 1999 (GSS, 2000c); the GSS provides the factors required to account for variations in prices across space and time.
14 Poverty is highest among the food crop farmers in Ghana; around 58 per cent of the poor belong
to households primarily engaged in food crop cultivation, while around 24 percent of the poor come from households whose main income source is represented by nonfarm self-employment (GSS, 2000c).
15 The dependency ratio is defined as the number of dependent members, individuals aged below 14
or above 65 years, over household size; this variable is not correlated to the number of working age members, while it is positively correlated to the household size.
16 The same argument is suggested by some studies maintaining that households with fewer
children under the age of 5 are more likely to participate in migration (Adams, 1993; Lipton, 1980).
17 According to Davis et al. (2007), female-headed households have a lower propensity to
participate in nonfarm activities and they are more likely to receive both private and public transfers. Still, some studies have emphasized that the participation of women in nonfarm activities is on the rise in Sub-Saharan Africa: women take part in wholesale or retail trade and in manufacturing, in particular in the informal sector (Gordon and Craig, 2001). Bryceson (1999)
22
argues that gender barriers to participation in a wide set of activities are rapidly declining, and Marchetta (2011) suggests that a similar process is occurring in Northern Ghana. We have tried to include the gender of the household head in our model, but we did not find any significant result, so we decided not to include this variable in the final specification.
18 “The moderately poor group was found to migrate more than the other groups […] and migration
reduces the pressure on the resources of poor families, and is a way of building up investments. Remittances also help in land investments or building up entitlements by those who stay behind” (Yaro, 2002).
19 We define a household as moderately poor if its income is between the extreme poverty line and
the moderate poverty line, as non-poor if its income is above the moderate poverty line. The moderate poverty line was set as 900,000 old Ghana cedis per adult equivalent per year (approximately 334 US dollars).
20 Sixty-two per cent of the households with income from all sources receive transfers from urban
areas, while the corresponding figure for households with income from agricultural activities and remittances is 52.5 per cent.
21 The Ministry for Agriculture provides information on the quantity of millet and groundnuts
produced per hectare by year and district; using data on real prices of crops from GSS, we compute the real value of one hectare of cultivated land.
22 This variable is highly correlated with the presence of a junior secondary school and the
availability of public transports.
23 It is important to observe the large variability, reflected in the standard deviation, of the measures
of the evolution of the yields of the two crops.
24 We also included regional controls in x, to mop up any unobserved geographical factors which
influence the choice of the preferred livelihood strategies, but these additional regressors proved to be non-significant.
23
25 The variable is equal to: 0 if all members have less than six years of education (primary
education); 1 if at least one of the members has attended six years of schooling; 2 for some secondary education, and 3 if at least one of the members has completed secondary education.
26 Farm size refers to the size of the land owned or operated by household members.
27 As robustness check, we have run the model using the ratio between the value of
self-consumption and the poverty line, which probably represents a more precise measure of the ability of agricultural production to satisfy the basic consumption needs of the household; results, which are available from the author upon request, are qualitatively unchanged, though we are aware that concerns about endogeneity still apply.
28 We also omitted this variable from the three specifications, obtaining similar results to those
reported in the paper; these estimates are available from the author upon request.
29 We include these variables in just one specification as we acknowledge that their informational
content might be limited by measurement error.
30 For each specification, we tested the adequacy of the IIA assumption through the test proposed by
Hausman and McFadden (1984), which entails re-estimating the model on a smaller subset of alternatives; the results of the tests are supportive of the distributional assumptions which underpin the multinomial logit model.
31 Loosely speaking, an effect is deemed to have an economic significance when its size is such to
produce a non-trivial impact on the phenomenon of interest; a coefficient can be statistically significant while explaining only a limited part of the variability in the dependent variable (see McCloskey and Zilick, 1996).
32 If we also include age squared, we find an inverted-U shaped relationship between age and
diversification in nonfarm activities, with the turning point around 40 years.
33 We consider as representative household a household whose variables take the median values of
continuous variables and the value of the modal class for dummy and discrete variables. The representative household has two working age members, a dependency ratio equal to 0.5, with a 35
24
years old household head, and with all illiterate members; it operates 5.1 acres of land with no agricultural equipment, it owns livestock, and its home production covers 23 per cent of its consumption, with its income falling below the extreme poverty line. It resides in a community with no market or hospital, and farmers are periodically visited by extension officers.
34 For example, if our representative household lived in a community having access to a market,
then the predicted probability to be engaged in off-farm activities would rise to 0.63.
References
Abdulai, A. and Delgado, C.L., 1999. Determinants of Nonfarm Earnings of Farm-Based Husbands and Wives in Northern Ghana. American Journal of Agricultural Economics, 81 (1), 117-130. Ackah, C., 2012. Nonfarm employment and incomes in Rural Ghana. Journal of International
Development, forthcoming.
Adams, R.H., 2002. Non-farm income, inequality and land in rural Egypt. Economic Development and Cultural Change, 50 (2), 339-363.
Adams, R., 1993. The Economic and Demographic Determinants of International Migration in Rural Egypt. Journal of Development Studies 30, 146-167.
Adams, R. H., Cuecuecha, A. and Page, J., 2008. Remittances, consumption and investment in Ghana, World Bank Policy Research Working Paper Series No. 4515, Washington DC.
Anriquez, G., and Daidone, S., 2008. Linkages between Farm and Non-Farm Sectors at the Household Level in Rural Ghana. ESA Working Paper 08-01, Agricultural and Development Economics Division of the FAO, Rome.
Asmah, E., 2011. Rural Livelihood Diversification and Agricultural Sector Reforms in Ghana. Paper presented at the CSAE Annual Conference on Economic Development in Africa, , Oxford, March 2011.
25
Assan, J.K., Caminade, C., and Obeng, F., 2009. Environmental variability and vulnerable livelihoods: minimizing risks and optimizing opportunities for poverty alleviation. Journal of International Development, 21 (3), 403-418.
Barrett, C. B., Reardon, T. and Webb, P., 2001. Nonfarm income diversification and household livelihood strategies in rural Africa: concepts, dynamics, and policy implications. Food Policy, 26(4), 315-331.
Barrios, S., Bertinelli, L., and Strobl, E., 2006. Climatic change and rural-urban migration: The case of sub-Saharan Africa. Journal of Urban Economics, 60 (3), 357-371.
Barrios, S., Bertinelli, L., and Strobl, E., 2010. Trends in Rainfall and Economic Growth in Africa: A Neglected Cause of the African Growth Tragedy. The Review of Economics and Statistics, 92 (2), 350-366.
Berdegué, J., et al., 2001. Rural nonfarm employment and incomes in Chile. World Development, 29 (3), 395-409.
Berry, S., 2009. Property, Authority and Citizenship: Land Claims, Politics and the Dynamics of Social Division in West Africa. Development and Change, 40(1), 23-45.
Bryceson, D.F., 1999. African rural labour, income diversification and livelihood approaches: a long-term perspective. Review of African Political Economy, 26 (80), 171-189.
Canagarajah, S., Newman, C., and Bhattamishra, R., 2001. Non-farm Income, Gender, and Inequality: Evidence from Rural Ghana and Uganda. Food Policy, 26 (4), 405-420.
CEPA and ODI, 2005. Economic Growth in Northern Ghana. Revised report prepared for DFID Ghana, Center for Policy Analysis (CEPA) and Overseas Development Institute (ODI). Corral, L., and Reardon, T., 2001. Rural nonfarm incomes in Nicaragua. World Development, 29
(3), 427-441.
de Haan, A., et al., 2000. Migration and livelihoods: case studies in Bangladesh, Ethiopia and Mali. IDS Research Report, University of Sussex.
26
Davis, B., et al., 2007. Rural Income Generating Activities: a Cross-Country Comparison.
Background paper for the World Development Report 2008, Washington DC.
De Janvry, A., Saudolet, E., and Zhu, N., 2005. The role of non-farm incomes in reducing rural poverty and inequality in China. CUDARE Working Paper No. 1001, University of California, Berkeley.
De Janvry, A., and Saudolet, E., 2001. Income Strategies among Rural Households in Mexico: the role of off-farm activities. World Development, 29 (3), 467-480.
Dercon, S., (2002). Income Risk, Coping Strategies, and Safety Nets, World Bank Research Observer, 17 (2), 141-66.
Dietz, A.J., et al., 2004. Climate and Livelihood Changes in North East Ghana. In: A.J. Dietz, R. Ruben and A. Verhagen, eds. The impact of Climate Change on Drylands with focus on West Africa. Dordrecht: Kluwer Academic Publishers, 149-172.
Elbers, C., and Lanjouw, P., 2001. Intersectoral transfer, growth and inequality in rural Ecuador. World Development, 29 (3), 481-496.
Ellis, F., (2003). A livelihood approach to migration and poverty reduction. Paper commissioned by the DFID, London.
Escobal, J., 2001. The determinants of non-farm income diversification in rural Peru. World Development, 29 (3), 497-508.
GSS, 2005a. Ghana 2003 Core Welfare Indicators Questionnaire (CWIQ II) Survey Report – Statistical Abstract. Ghana Statistical Service (GSS), Accra.
GSS, 2005b. 2000 Population and Housing Census (Northern Region, Upper West Region, Upper East Region) – Analysis of District data and implication for planning. Ghana Statistical
27
GSS, 2000a. Core Welfare Indicators Questionnaire (CWIQ) Survey (1997). Ghana Statistical
Service (GSS), Accra.
GSS, 2000b. Ghana Living Standard Survey - Fourth Round. Ghana Statistical Service (GSS), Accra.
GSS, 2000c. Poverty Trends in Ghana in the 1990s. Ghana Statistical Service (GSS), Accra
Gordon, A., and Craig, C., 2001. Rural Non-farm activities and Poverty alleviation in Sub-Saharan Africa. Policy Series No. 14, Natural Resource Institute, University of Greenwich.
Harris, J. R. and Todaro, M. P., 1970. Migration, Unemployment and Development: A Two-Sector Analysis. American Economic Review, 60 (1), 126-142.
Hart, K. 1973. Informal Income Opportunities and Urban Employment in Ghana. The Journal of Modern African Studies, 11 (1), 61-89.
Hesselberg J., and Yaro, J.A., 2006. An assessment of the extent and causes of food insecurity in northern Ghana using a livelihood vulnerability framework. GeoJournal, 67 (1), 41-55.
Hausman, J.A., and McFadden, D.L., 1984. A Specification Test for the Multinomial Logit Model. Econometrica, 52 (5), 1219–1240.
Hutchful, E., 2002. Ghana’s Adjustment Experience – The paradox of Reforms. United Nations Research Institute for Social Development, Woeli Publishing Service, Accra.
Jonasson, E., 2005. Nonfarm employment as rural poverty exit path? Evidence from Peru. Proceedings of the German Development Economics Conference, Kiel.
Khor, M and Hormeku, E.T., 2006. The impact of globalisation and liberalisation on agriculture and small farmers in developing countries: the experience of Ghana. Third World Network. Kimhi, A., 1998. Institutional environment, ideological commitment, and farmers’ time allocation:
28
Knudsen, M.H., 2007. Making a Living in the Cocoa Frontier, Western Ghana: Diversifying Incomes in a Cocoa Economy. Danish Journal of Geography, 107 (2), 29-44.
Kothari, U., 2002. Migration and Chronic Poverty. Chronic Poverty Research Centre Working Paper No. 16, University of Manchester.
Lanjouw, P., Quizon, J., and Sparrow, R., 2001. Non-agricultural earnings in peri-urban areas in Tanzania: evidence from household survey data. Food Policy, 26 (4), 385-403.
Lewis, W.A., 1954. Economic Development with Unlimited Suppliers of Labour. The Manchester School, 22 (2), 139-191.
Lipton, M., 1980. Migration from Rural Areas of Poor Countries: The Impact on Rural Productivity and Income Distribution. World Development, 8 (1), 1-24.
Marchetta, F., 2011. On the move. Livelihood Strategies in Northern Ghana. CERDI Working Paper No. 2011/13, University of Auvergne.
Mendola, M., 2008. Migration and technological change in rural households: Complements and substitutes. Journal of Development Economics, 85 (1-2), 150-175.
McCloskey, D.N., and Ziliak, S.T., 1996. The Standard Error of Regressions. Journal of Economic Literature, 34 (1), 97-114.
McDowell, C., and de Haan, A. 2002. Migration and Sustainable Livelihoods: a critical review of the literature. IDS Working Paper No. 65, University of Sussex.
Morduch, J., and Sicular, T., 2002. Rethinking inequality decomposition, with evidence from rural China. The Economic Journal, 112 (476), 93-106.
Newman, J.L. and Gertler, P.J., 1994. Family productivity, labor supply, and welfare in a low income country. Journal of Human Resources 29 (4), 989-1026.
Olatomide W. O., Awoyemi, T.T., 2012. Determinants of migration and remittances in rural Nigeria, Journal of Development and Agricultural Economics, 4(7), pp. 191-198.
29
Obeng, F.K., 2005. Things are hard for us, but we see a way out of them. Mimeo, University of
Amsterdam.
Reardon, T. et al., 2006. Household income diversification into Rural Nonfarm Activities. In S.Haggblade, P. Hazell and T. Reardon (eds), Transforming the Rural Non-Farm Economy, John Hopkins University Press, Baltimore.
Reardon, T. and Barrett, C., 2000. Asset, activity and income diversification among African agriculturalists: some practical issues. Working Papers 14734, Cornell University, Department of Applied Economics and Management.
Reardon, T., 1997. Using evidence of household income diversification to inform study of the rural nonfarm labor market in Africa. World Development, 25 (5), 735-747.
Rimmer, D., 1992. Staying Poor: Ghana’s Political Economy (1950-1990). Pergamon Press.
Rogaly, B., and Rafique, A., 2003. Struggling to save cash: seasonal migration and vulnerability in West Bengala, India. Development and Change, 34 (4), 659-681.
Rwelemira, J.K., et al., 2000. Poverty and Inequality Profile of Households in the Northern Province of South Africa. Agrekon, 39 (4), 529-537.
Schrieder, G., and Knerr, B., 2000. Labour Migration as a Social Security Mechanism for Smallholder Households in Sub-Saharan Africa: the Case of Cameroon. Oxford Development Studies, 28 (2), 223-236.
Senadza, B., 2011. Does Non-farm Income Improve or Worsen Income Inequality? Evidence from Rural Ghana. African Review of Economics and Finance, 2 (2), 104-121.
Smith, D.R., 2000. The Spatial Dimension of Access to the Rural Non-Farm Economy. Mimeo, Natural Resources Institute, Chatam.
Smith, D.R., et al., 2001. Livelihood diversification in rural Uganda: determinants of difference. Food Policy, 26 (4), 421-435.
30
Songstore, J., 2003. Regional Development in Ghana. The theory and the reality. Whoeli publishing services, Accra.
Taylor, J.E., and Yunez-Naude, A., 2000. The returns from schooling in a diversified rural economy. American Journal of Agricultural Economics, 82 (2), 287-297.
Theil, H., 1967. Economics and Information Theory. Chicago: Rand McNally and Co.
Udry, C., 1995. Risk and Saving in Northern Nigeria. The American Economic Review, 85 (5), 1287-1300.
van der Geest, K., 2011. North-South Migration in Ghana: What Role for the Environment. International Migration, 49 (S1).
van der Geest, K., 2003. Rural Migration and livelihood security in Ghana. International Workshop on Migration and Poverty in West Africa, University of Sussex.
Winters, P., Davis, B., and Corral, L., 2002. Assets, activities and income generation in rural Mexico: factoring in social and public capital. Agricultural Economics, 27 (2), 139-156. World Bank (2007), World Development Report 2008 – Agriculture for Development, Washington
D.C.
Yang, D.T., 1997. Education and Off-Farm Work, Economic Development and Cultural Change, 45 (3), 613-632.
Yaro, J.A., 2006. Is deagrarianisation real? A study of livelihood activities in rural northern Ghana. Journal of Modern African Studies, 44 (1), 125-156.
Yaro, J.A. 2002. The poor peasant: one label, different lives: the dynamics of rural livelihood strategies in the Gia-Kajelo community, Northern Ghana. Norwegian Journal of Geography 56(1), 10-20.
31
Yeboah, R.N., 2005. Climate variability and small farmer’s economic decision making processes: the case of Bongo district, Upper East Region, Ghana. Ph.D. dissertation, University of Ghana.
Table 1. Income and extreme poverty in 1998/1999, by livelihood strategy
Livelihood strategy capita income Median per Extreme poverty Observations
All households 686,285 64.6 600
Agricultural income only 436,173 75.4 209 Agricultural and non-agricultural income 1,169,576 52.1 211 Agricultural income and remittances 389,943 76.7 98
All income sources 844,437 60.9 82
Notes: incomes are expressed in old Ghana cedis; the exchange rate with the US dollar stood at 2,312 and 2,666 cedis per dollar in 1998 and 1999 respectively; the second data column reports the share of households below the extreme poverty line of 700,000 cedis per adult equivalent. Sampling weights used.
Source: Author’s calculation based on data from GLSS4.
Table 2. Contribution of income sources to inequality and total income Contribution to Income sources inequality Income income Total
Agricultural income 45.0 61.2
Income from employment 39.0 3.9 Nonfarm self-employment income 18.0 15.9
Remittances -1.0 12.0
Rental income -0.8 4.5
Incomes from other sources -0.1 2.5 Notes: income inequality measured with the Theil index.
32
Table 3. Descriptive statistics
Variables households All incomes only Agricultural
Agricultural and non-agricultural incomes Agricultural incomes and
remittances All income sources Working age members (1.25) 2.58 (1.37) 2.72 (1.20) 2.75 (1.26) 2.18 (0.93) 2.28 Dependency ratio (0.22) 0.47 (0.24) 0.44 (0.18) 0.48 (0.25) 0.47 (0.24) 0.48 Age of household head (13.57) 44.19 (14.23) 45.09 (11.80) 42.58 (15.11) 45.54 (14.47) 44.93 No Education 61.33 77.86 47.90 71.95 49.65 Primary Education 12.72 5.24 18.74 13.63 12.11 Some Secondary Education 22.00 16.25 25.91 13.79 32.75 Completed Secondary Education 3.95 0.65 7.44 0.63 5.49 Farm size (21.90) 10.13 (30.94) 13.37 (19.04) 10.26 (6.90) 6.31 (14.27) 7.13 Equipment 22.90 19.36 25.97 19.13 26.47 Livestock 68.35 63.88 68.73 70.72 74.17 Home production (0.18) 0.22 (0.18) 0.25 (0.19) 0.22 (0.15) 0.18 (0.15) 0.17 Extremely Poor 64.60 75.42 52.12 76.73 60.85 Moderately Poor 10.90 6.84 11.66 10.36 17.98 Non Poor 25.50 17.74 36.22 12.92 21.18 Market 45.29 27.09 58.26 34.86 61.36 Hospital 14.52 9.84 16.01 11.35 23.84 Extension officers 59.94 65.30 52.08 60.76 67.78 Millet 5,379.71 (760.49) 5,590.94 (695.29) 5,230.51 (779.90) 5,493.22 (757.70) 5,197.56 (726.00) Millet ratio (0.31) 1.07 (0.40) 1.15 (0.14) 1.02 (0.34) 1.11 (0.29) 1.02 Groundnut (2,764.24) 11,117.67 (2,878.42) 11,496.08 (3,178.49) 11,208.92 (1,306.73) 10,610.27 (2,395.22) 10,636.60 Groundnut ratio (0.43) 1.41 (0.37) 1.28 (0.41) 1.53 (0.41) 1.29 (0.50) 1.46 Observations 600 209 211 98 82
Notes: standard deviation in parenthesis; sampling weights used; the variables for groundnuts and millet are measured by the product of agricultural yields per hectare times the real price (in hundreds of old Ghana cedis). Source: Author’s calculation based on data from GLSS4 and data on yields from the Ministry of Agriculture.
33
Table 4. Multinomial logit model, agricultural and non-agricultural income
(1) (2) (3) Variables Coefficient (z test) Marginal Effect Coefficient (z test) Marginal effect Coefficient (z test) Marginal effect Working age members 0.227 (2.04)** 0.076 (4.22)*** 0.344 (2.21)** 0.020 (2.07)** 0.323 (2.16)** 0.022 (1.90)* Dependency ratio (4.11)*** 2.490 (4.05)*** 0.400 (3.01)*** 2.464 (1.94)* 0.102 (2.60)*** 2.330 (1.72)* 0.106 Age of household head -0.020 (-2.33)** -0.003 (-2.31)** -0.023 (-2.15)** -0.000 (-1.44) -0.023 (-2.44)** -0.001 (-1.44) Primary Education (3.49)*** 1.703 (2.40)** 0.189 (3.68)*** 1.516 (1.39) 0.058 (3.37)*** 1.517 (1.00) 0.045 Some Secondary Education 1.112 (3.25)*** 0.118 (1.83)* 1.168 (4.51)*** 0.058 (2.13)** 0.960 (3.97)*** 0.040 (1.73)* Completed Secondary Education 3.569 (4.39)*** (2.77)*** 0.387 (2.92)*** 3.702 (2.16)** 0.361 (3.10)*** 3.622 (2.24)** 0.321 Farm size (-2.79)*** -0.016 (-1.10) -0.001 (-2.66)*** -0.014 (-0.83) -0.000 (-3.45)*** -0.014 (-0.51) -0.000 Equipment (0.85) 0.267 (0.09) 0.003 (0.41) 0.156 (0.20) 0.002 (0.12) 0.039 (-0.04) -0.000 Livestock (0.39) 0.103 (-0.56) -0.229 (0.55) 0.217 (0.18) 0.002 (0.83) 0.363 (0.60) 0.009 Home production (-0.82) -0.523 (1.05) 0.102 (-1.34) -1.363 (-0.49) -0.019 (-1.18) -1.278 (-0.54) -0.027 Moderately Poor (3.35)*** 1.238 (2.34)** 0.171 (2.59)** 1.270 (1.62) 0.070 (2.80)*** 1.409 (1.94)* 0.091 Non Poor (5.20)*** 1.746 (6.74)*** 0.416 (3.99)*** 2.000 (2.40)** 0.222 (3.56)*** 1.958 (2.53)** 0.240 Market (4.25)*** 2.186 (3.46)*** 0.174 (4.29)*** 2.194 (3.54)*** 0.204 Hospital (3.91)*** 2.631 (2.48)** 0.221 (2.89)*** 2.348 (1.85)* 0.214 Extension officers (-4.13)*** -1.838 (-2.29)** -0.117 (-2.94)*** -1.557 (-1.43) -0.077 Millet (-0.20) -0.000 (-0.39) -0.000 Millet ratio (-2.33)** -1.854 (-1.38) -0.072 Groundnut (1.36) 0.000 (1.77) 0.000 Groundnut ratio (1.90)* 1.012 (1.50) 0.048 Observations 600 600 600 Correct predictions 43.20 49.73 54.19 pseudo R² 0.286 0.402 0.453
Notes: ***, ** and * denote significance at the 1, 5 and 10 percent respectively; standard errors adjusted for clustering at the community level in parenthesis; sampling weights used. The marginal effects are computed at the median values of continuous variables, and at the value of the modal class for dummy and discrete variables; agricultural income only is the base outcome. Source: Author’s calculation based on data from GLSS4 and data on yields from the Ministry of Agriculture.