HAL Id: hal-01966844
https://hal.inria.fr/hal-01966844
Submitted on 30 Jan 2020
HAL is a multi-disciplinary open access
archive for the deposit and dissemination of
sci-entific research documents, whether they are
pub-lished or not. The documents may come from
teaching and research institutions in France or
abroad, or from public or private research centers.
L’archive ouverte pluridisciplinaire HAL, est
destinée au dépôt et à la diffusion de documents
scientifiques de niveau recherche, publiés ou non,
émanant des établissements d’enseignement et de
recherche français ou étrangers, des laboratoires
publics ou privés.
A Formal Approach for the Design of a Dependable
Perception System for Autonomous Vehicles
Yrvann Emzivat, Javier Ibañez-Guzmán, Hervé Illy, Philippe Martinet, Olivier
Roux
To cite this version:
Yrvann Emzivat, Javier Ibañez-Guzmán, Hervé Illy, Philippe Martinet, Olivier Roux. A Formal
Approach for the Design of a Dependable Perception System for Autonomous Vehicles. ITSC 2018
-21st IEEE International Conference on Intelligent Transportation Systems, Nov 2018, Maui, United
States. pp.1-8, �10.1109/ITSC.2018.8569903�. �hal-01966844�
A Formal Approach for the Design of a Dependable Perception System
for Autonomous Vehicles
Yrvann Emzivat
1,2, Javier Ibanez-Guzman
1, Herv´e Illy
1, Philippe Martinet
2,3and Olivier H. Roux
2Abstract— The deployment of autonomous vehicles is contin-gent on trust in their ability to operate safely. However, the assurance that they can accommodate failures and changing weather conditions to maintain limited functionality requires the development of rigorous design and analysis tools. This paper presents a formal approach for the design of multi-sensor data fusion systems that support adaptive graceful degradation through the smart use of sensor modalities. A coloured probabilistic time Petri net is used to model known algorithms in a multi-sensor fusion scheme. The specification of safety requirements in terms of confidence levels conditions the outcome of the reachability analysis. The characteristics of a credible solution are then provided to the embedded safety module as support for online reconfiguration and decision making tasks. The validity of the approach is illustrated through an example outlining the capabilities of currently available perception systems, for the purpose of deploying autonomous vehicles on public roads.
I. INTRODUCTION
The benefits of autonomous driving can be significant, both in terms of comfort and safety. They range from the reduction of fatigue induced by traffic congestion to the re-duction of car accidents and loss of life, often associated with human error. Other benefits include improved accessibility and productivity, as well as the potential for time and fuel savings. However, designing an Automated Driving System (ADS) is a complex endeavour that poses new dependability challenges. Strong assurance in its ability to operate safely is needed before autonomous driving can become an enticing experience for all.
Both hazards and failures can jeopardise safety. Hazards refer to states of the system that will inevitably lead to an accident (or loss event) when certain conditions in the environment of the system are met. Failures are the result of unfulfilled system requirements. They occur when the system or one of its component is unable to perform its intended function for a specified period of time, under specified environmental conditions. An Automated Driving System must respond appropriately to a component or sys-tem failure and to deteriorating environmental conditions. It must position itself correctly and in good time, take proper observation, react promptly and properly to hazards, adjust speed and comply with road traffic control. These necessities provide incentive for the development of a safety module 1Renault S.A.S., Guyancourt, 1 avenue du Golf, 78288 Guyancourt,
France
2Ecole Centrale de Nantes, LS2N – UMR CNRS 6004, 1 rue de la No¨e´
BP 92101, 44321 Nantes, France
3INRIA Sophia Antipolis, 2004 route des Lucioles, 06902 Sophia
An-tipolis, France
that understands the system’s capabilities and forces it into a suitable degraded mode whenever necessary.
The quality of sensors and perception algorithms must be properly assessed, as it conditions the system’s ability to perceive the driving environment. An ADS acting on erroneous or incomplete data is prone to making decisions that can lead to hazardous situations. Yet sensors are affected by changing weather and lighting conditions. The concern for predictable behaviour, safe operation and mission success motivates the need to design multi-sensor data fusion systems from a safety perspective.
To the best of our knowledge, efforts towards building a flexible safety module as support for online reconfiguration of perception systems are few. While conceptual frameworks that provide adaptive graceful degradation do exist [1], the development of a standard evaluation framework to assess the performance of data fusion algorithms requires further investigation. A fuzzy rule based strategy was proposed [2] in an attempt to evaluate the dependability of a set of embedded sensors. A real-time, multi-sensor architecture for the fusion of delayed observations was later presented [3] for the design and implementation of data fusion applications. The handling of sensor uncertainty in systems with formal specifications has also been studied in recent years. Probabilistic model checking techniques were used to compute the probability with which an automatically synthesised controller satisfies a set of high-level specifications [4]. Linear temporal logic was used to reduce a stochastic control problem to a deterministic short path problem [5]. Yet in spite of these preliminary efforts, the particular problem of ADS perception system design remains largely unexplored.
A formal framework is presented for the design of multi-sensor data fusion systems. The aim is two-fold. First, a tool for the design of a perception system that inherently supports adaptive graceful degradation is presented. Second, the rules that are to be applied by the underlying safety module during operation are generated. They enable efficient re-allocation of ressources when a sensor or a processing board failure occurs. By specifying the desired properties of the perception system in a formal language, the extensive set of tools of the formal methods community can be used to synthesise one that meets these requirements. Its characteristics are expressed in a language that the safety module can understand. This allows for adaptive graceful degradation and efficient online reconfiguration.
Automated fusion is part of ongoing research in data fusion. It has led to similar attempts within formal logic and category theory frameworks. For example, an outline
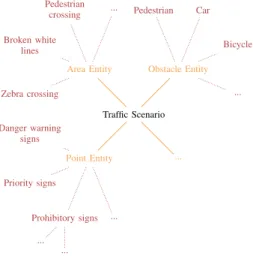
Traffic Scenario Point Entity Danger warning signs Priority signs Prohibitory signs ... ... ... ... Obstacle Entity ... Bicycle Car Pedestrian Area Entity ... Pedestrian crossing Broken white lines Zebra crossing
Fig. 1. Ontology-based scene representation [10]
of a formalisation of classes of information fusion sys-tems was proposed in terms of category theory and formal languages [6]. A formal approach was also presented [7] to tackle the problem of synthesising algorithms that sat-isfy templates for information fusion. The approach that is proposed here relies on the construction of a high-level probabilistic time Petri net containing inhibitor arcs and read arcs. The model integrates concurrency, real-time constraints and probabilities. Petri nets have been successfully used for the study of real-time scheduling problems [8] and for the design of automated manufacturing systems, both in their simple and high-level form [9].
The remainder of the paper is organised as follows. Section II presents the architecture of the safety module. The challenges of data fusion are described in Section III. The approach relies on the construction of a Petri net model whose formalism we introduce in Section IV. The problem is modelled in Section V. Experimental results are provided in Section VI.
II. SAFETY MODULE A. Characteristics of the Environment
Let us consider the problem of designing an ADS that starts from point A and whose mission consists in reaching a certain location B. The goal is to provide the means for it to take proper observation in the situations that it may encounter along the way. The vehicle may be confronted to a variety of road types, described by a number of lanes, their clas-sification (highway, street), their surface quality (dirt, con-crete), their curvature and by the presence of intersections, interchanges and other features, such as railroad crossings, bridges and tunnels. It may cross an urban or suburban area, encounter parks, playgrounds, schools, hospitals or animal preserves. In practice, such information is stored in the navigation map, but it can contain errors, with respect to the road geometry for example. It is assumed here that the ADS operates in an environment whose characteristics are known. Studying these characteristics enables us to determine what is needed from the perception system. The relevant ones
Perception system
Safety module sensor availability
available computing power
weather conditions context
resource allocation choice of a
degraded mode
Fig. 2. The embedded safety module
are compiled into a hierarchical tree structure (Fig. 1) in such a way that each node is an instance of the class that its parent node represents. A confidence value or vector is affected to each node of the tree to represent the level of performance that the system must achieve. These confidence values are context-dependent. Indeed, while the loss of pedestrian detection may not have great consequences when driving on a highway, this is not the case for an autonomous vehicle driving in an urban area. Confidence values can be expressed in a number of ways (percentages, probabilities, discrete levels) and are an indication of the performance of the system with regards to detection, classification and tracking tasks.
B. Architecture of the Safety Module
During operation, the safety module judges the perception system and continually evaluates its capabilities by monitor-ing sensor availability and environmental conditions (Fig. 2). The safety module can trigger different configurations using different sensors to recover from a failure. However, if every possible configuration leads to poor performances, the safety module is notified and will either force the vehicle to a stop or ask a human driver to take over.
The role of the safety module also encompasses the allocation of computing power in case of a processing board failure [11]. This means it must force the system into a de-graded mode that maintains a sufficient level of performance, with but a few of the most relevant algorithms running. It is therefore important to know how sensor failures, degrading weather conditions and computing power loss affect the capabilities of the system. Knowing that a sensor has failed is irrelevant if the ADS is clueless about the way it affects its capabilities. This motivates the need to design the perception system of an ADS from a safety perspective.
III. PERCEPTION SYSTEM
The purpose of the perception system is to interpret and understand the vehicle’s surroundings. Embedded sensors gather data that is to be delivered to the sensor fusion components for processing. The recovered features are used to build an explicit representation of the world as the vehicle knows it. An ontology-based scenario description is used for knowledge representation [10]. In particular, the perception system detects obstacles, classifies them and measures their position, speed and orientation. Additional information can be obtained through various communication channels [12].
A key shortcoming to the development of the safety module lies in the lack of publicly available information pertaining to the performance of existing perception systems. The majority of published studies are conducted under op-timal weather conditions, with no guarantee of robustness [13]. More importantly, many sensors come with proprietary black-box on-board processing whose characteristics are not made readily available.
A. Influence of the Environment
Weather conditions have a significant impact on the perfor-mance of autonomous vehicles. Light conditions (daylight, nighttime, dusk, dawn), cloud cover (clear, cloudy, sunny), precipitation (rain, hail, snow) and fog (patch fog, ground fog) are but a few relevant characteristics of the environment that need to be considered when designing the perception system of an ADS.
Sun glare and fog blind cameras. Smog generates ghost targets. Snow and heavy rain hide features of the environment that enable the ADS to distinguish the road (e.g. lane markings). In general, lidar is brittle to laser blockages, airborne precipitation and wet surfaces, whereas dark lighting conditions and glare mostly affect cameras by lowering image contrast. Radars display best robustness to all weather conditions, but suffer from low angular resolution and usu-ally provide less information about object shape, size and classification than lidars or cameras [13].
B. Sensor Fusion
Fusion is the integration of information from multiple sources in order to produce specific and comprehensive unified data about an entity. The automotive industry is targeted towards a large-scale, cost-sensitive market, which is why the use of low-cost sensors in a multi-level fusion scheme is an interesting prospect for the improvement of accuracy and robustness. In principle, one can expect more specific inferences from the fusion of multi-sensor data over single source data. In practice however, the fusion may actually produce worse results than could be obtained with the most appropriate sensor available.
C. Data Imperfection
The imperfection of data is a fundamental problem of data fusion systems. It has led to various mathematical theories. An approach based on credibility was used to model sensor information while an occupancy grid framework was designed to manage different sources of uncertainty [14]. A probabilistic approach capable of dealing with uncertainties when modelling the environment as well as detecting and tracking dynamic objects was proposed [15] for the improve-ment of safety. The Dempster-Shafer theory, also known as the theory of belief functions, is a generalisation of the Bayesian theory of subjective probability. It was successfully applied in a vehicle detecting system to increase detection accuracy [16]. Road-matching methods designed to support real-time navigation functions using belief theory were also proposed [17].
Data imperfection is but one of a number of issues that make data fusion a challenging task. Data correlation, data inconsistency and disparateness of data form are challenging problems that must also be investigated when designing Automated Driving Systems for autonomous driving.
IV. PETRI NETS
The proposed approach relies on the construction of a high-level probabilistic time Petri net that includes read arcs and inhibitor arcs. This model was specifically designed for the particular problem of modelling uncertainties in real-time systems [18]. The general idea is to build a graph that describes every possible combination of sensors and algorithms into a fusion scheme. Each path in the graph corresponds to a possible scheduling of known algorithms. Confidence values are added along the paths to guide the choice of an appropriate fusion scheme.
A. Simple Probabilistic Time Petri Nets
Let I(Q+) denote the set of real intervals that have
ratio-nal or infinite endpoints and let DistX be the set of discrete
probability distributions over a countable set X. For a given set X, let P(X) denote the power set of X. A probabilistic time Petri netis a quintuple N = (P, T, P re, P ost, I) where P is a finite, non-empty set of places, T is a finite set of transitions such that T ∩ P = Ø, P re : T → NP is the
backward incidence mapping, P ost : T → P(DistNP) is
the forward incidence mapping, and I : T → I(Q+) is a
function that assigns a firing interval to each transition. An element of NP is called a marking and denotes a
distribution of tokens in the places of the net. Time Petri nets and probabilistic time Petri nets share the same pre-conditions for the firing of transitions. In a probabilistic time Petri net however, the output of tokens is randomised according to the enhanced forward incidence marking. In order to convey the notion of urgency, strong time semantics are used. In other words, time can flow as long as otherwise enabled transitions are not disabled in the process.
B. Coloured Probabilistic Time Petri Nets (cPTPN) Simple and coloured Petri nets have the same compu-tational power. In a simple Petri net, tokens are indistin-guishable. Since every logical combination of algorithms is considered for the fusion of information at various levels, it is best to resort to a coloured model in which individual tokens can be identified. Else the formal model ends up being cluttered. Fortunately, each high-level probabilistic time Petri net can be translated into a simple probabilistic time Petri net that has the same behaviour. This enables the use of model-checking tools such as Romeo [19] for the verification of properties.
C. Extension with Additional Types of Arcs
Finally, read arcs and inhibitor arcs [20] are added to the aforementioned model. These arcs link a place to a transition. An inhibitor arc imposes the precondition that the transition may only fire when the place is empty. A
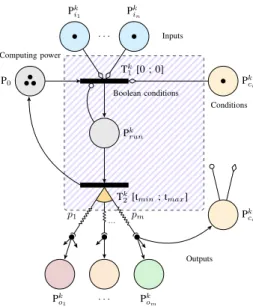
P0 Pk i1 P k in Pk run Pk o1 P k om Pk ci Pk co Tk 1[0 ; 0] Tk 2[tmin; tmax] ··· p1 pm Computing power Inputs Outputs Conditions · · · · · · Boolean conditions
Fig. 3. Generic model of an algorithm ak
read arc imposes the precondition that the transition may only fire when the place is not empty. The resulting model presents a number of advantages. It natively integrates time, concurrency and probabilities, yet it still benefits from the concision and expressive power of Petri nets. Firing intervals allow for the modelling of computation time, while the randomisation of tokens allows for the modelling of data reliability. Reachability analysis then provides an exhaustive list of sensor fusion schemes and their characteristics.
V. THE PROPOSED MODEL A. Formal Model of an Algorithm
A pattern for the modelling of algorithms that can be used in a fusion scheme is defined (Fig. 3). It encompasses algorithms for signal processing, pattern processing, feature extraction, sensor data fusion, feature fusion, decision fusion, voting and other algorithms that can be used in order to provide the vehicle with information about the relevant features that have been selected in section II.
The tokens in P0represent the available computing power
in the system. When Tk
1 is fired, one token is removed from
P0 and placed into Prunk . This illustrates the fact that the
algorithm is running. The inhibitor arc that links Pk runto T1k
expresses the fact that no more resources are allocated to the task when it is running. As stated earlier, strong time semantics are used. Resources are allocated whenever an algorithm is ready to run, which is why the timing constraints of T1kare [0, 0]. The algorithm is expected to run for a certain
period of time, represented by the timing constraints of T2k.
An algorithm only runs if certain conditions are met. For example, it may not be possible to process data from a sensor that has failed. A feature level fusion algorithm cannot be used when a single piece of data is available. This is expressed by the presence of read-arcs that link Pk
ci and Pk i1, ..., P k into T k
1. These tokens only act as firing conditions
and are not removed when Tk
1 is fired.
Sensors
Raw sensor data
Features
Attributes Environment
Signal processing nodes
Feature extraction nodes
Pattern processing nodes Resources Sensor level fusion nodes Feature level fusion nodes Other fusion nodes
Fig. 4. Overview of the complete model
Pk o1, ..., P
k
om represent the output of the algorithm. If the
inputs and outputs of the algorithm have the same dimension, then it is possible to merge some Pk
o with some Pik. A
discrete probability distribution of coloured markings is used to represent the fact that the output has a certain probability of being of a certain quality (P
1≤j≤mpj = 1). It can also
be used to express the fact that the algorithm did not generate any output.
Once the algorithm terminates, the resource is removed from Prunk and made available in P0 once again. A given
algorithm can allow or prevent other algorithms from run-ning. This is represented by output arcs leading to place Pk
co.
For example, if the algorithm ak only runs once, a token is
generated in a place that links back to Tk
1 with an inhibitor
arc. Additional parameters can be used to provide boolean conditions for the firing of transitions. The complete model (Fig. 4) includes every algorithm that constitutes a candidate in the design of a multi-sensor fusion scheme.
B. Confidence Levels
The performance of a data fusion system is dependent on the quality of the input data and the efficiency of the fusion scheme. However, there is no standard and well-established evaluation framework to assess the performance of data fusion algorithms as of yet [21], despite attempts towards defining benchmarking procedures for intelligent robots [22]. The degree of confidence in the data can be described in terms of attributes such as reliability and credibility [23]. The literature work on measures of performance is rather extensive and includes a wide variety of measures. Capturing these dimensions in a comprehensive, unified model can be difficult, as there are trade-offs between these competing aspects. A fair indicator needs to be adapted to the given context or situation.
In the following, the performance of the system is artifi-cially represented by a confidence level, which can take any value between 0 and 1. More precisely, a confidence value is assigned to each node of the tree described in Fig. 1. These
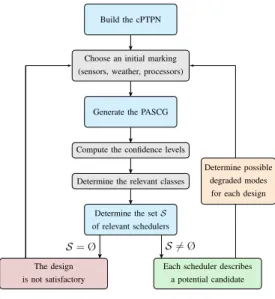
Build the cPTPN
Choose an initial marking (sensors, weather, processors)
Generate the PASCG
Compute the confidence levels Determine the relevant classes
Determine the set S of relevant schedulers
S = Ø S 6= Ø
The design is not satisfactory
Each scheduler describes a potential candidate
Determine possible degraded modes for each design
Fig. 5. The proposed approach
values represent what the perception system must achieve. Each one of these nodes is represented by a coloured place in the proposed Petri net model. The presence of a token in such a place means that some information about that feature has been generated. The presence of multiple tokens means that the corresponding information has been generated through different means during the fusion process. The information can be conflicting or not.
In practice, a confidence measure is given to the infor-mation carried by each token. The transitions of the net are enhanced with a set of rules that are used to compute the level of confidence of the output tokens based on the confidence given to the input information. The performance of the system with regards to one item is deemed insufficient if no configuration of sensors can achieve it. In other words, no path in the state space of the net leads to a coloured marking for which a token in the place of interest has a high enough confidence level, with high enough probability. C. The determination possible candidates
A state of the net is said to be reachable if there exists a sequence of transition relations that leads from one of its initial states to that particular one. Proving that a given set of states can be reached with a certain probability is at the core of the probabilistic real-time reachability problem for probabilistic time Petri nets [18]. Quantitative reachability properties provide statements regarding the fact that the probability of achieving a certain desired system behaviour is above a given threshold while the probability of reaching certain unwanted states is sufficiently small.
In practice, the probabilistic atomic state class graph (PASCG) of the net is built to capture every possible be-haviour of a perception system in a finite and compact graph, which takes the form of a Markov decision process. In order to determine a perception system that performs adequately under optimum conditions, only the classes of the graph that have a confidence vector that is greater than what must be achieved are considered. The paths leading to these classes
describe a set of algorithms that have been used to achieve that level of confidence. The schedulers whose paths lead to these classes with a probability that is higher than some given threshold are the ones used to determine what sensors and what algorithms to use.
In order to evaluate the capabilities of the resulting per-ception system when failures occur, a token is removed from one of the places that represent the availability of a sensor. The probabilistic atomic state class graph of the resulting marked Petri net is then computed once more. Similarly, to evaluate the capabilities of the chosen perception system when weather conditions deteriorate, the rules associated to the transitions for the computation of trust levels are modified. Thus the safety module can handle a continuous spectrum of conditions. If the resulting fusion scheme is satisfactory, then a suitable degraded mode has been found. The rules that are to be used by the safety module during operation are extracted from this information. The effect of failures, weather conditions and computing power loss are studied offline. The parameters that are needed for real-time online reconfiguration of the perception system are generated automatically.
The desired property of the perception system can be formulated in natural language as follows: “Given these possible weather conditions and these embedded sensors, can the ADS perform adequately if less than n of these sensors fail and less than m of these processors fail?” This property can be expressed in a more formal manner: “Is there a path in the probabilistic atomic state class graph of the net that leads to a coloured marking with a probability greater than pad, such that the resulting confidence value is greater than
the minimum confidence value to achieve, when the initial marking is such that up to n tokens are removed from the places that describe sensor availability, m tokens are removed from place P0, and any combination of rules representing
changing weather is chosen for the computation of trust levels?” Such a property can be expressed with modal logic and verified formally. The approach can be summarised by the graph that is represented in Fig. 5. The proposed model and the approach that is used to determine if the system is robust to failures are the main contributions of this article.
VI. EXPERIMENTALRESULTS
A. Problem formulation
The objective of this section is to provide an example showing how the proposed approach can be of value for the design of a dependable Automated Driving System. Let us study the feasibility of designing an ADS-equipped shuttle running from the Renault bus station in Guyancourt to the railway station near the Palace of Versailles. The web mapping service Google Maps proposes two itineraries (Fig. 6) whose characteristics are given in Table I.
The blue itinerary (denoted A) is the most direct route. It is made up of three sections. Buses and bicycles are to be expected, yet trees on both sides of the middle section impair visibility. The grey itinerary (denoted B) provides a
Fig. 6. Map and Route planning TABLE I
CHARACTERISTICS OF THEGENERATEDITINERARIES Itinerary A Itinerary B
(Blue) (Grey) Distance 6.9 km 12.3 km Estimated trip duration 12 min 15 min
Section 0 Private road (50km/h) Section 1 Street Street
(50km/h) (70km/h) Section 2 Dual Carriageway Highway (70km/h) (110 km/h) Section 3 Urban area Urban area (50 km/h) (50 km/h)
less complex environment but it features high-speed roads. Both of these itineraries pose safety challenges.
Part of the study consists in evaluating the possibility of using one of these routes for the current application, prior to building a prototype. The proposed approach provides a pre-liminary assessment of the level of autonomy [24] that can be expected of an ADS-equipped vehicle on these roads, given current technological capabilities. It also guides the selection of sensors and algorithms and generates reconfiguration rules for the embedded safety module automatically.
B. Available data
The KITTI vision benchmark suite [25] proposes datasets obtained while driving in the city of Karlsruhe, in rural areas and on highways. Preliminary experiments showed that methods that ranked high on previously established benchmarks performed below average when being moved outside the laboratory to the real world. While the evaluation framework allows for some comparison between different algorithms, it is difficult to state which algorithm is better in general since the amount and impact of overfitting and optimisation cannot be determined. The suite does not pro-vide a semantic segmentation benchmark yet, though some semantic labels have been annotated by some users. While the benchmark suite is a commendable first step that attempts to provide an evaluation framework for the computer vision community, it is not sufficient in its current form to obtain safety guarantees for ADS deployment. For this reason, the scope of the study is limited to the following ADS capabilities:
• Free space determination, lane tracking, detection of
lane markings [26], [27]
• Detection, classification and tracking of obstacles (pedestrians, cars, bicycles and buses), detection and recognition of speed limit signs [28], [29], [30] These capabilities are determined in a variety of weather conditions: cloudy/wet, sunny, night, snow/rain and fog [13], [31], [32]. The performance measurements taken from the literature are context-dependent and cannot be used as is in our setting. It is assumed that the performance loss due to this discrepancy can be modelled according to some proba-bility distribution. Since continuous probaproba-bility distributions are incompatible with probabilistic time Petri nets, discrete uniform distributions and discrete Gaussian kernels are used instead. Further work is needed to determine what level of performance a safe ADS must achieve. Here, a fusion scheme is deemed satisfactory if the ADS:
• accomplishes a 95% (resp. 70%) obstacle detection, classification and tracking rate with a probability greater than 0.9 in nominal (resp. degraded) mode
• misclassifies less than 1% (resp. 10%) of detected objects with a probability greater than 0.9 in nominal (resp. degraded) mode
Classification accuracy alone is typically not enough to trust a well-performing algorithm. Moreover, a deep neural network used for object detection can display high recall but low precision and vice-versa. The method allows for the use of multiple performance measures in the proposed model. For the sake of simplicity, a single performance measure is used here. Though the available data provides much needed performance measures, there is actually very little information about the computation time of individual algorithms. As a result, the experiment was conducted with an untimed cPTPN. Comparative studies [30] still provide a fair indication of the relative computation cost of different algorithms.
C. Affecting confidence levels to sensors and algorithms In general, the performance of the whole system is pro-vided but the performance that was achieved with but a subset of sensors and algorithms is rarely shared. To tackle this problem, a weight λi ∈ [0, 1] is affected to each
experiment i according to the similarity between the context the system was tested in and our setting. A weight wij∈ [0, 1] is then affected to each sensor or algorithm j as a measure of its contribution to the performance level of the system. The more sensors and algorithms are used and the more the weight is depreciated.
Let us consider an ADS capability k (e.g. pedestrian classification). The confidence level affected to a sensor and algorithm combination j for that particular capability is de-fined as the weighted averageP
i(λiw j
i).pi(k)/Pi(λiw j i),
where pi(k) is the performance of the whole system that was
used in experiment i. D. Results
The conducted experiments feature sensors commonly used in the context of autonomous driving. The complete
TABLE II SIZE OF THE MODEL
Places Transitions
Simple PTPN 158 76
Coloured PTPN 104 76
model includes several cameras, lidars and radars featured in the literature. The use of many low-cost sensors provides a few benefits over a few expensive high-performance ones, such as system robustness (by avoiding any single point of failure) and a larger field of view. Some solutions work well for tracking vehicles in the context of highway driving but are not general enough for high-curvature roads. These aspects are neglected in this example.
The size of the resulting coloured model is displayed in Table II. The simple form of the model was implemented in the Romeo tool [19]. The probabilistic atomic state class graph takes 2.7 seconds to compute on a 2.3 GHz Intel i7 processor with 16 Gb of RAM on average. This takes into account the time taken to read and write files.
1) Preliminary results: The first step of the study involves following the method described in Fig. 5, assuming that every modelled sensor is available, that the weather conditions are optimal and that there is no shortage of computing power.
The algorithm determined that no combination of mod-elled sensors and algorithms conforms to the safety require-ments for section 2 of itinerary A. This can mean one of two things. Either valuable data pertaining to the performance of existing systems is missing or a key shortcoming of autonomous driving technologies has been identified. The data fed to the tool [13] suggests poor performance from existing systems with regards to the successful classification of cyclists, which is a safety requirement for this road section. This particular statement provides much needed justification when making strategic decisions regarding the deployment of ADS-equipped vehicles. Either itinerary A is deemed impractical for autonomous driving or it can be approved for research purposes, provided a human driver takes over in section 2 of the course whenever necessary. Designing a level 4 ADS-equipped shuttle operating through this road section seems currently unachievable given current data.
2) Design solution: Ignoring current limitations regarding the lack of acceptable bicycle classification, the approach provided several solutions for obstacle detection, classifica-tion and tracking in optimal weather condiclassifica-tions. For example, it proposed the systems used in [13] and [28] as possible candidates for the choice of sensors and algorithms. It also proposed new sensor fusion schemes that were not fed to the tool, such as a lidar-based obstacle detection system with a Velodyne HDL-64 (denoted L) combined with a vision-based detection system using a Ladybug camera (denoted C1). The
expected performance for obstacle detection, classification and tracking rate is 96% with a probability of 0.9 in nominal mode.
Neither the lidar-based or vision-based systems can be used on their own. If no single-point of failure is allowed, at
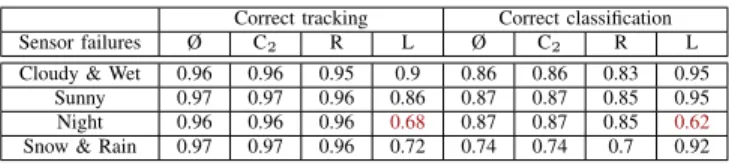
TABLE III
EXPECTED PERFORMANCE OF THE SYSTEM
Correct tracking Correct classification
Sensor failures Ø C2 R L Ø C2 R L
Cloudy & Wet 0.96 0.96 0.95 0.9 0.86 0.86 0.83 0.95
Sunny 0.97 0.97 0.96 0.86 0.87 0.87 0.85 0.95
Night 0.96 0.96 0.96 0.68 0.87 0.87 0.85 0.62
Snow & Rain 0.97 0.97 0.96 0.72 0.74 0.74 0.7 0.92
least one other sensor must be added to the system. The tool provides a possible solution, which consists in the addition of a radar (denoted R) and of another Ladybug camera (denoted C2). The resulting system is expected to perform well enough
(with a probability of 0.9) with up to one sensor failure in a number of weather conditions (Table III).
The confidence values indicate that vision-based systems can provide a reliable alternative to lidar-based tracking. However, if the lidar system fails, then the ADS must not be used during nighttime. These results suggest a possible at-tempt at designing a level 3 ADS-equipped shuttle with some level 4 ADS functions (for sections A1, A3 and itinerary B). The role of the safety module during operation would be to monitor the perception system, switch to the degraded algorithms in case of a failure and request assistance from a human driver in section A2. The system needs to be built
and tested to demonstrate such performances. VII. CONCLUSION
A formal framework for the design of multi-sensor fu-sion systems is proposed. The approach is based on the construction of a coloured probabilistic time Petri net. This formalism was specifically designed in [18] for the problem that is addressed here. This work is motivated by the need for rigorous tools from which the capabilities of Automated Driving Systems can be inferred. To this end, a formal model of sensor fusion schemes was proposed and a method for the definition of degraded modes was described. The approach was illustrated for the particular problem of assessing the possibility of designing the perception system of an ADS-equipped vehicle, given current technological capabilities.
The advantages of such an approach are two-fold. First, it provides a common language for safety engineers and scien-tists working in the field of robotic perception. It can be used to identify the limitations of current systems, to keep track of the progress that has been made and to make strategic decisions with respect to the deployment of ADS-equipped vehicles. It also provides valuable input to guide the choice of sensors and algorithms prior to the production of a prototype. Second, it offers a flexible architecture that supports the addition of new data. The more data is gathered and the better the inferences of the tool become. The aggregation of data within the tool is expected to provide a comprehensive understanding of the advantages of one fusion scheme over another. The approach provides the necessary information to elaborate a safety module automatically. When enough information becomes available, it can also be used to opti-mise the system’s operation and to determine the amount of computing power that is necessary.
An example was provided to show how such an approach can be of value for the design of autonomous vehicles. A sensor fusion scheme was proposed and confidence values were given to determine what level of autonomy can be expected with no single-point of failure allowed. However, a few shortcomings still need to be addressed. The success of the approach rests on the availability of data pertaining to the performance of existing systems. This is necessary to make a proper, complete model. Proprietary black-box modules impede progress towards a better understanding of ADS capabilities. The lack of relevant, publicly available information prevents the tool from being thoroughly fed with context-dependent data. As a result, a thorough understand-ing of the capabilities of autonomous vehicles is not easily achievable. This situation ultimately impedes efforts towards ADS deployment and adoption.
While the tool provides guidance for the design of a per-ception system, it does not provide guarantees. The system must be built and tested to properly validate its capabilities. Moreover, information regarding the computation time of algorithms is rarely provided in the literature, though it is an important aspect of safety-critical real-time embedded systems. Time is part of the PTPN formalism and can easily be added to the model when such information becomes available.
The ultimate goal is to develop a framework in which various design solutions can be determined and formally analysed by a computer. While the construction of the probabilistic atomic state class graph is fairly straightforward given the structure of the model, it is possible that the time needed to compute a solution becomes prohibitive, once enough information is gathered. The framework was specifically applied to the perception system as it appears to be one of the key shortcomings to the development of ADS technology. It is however applicable to other systems such as the localisation and navigation systems. Future work includes the refinement of the weights and confidence levels of sensors and algorithms.
REFERENCES
[1] J. Kim, R. Rajkumar, and M. Jochim, “Towards dependable au-tonomous driving vehicles: a system-level approach,” ACM SIGBED Review, vol. 10, no. 1, pp. 29–32, 2013.
[2] M. Gao and M. Zhou, “Control strategy selection for autonomous vehicles in a dynamic environment,” in International Conference on Systems, Man and Cybernetics, pp. 1651–1656, 2005.
[3] C. Tessier et al., “A real-time, multi-sensor architecture for fusion of delayed observations: application to vehicle localization,” in Intelligent Transportation Systems Conference, pp. 1316–1321, 2006.
[4] B. Johnson and H. Kress-Gazit, “Probabilistic analysis of correctness of high-level robot behaviour with sensor error,” Robotics: Science and Systems, 2011.
[5] J. Fu, N. Atanasov, U. Topcu, and G. J. Pappas, “Optimal temporal logic planning in probabilistic semantic maps,” International Confer-ence on Robotics and Automation, 2016.
[6] M. M. Kokar, J. A. Tomasik, and J. Weyman, “Formalizing classes of information fusion systems,” Information Fusion, vol. 5, no. 3, pp. 189–202, 2004.
[7] M. M. Kokar, K. Baclawski, and H. Gao, “Category theory-based syn-thesis of a higher-level fusion algorithm: An example,” in Information Fusion, pp. 1–8, 2006.
[8] Y. Qiao et al., “Petri net-based real-time scheduling of time-constrained single-arm cluster tools with activity time variation,” in International Conference on Robotics and Automation, pp. 5056–5061, 2012.
[9] H. Hu et al., “Supervisor design and simplification for automated manufacturing systems using colored Petri nets,” in International Conference on Robotics and Automation, pp. 3826–3832, 2015. [10] X. Geng et al., “A scenario-adaptive driving behavior prediction
approach to urban autonomous driving,” Applied Sciences, vol. 7, no. 4, p. 426, 2017.
[11] J. Kim et al., “Towards dependable autonomous driving vehicles: a system-level approach,” ACM SIGBED Review, vol. 10, no. 1, pp. 29– 32, 2013.
[12] C. Weiß, “V2X communication in Europe - from research projects towards standardization and field testing of vehicle communication technology,” Computer Networks, vol. 55, pp. 3103–3119, 2011. [13] P. Radecki, M. Campbell, and K. Matzen, “All weather perception:
Joint data association, tracking, and classification for autonomous ground vehicles,” arXiv preprint arXiv:1605.02196, 2016.
[14] J. Moras, V. Cherfaoui, and P. Bonnifait, “Credibilist occupancy grids for vehicle perception in dynamic environments,” in International Conference on Robotics and Automation, pp. 84–89, 2011.
[15] C. Laugier et al., “Probabilistic analysis of dynamic scenes and colli-sion risks assessment to improve driving safety,” Intelligent Transport Systems Magazine, vol. 3, no. 4, pp. 4–19, 2011.
[16] W. Zhao, T. Fang, and Y. Jiang, “Data fusion using improved Dempster-Shafer evidence theory for vehicle detection,” in Fuzzy Systems and Knowledge Discovery, pp. 487–491, 2007.
[17] M. E. El Najjar and P. Bonnifait, “A road-matching method for precise vehicle localization using belief theory and Kalman filtering,” Autonomous Robots, vol. 19, no. 2, pp. 173–191, 2005.
[18] Y. Emzivat, B. Delahaye, D. Lime, and O. H. Roux, “Probabilistic time Petri nets,” in Application and Theory of Petri Nets and Concurrency, pp. 261–280, 2016.
[19] D. Lime et al., “Romeo: A parametric model-checker for Petri nets with stopwatches,” in Tools and Algorithms for the Construction and Analysis of Systems, pp. 54–57, 2009.
[20] B. B´erard, F. Cassez, S. Haddad, D. Lime, and O. H. Roux, “The expressive power of time Petri nets,” Theoretical Computer Science, vol. 474, pp. 1–20, 2013.
[21] B. Khaleghi, A. M. Khamis, F. Karray, and S. N. Razavi, “Multisensor data fusion: A review of the state-of-the-art,” Information Fusion, vol. 14, no. 1, pp. 28–44, 2013.
[22] F. Bonsignorio et al., “Toward replicable and measurable robotics research,” Robotics & Automation Magazine, vol. 22, no. 3, pp. 32–35, 2015.
[23] L. Cholvy, “Information evaluation in fusion: a case study,” in Informa-tion Processing and Management of Uncertainty in Knowledge-Based Systems, pp. 993–1000, 2004.
[24] SAE standard J3016, “Taxonomy and definitions for terms related to driving automation systems for on-road motor vehicles,” SAE: On-road automated vehicle standards commitee, 2016.
[25] A. Geiger, P. Lenz, and R. Urtasun, “Are we ready for autonomous driving? The KITTI vision benchmark suite,” in Conference on Com-puter Vision and Pattern Recognition, 2012.
[26] F. Moutarde et al., “Robust on-vehicle real-time visual detection of American and European speed limit signs,” in Intelligent Vehicles Symposium, pp. 1122–1126, 2007.
[27] A. S. Huang, “Lane estimation for autonomous vehicles using vision and lidar,” Massachusetts Institute of Technology Cambridge, 2010. [28] J. Leonard et al., “A perception-driven autonomous urban vehicle,”
Journal of Field Robotics, vol. 25, no. 10, pp. 727–774, 2008. [29] M. Kristan et al., “The visual object tracking VOT2015 challenge
results,” in International conference on computer vision workshops, pp. 1–23, 2015.
[30] D. Prajapati and H. J. Galiyawala, “A review on moving object detec-tion and tracking,” Internadetec-tional Journal of Computadetec-tional Intelligence Research, vol. 5, no. 3, pp. 168–175, 2015.
[31] D. Pomerleau, “Visibility estimation from a moving vehicle using the ralph vision system,” in Intelligent Transportation Systems Conference, pp. 906–911, 1997.
[32] R. Rasshofer, M. Spies, and H. Spies, “Influences of weather phenom-ena on automotive laser radar systems,” Advances in Radio Science, vol. 9, no. B. 2, pp. 49–60, 2011.
View publication stats View publication stats