HAL Id: hal-02563840
https://hal-univ-rennes1.archives-ouvertes.fr/hal-02563840
Submitted on 28 Sep 2020
HAL is a multi-disciplinary open access
archive for the deposit and dissemination of
sci-entific research documents, whether they are
pub-lished or not. The documents may come from
teaching and research institutions in France or
abroad, or from public or private research centers.
L’archive ouverte pluridisciplinaire HAL, est
destinée au dépôt et à la diffusion de documents
scientifiques de niveau recherche, publiés ou non,
émanant des établissements d’enseignement et de
recherche français ou étrangers, des laboratoires
publics ou privés.
Distributed under a Creative Commons Attribution - NonCommercial - NoDerivatives| 4.0
Starvation and antimetabolic therapy promote cytokine
release and recruitment of immune cells
Franziska Püschel, Francesca Favaro, Jaime Redondo-Pedraza, Estefanía
Lucendo, Raffaella Iurlaro, Sandrine Marchetti, Blanca Majem, Eric Eldering,
Ernest Nadal, Jean-Ehrland Ricci, et al.
To cite this version:
Franziska Püschel, Francesca Favaro, Jaime Redondo-Pedraza, Estefanía Lucendo, Raffaella Iurlaro,
et al.. Starvation and antimetabolic therapy promote cytokine release and recruitment of immune
cells. Proceedings of the National Academy of Sciences of the United States of America , National
Academy of Sciences, 2020, 117 (18), pp.9932-9941. �10.1073/pnas.1913707117�. �hal-02563840�
Starvation and antimetabolic therapy promote
cytokine release and recruitment of immune cells
Franziska Püschela, Francesca Favaroa,b,c,d,1, Jaime Redondo-Pedrazaa,1, Estefanía Lucendoa, Raffaella Iurlaroa, Sandrine Marchettie, Blanca Majema, Eric Elderingb,c,d, Ernest Nadalf, Jean-Ehrland Riccie, Eric Chevetg,h, and Cristina Muñoz-Pinedoa,i,2
aOncobell Program, Bellvitge Biomedical Research Institute, Hospitalet, 08908 Barcelona, Spain;bDepartment of Experimental Immunology, Amsterdam
University Medical Centers, University of Amsterdam, 1105 AZ Amsterdam, The Netherlands;cLymphoma and Myeloma Center, Cancer Center Amsterdam,
University of Amsterdam, 1105 AZ Amsterdam, The Netherlands;dAmsterdam Institute for Infection & Immunity, 1105 AZ Amsterdam, The Netherlands; eINSERM, Centre Méditerranéen de Médecine Moléculaire, Université Côte d’Azur, 06204 Nice, France;fThoracic Oncology Unit, Department of Medical
Oncology, Catalan Institute of Oncology, Hospitalet, 08908 Barcelona, Spain;gINSERM U1242“Chemistry, Oncogenesis, Stress, Signaling,” Université de
Rennes, 35042 Rennes, France;hINSERM U1242, Centre de Lutte Contre le Cancer Eugène Marquis, 35042 Rennes, France; andiDepartment of Basic Nursing,
Faculty of Medicine and Health Sciences, Universitat de Barcelona, Hospitalet, 08907 Barcelona, Spain
Edited by Karen H. Vousden, Francis Crick Institute, London, United Kingdom, and approved March 16, 2020 (received for review August 14, 2019)
Cellular starvation is typically a consequence of tissue injury that disrupts the local blood supply but can also occur where cell populations outgrow the local vasculature, as observed in solid tumors. Cells react to nutrient deprivation by adapting their metabolism, or, if starvation is prolonged, it can result in cell death. Cell starvation also triggers adaptive responses, like angio-genesis, that promote tissue reorganization and repair, but other adaptive responses and their mediators are still poorly character-ized. To explore this issue, we analyzed secretomes from glucose-deprived cells, which revealed up-regulation of multiple cytokines and chemokines, including IL-6 and IL-8, in response to starvation stress. Starvation-induced cytokines were cell type-dependent, and they were also released from primary epithelial cells. Most cytokines were up-regulated in a manner dependent on NF-κB and the tran-scription factor of the integrated stress response ATF4, which bound directly to the IL-8 promoter. Furthermore, glutamine deprivation, as well as the antimetabolic drugs 2-deoxyglucose and metformin, also promoted the release of IL-6 and IL-8. Finally, some of the factors released from starved cells induced chemotaxis of B cells, mac-rophages, and neutrophils, suggesting that nutrient deprivation in the tumor environment can serve as an initiator of tumor inflammation.
cancer metabolism
|
cytokines|
cancer immunity|
glucoseN
umerous pathological conditions involve nutrient starvation. Upon mild starvation, proliferating cells undergo growth arrest and down-regulate their anabolic metabolism. Non-proliferating tissues are also sensitive to nutrient restriction, and, if starvation is prolonged, cells undergo cell death, which damages the tissue in ischemic diseases, such as stroke and myocardial in-farction. Tissue injury due to blunt force trauma or cuts also dis-turbs nutrient flux, promoting hypoxia and starvation. This type of injury, as well as ischemic damage, engages the wound-healing response to promote tissue repair.Solid tumor development is also accompanied by a microenvi-ronment low in nutrients (1). When blood vessels are not delivering enough oxygen or nutrients, an increase in vascular endothelial growth factor (VEGF) and other proangiogenic molecules ensures the growth of blood vessels. This response is also coopted by tumors to cope with low oxygen and nutrients in a process known as neo-angiogenesis that is associated with tumor invasion and metastasis (2). While neoangiogenesis has been widely studied as a response to hypoxia, several reports indicate that nutrient restriction evokes the same angiogenic responses through the release of proangiogenic factors (3, 4). Another well-characterized response to ischemia in noncancerous tissues is inflammation, which is associated with re-jection of transplanted ischemic organs and contributes to injury, but also to tissue repair, in stroke and other ischemic diseases (5, 6). Inflammation, in this context, is generally thought to be driven by the necrotic cell death occurring in ischemic tissues due to the lack
of oxygen or nutrients. However, some reports suggest that nutrient restriction, even without cell death, can be sufficient to promote the synthesis and/or secretion of select proinflammatory cytokines (7–9). This suggests that cells in solid tissues possess an evolution-arily conserved program to react to starvation that involves en-gagement of surrounding cells, including the stroma and resident immune system, to counteract the damage.
We hypothesized that starving cells, including tumor cells, promote adaptive responses to nutrient deprivation that go be-yond angiogenesis and resemble a wound-healing response. Starving cells could promote tissue reorganization to restore nutrients and dispose of“waste” products like lactate. To iden-tify possible cell–cell responses, we analyzed the secretome of starved cells and found that the release of inflammatory cyto-kines and chemocyto-kines is a primary response to starvation in multiple cancer cell types, which has implications in cancer im-munity and for treatment with antimetabolic drugs.
Results
Cells Subjected to Glucose Deprivation Release Immune Cytokines and Chemokines.We hypothesized that a reduction in the avail-ability of nutrients induces cell–cell signals, which would include
Significance
Poorly irrigated tumors exhaust nutrients from their environ-ment. On the other hand, innate immune cells, such as neu-trophils and macrophages, have been frequently shown to infiltrate tumors and promote an immunosuppressive envi-ronment. Our results show that, when nutrients are low, tumor cells secrete factors related to wound healing that stimulate endothelial cells and attract innate immune cells. This suggests that targeting signals elicited by metabolic stress may help the immune system target malignant cells and that metabolites regulate the communication between immune and tumor cells also through modulation of peptidic signals.
Author contributions: C.M.-P. designed research; F.P., F.F., J.R.-P., E.L., R.I., S.M., and B.M. performed research; E.E., J.-E.R., and E.C. contributed new reagents/analytic tools; F.P., F.F., J.R.-P., E.L., R.I., S.M., B.M., E.N., J.-E.R., E.C., and C.M.-P. analyzed data; and F.P. and C.M.-P. wrote the paper.
The authors declare no competing interest. This article is a PNAS Direct Submission.
This open access article is distributed underCreative Commons
Attribution-NonCommercial-NoDerivatives License 4.0 (CC BY-NC-ND).
1F.F. and J.R.-P. contributed equally to this work.
2To whom correspondence may be addressed. Email: cmunoz@idibell.cat.
This article contains supporting information online athttps://www.pnas.org/lookup/suppl/
doi:10.1073/pnas.1913707117/-/DCSupplemental.
First published April 20, 2020.
protein mediators (cytokines). To analyze this, we subjected two different cell lines, HeLa (cervical cancer) and Rh4 (alveolar rhabdomyosarcoma), to glucose deprivation and to treatment with 2-deoxyglucose (2-DG), a glycolytic inhibitor (10). Super-natants were then subjected to biotin label-based antibody ar-rays, which detect a total of 1,000 proteins involved in a variety of functions (SI Appendix, Materials Table). Because dead cells release their content and serum interferes with arrays of secreted proteins, we lowered serum, while selecting times with low amounts of cell death (maximum of 10% cell death) (SI Ap-pendix, Fig. S1A). Results of the arrays are shown inDatasets S1 andS2.
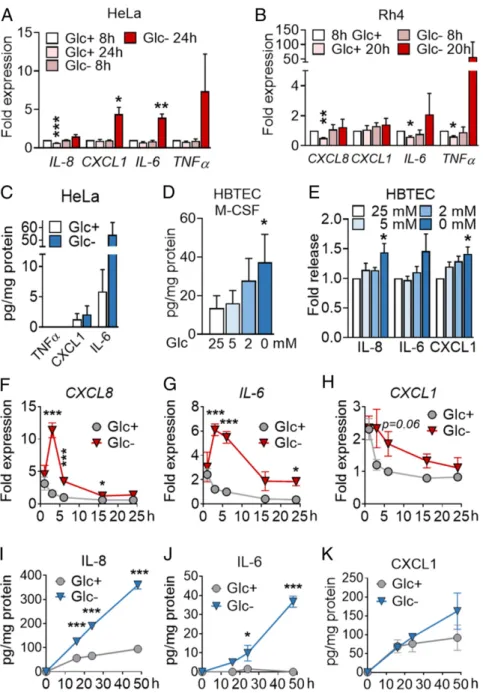
To identify pathways, rather than individual proteins subjected to regulation upon starvation, we performed gene set enrichment analysis (GSEA). This analysis revealed a number of biological processes and molecular functions significantly regulated by glucose deprivation or 2-DG (SI Appendix, Fig. S1 B and Cand Dataset S3). Selected proteins from these pathways, such as interleukin-8 (IL-8) (gene name CXCL8), IL-6, CXCL1, and TNFα, were confirmed to be regulated at the messenger RNA (mRNA) level in HeLa (Fig. 1A andSI Appendix, Fig. S1D), and glucose deprivation induced the mRNA of IL-6 and TNFα in Rh4 cells (Fig. 1B). IL-6 and IL-8 were indeed secreted from starved HeLa (Fig. 1C andSI Appendix, Fig. S1D). Importantly, cytokine secretion was not exclusive of tumor cells, and we could also observe the release of M-CSF, CXCL1, IL-6, and IL-8 from primary pulmonary epithelial cells (HBTECs) upon glucose deprivation (Fig. 1D and E).
To detect more inflammatory cytokines that may have been overlooked in the first array, we performed specific arrays for immune cytokines and chemokines. To this end, we employed A549 non-small cell lung adenocarcinoma (LUAC) cells, which were less sensitive to glucose deprivation than HeLa or Rh4, thus allowing the minimization of cell death in supernatants (SI Ap-pendix, Fig. S1F). Chemokine and cytokine arrays revealed that a number of immune cytokines and chemokines were also up-regulated in A549 cells upon glucose deprivation (SI Appendix, Figs. S1J and K and S2 A–GandDataset S4). Among them, we found induction of chemokines like CXCL8 (IL-8), CCL5 (RANTES), CCL20 (MIP-3β), and CCL19, as well as immune cytokines, including IL-6, IL-2, IL-11, M-CSF, and CD14. Cy-tokines with other functions, like VEGF, CTGF, or adiponectin, were also induced while some chemokines like CCL2 were down-regulated. The mRNA coding for some of the proteins analyzed peaked at 3 h and returned to nearly normal levels after 24 h (Fig. 1F–H andSI Appendix, Fig. S2 A–G), thereby showing a different pattern than observed in HeLa cells (Fig. 1A). We verified using enzyme-linked immunosorbent assay (ELISA) the inducible synthesis and release of IL-6 and IL-8 whereas CXCL1 and M-CSF levels did not change in the supernatant (Fig. 1I–K andSI Appendix, Fig. S2H).
Given the functional relevance of IL-8 and IL-6 in cancer and that these cytokines were consistently up-regulated, we focused on the regulation of these two proteins to understand the sig-naling pathways that promote their synthesis and secretion. These cytokines are likely regulated differently, based on dif-ferent kinetics of mRNA synthesis shown in Fig. 1. IL-8 showed a much higher release than IL-6 from A549 (Fig. 1 I and J) (Fig. 1I and J), which allowed us to study its secretion at short times within the ELISA detection range. IL-8 is involved in a variety of physiological functions and pathologies, such as can-cer. Notably, it is a proangiogenic factor, and it confers survival, chemoresistance, and immunosuppressive function (11). We verified that, even though its messenger peaked at 3 h (Fig. 1F), the protein was continuously being synthesized and released at longer time points, as previously observed in HeLa cells. Analysis of protein content in the cell lysate indicated that IL-8 was being secreted as it was synthesized (SI Appendix, Fig. S2 I–K).
Importantly, its secretion correlated inversely with the amount of glucose present in the medium (SI Appendix, Fig. S2L). We ex-tended the analysis of IL-8 and IL-6 secretion to other LUAC cell lines, H460 and H1299, and to two squamous lung carcinoma cell lines, H520 and SW900. These cell lines displayed hetero-geneous sensitivity to glucose deprivation (SI Appendix, Fig. S1) and heterogeneous patterns of cytokine release (SI Appendix, Fig. S2M–T), with H460 and SW900 showing a high constitutive secretion of IL-6 and IL-8 that was further increased upon glu-cose deprivation. H1299 and H520 did not secrete either cyto-kine under basal or starved conditions, indicating that not all cell lines exhibit the same pattern. These data indicate that starva-tion promotes the inducstarva-tion of protumorigenic cytokines, which prompted the question whether targeting cancer metabolism might trigger the same response.
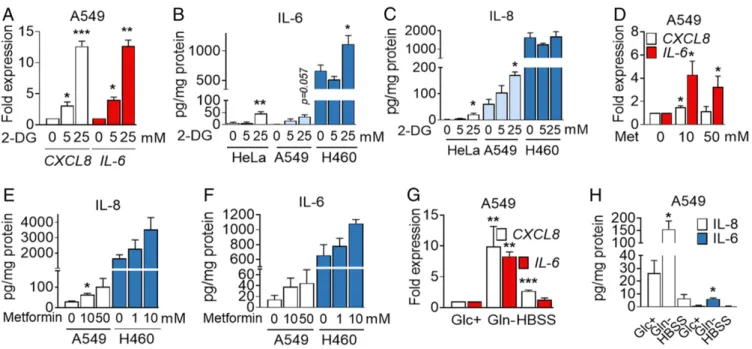
2-DG, Metformin, and Glutamine Depletion, but Not Complete Starvation, Induce IL-6 and IL-8 Secretion.Drugs targeting cancer metabolism are currently being used in clinical trials. 2-DG is an inhibitor of gly-colysis and glycosylation frequently used to mimic glucose depriva-tion that has been tested in patients (10, 12). Metformin targets mitochondrial complex I and is being proposed as an anticancer agent due to epidemiological observations of reduction of cancer incidence, as well as due to associations between diabetes and cancer prognosis (13, 14). We observed that, in general, 2-DG was not toxic to HeLa or A549 cells in contrast to other cell lines that undergo cell death with 2-DG added in the millimolar range (15) (SI Appendix, Figs. S1A and S3A). Exposure to 2-DG in complete medium pro-moted the induction ofCXCL8 and IL-6 in A549 (Fig. 2A), release of IL-6 from HeLa, A549, and H460 cells (Fig. 2B), and release of IL-8 from HeLa and A549 (Fig. 2C), without promoting cell death. Other cell lines that showed little or no cytokine induction upon glucose deprivation did not secrete IL-8 upon treatment with 2-DG (SI Appendix, Fig. S3 B and C), and primary HBTECs did not re-spond to 2-DG in the same way than to glucose deprivation (SI Appendix, Fig. S3D). Intriguingly, 2-DG prevented cell death of glucose-deprived A549 cells, but it could not substitute for glucose in terms of IL-8 release (SI Appendix, Fig. S3 E and F). This suggests that 2-DG is partially metabolized and can contribute to some es-sential metabolic or signaling pathway upon glucose depletion. This phenomenon has been previously observed in other cancer cell lines (16, 17).
Mannose, a glucose isomer that can substitute for glucose in some cell lines or inhibit glucose metabolism in others (18, 19), prevented both cell death and IL-8 release in these cells (SI Appendix, Fig. S3 E and F). Metformin in the millimolar range induced mRNA expression and cytokine release of IL-8 and IL-6 in both A549 and H460 cells (Fig. 2D–F). In addition, glutamine depletion also promoted IL-6 and IL-8 mRNA induction and protein release, as previously described in other cell lines (7, 8). Complete starvation through incubation in a saline solution, Hanks’ balanced salt solution (HBSS), led to induction of CXCL8 mRNA, but it did not lead to secretion of IL-6 or IL-8 (Fig. 2G and H), indicating that different starvation stimuli lead to different outcomes.
Glucose Deprivation Induces the Unfolded Protein Response (UPR) and Promotes mTOR Inactivation.Glucose deprivation inactivates mTORC1, in part through activation of AMPK (20). mTOR inactivation down-regulates protein synthesis and other anabolic pathways. Many tumors and cell lines, including A549, are de-ficient for the kinase LKB1 that activates AMPK upon glucose withdrawal. Fig. 3A shows mTORC1 inactivation upon glucose deprivation in A549, possibly due to secondary loss of non-essential amino acids. Since mTORC1 inactivation is a common feature of most forms of starvation, we next evaluated whether the use of mTOR inhibitors would be sufficient to promote cy-tokine release. Rapamycin, an inhibitor of mTORC1, did not
IMM
UNOLOGY
AND
INFLAM
promote IL-8 release at doses that inactivate mTORC1 (Fig. 3B and SI Appendix, Fig. S4A). Torin-1, which also inhibits mTORC2, induced IL-8 (Fig. 3C and SI Appendix, Fig. S4B). However, when combined with glucose deprivation, both inhib-itors reduced cytokine release, indicating that mTOR was re-quired for IL-8 release (Fig. 3B and C), as described previously in experiments of glutamine deprivation (7).
Another related outcome of starvation, which promotes mTOR inactivation in a context-dependent manner, is the activation of the UPR and/or the integrated stress response (ISR), which at-tenuates 5′ cap-dependent protein translation. These responses converge toward the phosphorylation of the translation initiation factor eIF2α and are engaged upon endoplasmic reticulum (ER) stress as part of the UPR, or upon amino acid/heme depletion and
Fig. 1. Inhibition of glycolysis promotes cytokine synthesis and secretion. (A) HeLa cells were treated for 8 or 24 h with media containing 25 mM (Glc+) or
2 mM (Glc−) glucose. qPCR for indicated genes is shown. Fold expression was calculated by normalizing to control sample Glc+at 8 h. Data are represented as
mean± SEM (n = 3). Asterisks denote significant differences between treated cells and the 8-h Glc+sample for each mRNA. (B) Rh4 cells were treated and
analyzed for 8 or 20 h as in A. Data represent mean± SEM (n = 3). Asterisks denote significant differences to the control sample at 8 h in Glc+of each siRNA.
(C) HeLa cells were treated for 24 h with 25 mM or 0 mM Glc, and supernatants were analyzed by ELISA of TNFα, CXCL1, and IL-6. Data represent mean ± SEM (n= 3). (D and E) HBTECs were treated for 24 h with media containing indicated glucose concentrations. Supernatants were analyzed by ELISA for M-CSF (D) and IL-8, IL-6, and CXCL1 (E). Data represent mean± SEM (n = 3). Asterisks represent significant differences between the 25-mM control sample and each treatment analyzed by one-tailed paired t test. (F–H) A549 cells were treated for 1, 3, 6, 16, and 24 h with media containing 25 (Glc+) or 0 mM (Glc−) glucose.
qPCR of CXCL8 (F), IL-6 (G), CXCL1 (H) is shown. Fold expression was calculated by normalizing to cells treated for 6 h with Glc+. Data are represented as mean±
SEM (n= 3–9). Asterisks denote significant differences versus the samples in Glc+for each time point analyzed by two-way ANOVA. (I–K) A549 cells were treated as
in F for indicated time points. ELISA of IL-8 (I), IL-6 (J), and CXCL1 (K) is shown. Data are represented as mean± SEM (n = 3–4). Asterisks denote significance between the Glc+and Glc−sample for each time point analyzed by two-way ANOVA. Error bars represent the SEM. The significance was indicated as follows: *P<
0.05; **P< 0.01; ***P < 0.001.
viral double-stranded RNA (dsRNA) detection as part of the ISR. Glucose deprivation engages both the UPR and the ISR in mul-tiple cell lines, depending on activation of the kinases PERK or GCN2, respectively, which phosphorylate eIF2α (21–23). Phos-phorylation of this translation initiation factor is mainly involved in translational attenuation which in turn may result in selective translation of certain mRNA, including that encoding the tran-scription factor ATF4. This trantran-scription factor targets the ex-pression of metabolic genes whose products restore cell homeostasis. But ATF4 also promotes cell death upon glucose deprivation or 2-DG (15, 18). GCN2 was shown to be required for the induction of ATF4 upon glucose deprivation in A549 cells (23). Analysis of ATF4 expression in these cells revealed the fast (3 h) accumulation of this protein upon glucose starvation (Fig. 3D andSI Appendix, Fig. S4C), a time in which we could also detect a strong induction of one of its target genes, CHOP (SI Appendix, Fig. S4D). Besides activation of GCN2, possibly by uncharged transfer RNA, it is likely that glucose-deprived cells activate the UPR because they undergo ER stress in the absence of sugar derivatives required for N-glycosylation. In this sense, XBP1 mRNA splicing was also detected at short times (Fig. 3E and SI Appendix, Fig. S4E). Since the endoribonuclease re-sponsible for XBP1 mRNA splicing (IRE1) and XBP1 have pre-viously been involved in cytokine synthesis in immune cells and animals subjected to restrictive diets (24, 25) or in cytokine release by cancer cells (26, 27), we analyzed their role in cytokine syn-thesis. The use of a chemical inhibitor of IRE1α RNase activity, MKC-8866, preventedXBP1 splicing, but not CXCL8 induction (Fig. 3F). Silencing of XBP1 with two different small interfering RNA (siRNA) sequences reduced the level of XBP1s and its downstream target Erdj4. However, IL-8 was not consistently down-regulated (SI Appendix, Fig. S4 G–I). In summary, the
IRE1/XBP1 pathway does not play a relevant role in IL-8 in-duction in our experimental settings.
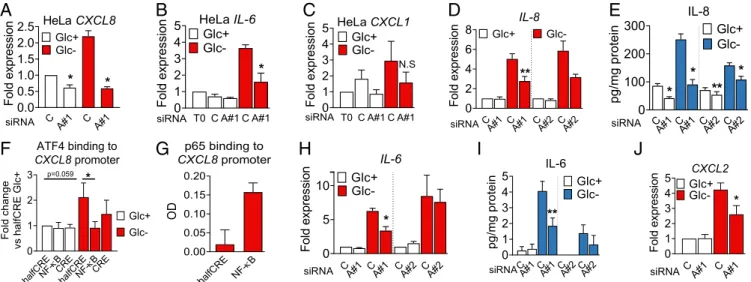
ATF4 and NF-κB Mediate Cytokine Induction and Release.Glucose deprivation, 2-DG, and metformin induced ATF4 (Fig. 3D and SI Appendix, Fig. S5 A–C). A role for ATF4 in cytokine induction and secretion upon glucose deprivation was investigated by using siRNA. HeLa cells transfected with siRNA against ATF4 showed less accumulation of the mRNA of three cytokines tested: CXCL1, CXCL8 (IL-8), and IL-6 (Fig. 4 A–C and SI Appendix, Fig. S5D). In A549 cells, the use of two different siRNAs against ATF4 showed thatCXCL8 expression and IL-8 secretion were ATF4-dependent (Fig. 4D and E andSI Appendix, Fig. S5E). Moreover, quantitative DNA-protein interaction ELISA (qDPI-ELISA) and chromatin immunoprecipitation analysis un-veiled thatCXCL8 is a direct target of ATF4 (Fig. 4 F and G andSI Appendix, Fig. S5G; see promoter scheme inSI Appendix, Fig. S5F). Similar results were obtained when analyzing IL-6, which is an ATF4 target in macrophages (28), and CXCL2 (Fig. 4 H–J). The use of a chemokine array allowed us to detect other chemokines regulated by ATF4, like CCL2 and CXCL5 (SI Appendix, Fig. S5 H andI). CCL2 was down-regulated by glucose deprivation, and its levels were recovered by silencing ATF4 (SI Appendix, Fig. S5J). CXCL5 was secreted in high quantities by A549 cells, and its mRNA was regulated by ATF4, in the presence or absence of glucose, although the reduction of the protein in cell supernatants was not significant (SI Appendix, Fig. S5 K and L). Other cytokines and chemokines like CXCL3 were only mildly or not regulated by ATF4 (SI Appendix, Fig. S5 N–Q).
Inflammatory cytokines and chemokines are generally regu-lated by the transcription factor NF-κB. This transcription factor is activated downstream of the UPR/ISR via multiple mechanisms
Fig. 2. 2-DG, metformin (Met), and glutamine deprivation induces IL-6 and IL-8. (A) A549 cells were treated with 2-DG for 6 h. qPCR for CXCL8 and IL-6 is shown. Values were normalized to control sample at 0 mM 2-DG. Data are represented as mean± SEM (n = 3–4). Asterisks denote significant differences with the 0-mM sample for each cytokine. (B and C) A549, HeLa, and H460 cells were treated with 2-DG for 24 h at indicated concentrations. ELISA values for IL-6 (B) and IL-8 (C) are shown. Data represent mean± SEM (n = 3–4). Asterisks denote significant differences versus the 0-mM control sample for each cell line. (D) A549 cells were treated for 6 h with metformin at indicated concentrations. qPCR for CXCL8 and IL-6 is shown. Values are normalized to cells treated without the drug. Data are represented as mean± SEM (n = 4). Asterisks denote significant differences versus the 0-mM control sample. (E and F) A549 and H460 cells were treated for 24 h as in D. ELISA is shown for IL-8 (E) and IL-6 (F). Data are represented as mean± SEM (n = 3). Asterisks denote significant differences vs. the control for each cell line. (G) A549 cells were incubated in 25 mM (Glc+) glucose, 0 mM glutamine (Gln−) medium or HBSS for 6 h. qPCR is shown for CXCL8
and IL-6. Values were normalized to Glc+. Data represent mean± SEM (n = 3). Asterisks denote significant differences vs. Glc+. (H) A549 cells were incubated
with Glc+, Gln−medium, or HBSS for 24 h. ELISA is shown for IL-8 and IL-6. Data indicate mean± SEM (n = 3–4). Asterisks denote significant differences versus
Glc+. Error bars represent the SEM. The significance was indicated as follows: *P< 0.05; **P < 0.01; ***P < 0.001.
IMM
UNOLOGY
AND
INFLAM
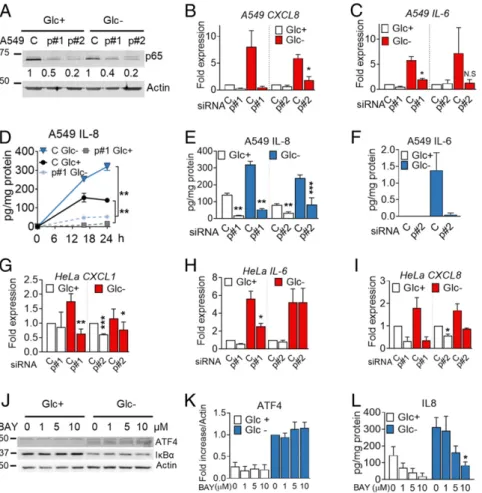
which include IRE1-mediated TRAF/JNK activation and degra-dation of IκB when translation is reduced (29). Down-regulation of p65, one of the canonical NF-κB subunits, using siRNA, in-dicated that IL-8 was regulated at the mRNA and protein level upon glucose deprivation and also in basal conditions in A549 cells (Fig. 5A, B, D, and E). Similarly, silencing p65 reduced IL-6 in-duction and secretion (Fig. 5C and F). p65 NF-κB participated in regulation of the mRNA ofM-CSF, CXCL1, CXCL2, and CCL20 (SI Appendix, Fig. S6 C–F) while the effect on CXCL3 and CXCL5 was minor (SI Appendix, Fig. S6 G and H). NF-κB was also required for induction ofCXCL8, CXCL1, and IL-6 in HeLa cells (Fig. 5G–I andSI Appendix, Fig. S6 A and B).
We investigated a possible cross-talk between ATF4 and NF-κB in the regulation of IL-8 and found that inhibition of NF-NF-κB using BAY 11-7082 or silencing p65 did not alter ATF4
induction (Fig. 5J–L andSI Appendix, Fig. S6 I–K) and silencing ATF4 had only a minor effect on IκBα degradation (SI Appendix, Fig. S6 L–N). In summary, a subset of immune cytokines and chemokines is induced transcriptionally and translationally by NF-κB p65 and/or ATF4 during glucose deprivation.
Conditioned Medium from Starved Cells Promotes Paracrine Effects on Cancer Cells.The pattern of cytokine induction was conserved among multiple cancer cell types and even nontransformed cells. This suggests that this is a conserved response that may play wound healing or alarm roles in the tissue and which could in-fluence the cross-talk between cancer cells and the stroma. Ad-ditionally, our results suggested the possibility that proteins secreted from cancer cells subjected to starvation protect neighboring cancer cells or stimulate their own migration. To test which roles could the cytokine mixture play, we collected conditioned medium from A549 cells subjected to glucose dep-rivation or grown in control medium. A fraction of the condi-tioned medium was filtered and washed with fresh medium to concentrate the cytokines and eliminate metabolites secreted from starved cells (see scheme in SI Appendix, Fig. S7A). The conditioned medium was applied to the lower part of a Boyden chamber in which A549 cells were plated on top, and migration was measured. We observed that A549 cells migrate toward conditioned media. However, there was no major difference in the migration between the conditioned media from cells grown in the presence or absence of glucose (SI Appendix, Fig. S7 B and C). We also incubated A549 cells in conditioned media and measured cell death induced by glucose deprivation. Filtered conditioned media without glucose, containing secreted cyto-kines but not metabolites, induced more cell death than control media without glucose (SI Appendix, Fig. S7 D and E), and it did not promote epithelial–mesenchymal transition (EMT) or matrigel invasion (SI Appendix, Fig. S7 F–I). However, the fac-tors released by starved cells changed A549 adhesion in collagen and stimulated their proliferation (Fig. 6A and B). A predicted effect of the conditioned medium, according to the cytokines secreted, was angiogenesis. We tested the effects of conditioned medium on human umbilical vein endothelial cells (HUVECs) and observed that the fraction larger than 3 kDa from starved A549 cells stimulated their proliferation and migration com-pared to medium from nonstarved cells (Fig. 6C and D) Conditioned Medium from Starved Cells Promotes Migration of Immune Cells. Inflammation occurs during wound healing, and it involves the recruitment of immune cells to injured or infected sites. Our results suggested that glucose deprivation could pro-mote a similar response. We first tested whether conditioned medium from starved A549 cells would stimulate migration of lymphoid cells from healthy donors. Cells incubated in Boyden chambers showed a tendency to migrate more toward condi-tioned medium from starved cells than to medium from control cells. This tendency was conserved when the conditioned me-dium was filtered and washed. The trend was observed for T lymphocytes (CD3+), natural killer T cells (CD3+CD56+), and natural killer cells (CD3− CD56+), but not for monocytes (Fig. 6E andSI Appendix, Fig. S7 J–L), and was more obvious and significant for B cells (CD19+) (Fig. 6F).
The known roles of some of the chemokines studied include chemoattraction of myeloid cells. We performed migration ex-periments using THP-1 cells differentiated to macrophage-like cells using phorbol 12-myristate 13-acetate (PMA). We observed a higher migration toward conditioned media of starved cells regardless of glucose availability (Fig. 6G). Moreover, migration was not due to secreted metabolites (Fig. 6G, blue) but due to the fraction larger than 3 kDa, which also induced migration of THP-1 when replenished with fresh complete media.
Fig. 3. Glucose deprivation induces the UPR and promotes mTORC1 in-hibition. (A) A549 cells were treated for 1, 3, 6, 16 and 24 h in media con-taining 25 mM (Glc+) or 0 mM (Glc−) glucose. A representative Western blot
for pAMPK, pS6, and 4E-BP1 is shown. Protein bands were quantified and normalized to actin; numbers underneath each image represent normalized band intensity. (B and C) Cells were treated for 24 h with rapamycin (Rapa) (B) or Torin1 (C) in media containing 25 mM (Glc+) or 0 mM (Glc−) glucose.
ELISA of IL-8 was performed. Data are represented as mean± SEM (n = 3–4). Asterisks denote significant differences of rapamycin- or torin-treated cells versus the drug-free sample for each culture medium. (D) Cells were treated for indicated times with 25 mM glucose (C) or 0 mM (Glc−). A representative Western blot (n= 3) for ATF4 and CHOP is shown. Protein bands were quantified and normalized to actin. (E) Cells were treated as described in D or for 24 h with 4μM thapsigargin (Tg) and lysed for mRNA extraction. Retrotranscription was performed followed by RT-PCR for XBP1. Represen-tative PCR is shown out of 3. (F) Cells were pretreated with 10μM of the IRE-1 inhibitor MKC-8866 for IRE-16 h and for another 6 h in combination with media containing 25 mM (Glc+) or 0 mM (Glc−) glucose. XBP1s and CXCL8
mRNA was analyzed by qPCR. Values are normalized to the Glc+control
sample of each treatment. Data show mean± SEM (n = 3). Error bars rep-resent the SEM. The significance was indicated as follows: *P< 0.05.
The first responders to an injury site are neutrophils. We differentiated HL60 cells to neutrophil-like cells and observed that, although they do not migrate toward conditioned media of A549 (SI Appendix, Fig. S7M), conditioned media from starved H460 cells, which release higher amounts of cytokines (SI Ap-pendix, Fig. S2), attracted HL60 cells (Fig. 6H). We also purified neutrophils from human blood and let them migrate toward conditioned media of A549 or H460 cells. Primary neutrophils migrated preferentially toward conditioned media from starved cells (Fig. 6I andSI Appendix, Fig. S7N). These media did not promote differential effects on cell death or activation of neu-trophils (SI Appendix, Fig. S7 O and P). Additionally, we injected conditioned medium from murine CT26 cells in the peritoneal cavity of syngeneic immunocompetent mice. The conditioned medium was collected from cells that had been incubated in the presence or absence of 2-DG. Afterward, the conditioned media were washed with fresh media to remove 2-DG. Forty-eight hours after the injection, the number of macrophages and neutrophils retrieved was higher in mice injected with the 2-DG conditioned medium (Fig. 7A) although the effect was lost at 72 h (SI Ap-pendix, Fig. S8).
Finally, we tested whether ATF4 and p65 played a role in the paracrine effects of conditioned media and whether some of the migratory effects were mediated by IL-8 and/or IL-6. We verified that neutralization of IL-6 or IL-8 affected migration of THP-1 cells or neutrophils while silencing p65 or ATF4 reduced mi-gration of CD19+, neutrophils, and macrophage-like THP-1 cells (Fig. 7B–E).
Discussion
Nutrient limitation occurs during physiological tissue growth or as a consequence of various pathological events, such as wounds or vascular occlusions that lead to transient ischemia. To re-cover, ischemic tissues employ mechanisms that promote wound
healing and the restoration of the nutrient flux. These mecha-nisms include angiogenesis and inflammation, which have been classically attributed to hypoxia or to necrotic inflammatory signals, respectively. We show here that nutrient deprivation could be, by itself, a powerful signal to induce inflammation as part of a normal wound-healing response as pathogens and sterile injuries trigger similar events which include the recruitment of the innate immune system. It is possible that nutrient deprivation followed by the ISR is one of the many signals that the body uses to detect infections as pathogens also deprive nutrients from the site of infection. In fact, the kinase PKR, that detects viral dsRNA, is one of the kinases that activate the ISR (30).
In cancer, starvation can occur in three major scenarios. During tumor growth, the rapid expansion of tumor cells results in poor vascularization. Second, some oncogenes promote the massive use of nutrients, which create a state of “pseudo-starvation” that has been proposed to contribute to metastasis (31). Third, antimetabolic drugs being used or tested for cancer therapy cause starvation-like signals in cancer cells. Given the role of several of the cytokines described here in tumor pro-gression, our results suggest a note of caution when treating patients with these drugs. On the other hand, tumorigenic pro-gression is often associated to chronic inflammation. Our data suggest that one of the major promoters of tissue inflammation in tumors may be the lack of nutrients, which induces the se-cretion of chemokines and cytokines that in turn may promote tumor survival through suppressive immune infiltration.
We performed RNA and protein arrays in several cell lines and confirmed that glucose deprivation leads to the induction and release of a broad range of proteins, such as VEGF and IL-8, that are associated with angiogenesis, or IL-6 and IL-11, that promote tumor growth and survival. Paracrine signaling could transmit noncell autonomous “adaptation to stress” signals to neighboring cells to promote escape or adapt to the nutrient
T0 C A#1 C A#1 0 1 2 3 4 5 HeLa IL-6 F ol d exp ress ion siRNA * Glc-Glc+ C A#1 C A#1 0.0 0.5 1.0 1.5 2.0 2.5 HeLa CXCL8 Fol de xpressi on * * siRNA Glc+ Glc-C A#1 CA#1 CA#2 CA#2 0 100 200 300 IL-8 pg /m gp ro tei n * ** * * siRNA Glc-Glc+ C
A#1CA#1 CA#2CA#2 0 1 2 3 4 5 IL-6 pg /mg pr o tei n siRNA ** Glc+ Glc-C A#1 CA#1 CA#2 CA#2 0 2 4 6 8 IL-8 Fo lde xp re ss io n siRNA ** Glc+ Glc-T0 C A#1 C A#1 0 1 2 3 4 5 HeLa CXCL1 Fo ld ex pressi on siRNA N.S Glc-Glc+ C A#1 CA#1 CA#2 CA#2 0 5 10 Fol d expressi on IL-6 siRNA * Glc-Glc+ C A#1 CA#1 0 1 2 3 4 5 CXCL2 F ol d ex pres sio n * siRNA Glc+ Glc-halfCR E NF -B CRE halfC RE NF-B CRE 0 1 2 3 ATF4 binding to CXCL8 promoter Fo ld cha n g e vs halfCRE Glc + p=0.059 * Glc-Glc+ halfC RE NF -B 0.00 0.05 0.10 0.15 0.20 O D p65 binding to CXCL8 promoter
A
F
G
H
I
J
B
C
D
E
Fig. 4. ATF4 regulates cytokine mRNA and secretion in HeLa and A549 cells. (A–C) HeLa cells were transfected for 24 h with nontargeting siRNA (labeled as ‘’C” for Control siRNA) or siRNA against ATF4 (labeled “A#1” for ATF4 sequence 1). After 24 h, cells were washed and incubated in 25 (Glc+) or 2 mM glucose
(Glc−) media. qPCR for CXCL8 (A), IL-6 (B), and CXCL1 (C) is shown. Data are represented as mean± SEM (n = 3). Fold expression was calculated by normalizing to the control siRNA in Glc+conditions or time= 0 (T0) (before treatment). Asterisks denote significant differences of ATF4-transfected cells versus the control
siRNA in each culture medium. N.S. means not significant. (D, E, and H–J). A549 cells were transfected for 40 h as described in A as well as with siRNA against ATF4 (labeled“A#2” for ATF4 sequence 2) and treated with 25 mM (Glc+) or 0 mM (Glc−) glucose for 6 h (D, H, and J) or 24 h (E and I). qPCR data for CXCL8 (D),
IL-6 (H), and CXCL2 (J) were normalized to the control siRNA of Glc+. ELISA is shown for IL-8 (E) and IL-6 (I). Data are represented as mean± SEM (n = 3–5).
Asterisks denote significant differences of ATF4-transfected cells versus the control siRNA in each culture medium. (F and G) A549 cells were treated for 6 h with 25 mM (Glc+) or 0 mM (Glc−) glucose (F), or with 25 mM glucose and 10 ng/mL TNFα (G). Cells were harvested and processed for qDPI-ELISA as described in
SI Appendixfor ATF4 (F) and p65 (G). Values represent mean± SEM after normalization to the value of halfCRE-containing oligo Glc+(F, n= 4) or average of
optic density values (OD) (G, n= 2). Asterisks indicate significant differences by two-way ANOVA. Error bars represent the SEM. The significance was indicated as follows: *P< 0.05; **P < 0.01. IMM UNOLOGY AND INFLAM MATION
shortage and overcome the starvation. Interestingly, some cyto-kines, like IGFBP-2, or chemocyto-kines, like CXCL5 and CCL2, were down-regulated upon glucose deprivation even if their mRNA was induced, which was the case of TNF. This could be due to impaired N-glycosylation in the absence of glucose, and it should be tested under other starvation conditions that do not impair this protein modification.
Focusing on chemokines and cytokines involved in in-flammation, we found IL-8 and IL-6 as proteins consistently secreted from different cell lines (HeLa, A549, H460, and SW900), indicating that the response is conserved among distinct cancer cell types. Some cells analyzed here showed high basal levels of IL-6 and IL-8 (H460, SW900), which has been attrib-uted to their mutations in KRAS (32). IL-8 promotes angio-genesis, metastasis, and proliferation in lung cancer, and it is also a chemoattractant for neutrophils. Higher levels of circulating IL-8 are associated with poor prognosis and overall survival of non-small cell lung cancer patients (32). IL-6 is well-described as an activator of tumor-associated signaling cascades promoting tumor growth, immune cell infiltration, and cachexia (33). This
suggests that induction of IL-6 and IL-8 by starvation signals present in poorly irrigated tumors may worsen patient outcome. Glucose deprivation induces ER stress and the UPR, fre-quently due to the lack of flux through the glucosamine pathway, which impairs N-glycosylation. In some cell lines, the UPR and cell death can thus be prevented by readdition ofN-acetylglucosamine and substrates for glycosylation, like mannose. In A549 cells, mannose prevented cell death and IL-8 induction, butN-acetylglucosamine did not, which suggests, in accordance to a previous report, that another pathway than the PERK-driven UPR might activate ATF4 in A549 cells (23). In parallel, however, we have observed activa-tion of the ER stress sensor IRE1, which mediates immune in-filtration in cancer. In our experimental conditions, we could not detect the involvement of the IRE1–XBP1 pathway in IL-8 in-duction, but its effects on the overall response to starvation should be tested more extensively by analyzing other cytokines. ATF4 had been previously found to mediate IL-6 induction upon metabolic stress in macrophages and human tumor cells (3, 28), as well as VEGF induction (3, 4, 34). In A549, we observed that ATF4 was induced upon treatment with all starvation-promoting stimuli, and it was linked to cytokine production. IL-6 and IL-8
Fig. 5. The p65 NF-κB subunit regulates cytokine synthesis and secretion. (A–F) A549 cells were transfected for 40 h with control nontargeting siRNA (labeled as“C”) or siRNA for p65 (labeled as “p#1” for sequence 1 and “p#2” for sequence 2). Western blot of p65 is shown in A. Cells were subsequently incubated with media containing 25 mM (Glc+) or 0 mM (Glc−) glucose for 6 h (B and C), for 16 and 24 h (D), or for 24 h (E and F). qPCR for CXCL8 (B) or IL-6 (C) was
performed. Values were normalized versus control siRNA in Glc+. IL-8 (D and E) and IL-6 (F) were analyzed by ELISA. Results show mean± SEM (n = 3–4).
Asterisks denote significant differences of p65-transfected cells versus the control siRNA in each culture medium. N.S. means not significant. (G–I) HeLa cells were transfected for 24 h with siRNA (as in A) and treated for 24 h with 25 mM (Glc+) or 2 mM (Glc-) glucose. qPCR for CXCL1 (G), IL-6 (H) and CXCL8 (I) is
shown. Values are normalized versus the control siRNA in Glc+. Results show mean± SEM (n = 4). Asterisks denote significant differences of p65-transfected
cells versus the control siRNA in each culture medium. (J–L) A549 cells were treated with the NF-κB inhibitor (BAY11-7082 [BAY]) at concentrations shown with media containing 25 mM (Glc+) or 0 mM (Glc−) of glucose for 16 h. Western blot of ATF4 and IκBα is shown in J. ATF4 (K) (n = 4) was quantified and normalized
to actin. Fold induction was calculated vs. Glc−control sample. IL8 (L) was analyzed by ELISA after treating as in J. Results show average± SEM (n = 4). Asterisks denote significant differences of treated cells vs. the 0-mM control of each of the culture media. Error bars represent the SEM. The significance was indicated as follows: *P< 0.05; **P < 0.01; ***P < 0.001.
contain CRE/ATF4 binding sites in their promoters, and we describe here that ATF4 binds the IL-8 (CXCL8) promoter, so it is possible that ATF4 acts directly as a transcription factor of several of the cytokines. However, it could also be working in combination with NF-κB or CHOP, which have been shown to participate together in the induction of IL-8 transcription upon infection (35), or indirectly on some of the cytokines. Moreover, nutrients regulate epigenetic modifiers that could be contribut-ing to rewircontribut-ing transcriptional pathways under nutrient scarcity (36). On the other hand, glucose deprivation inactivates mTORC1 in our setting. While in some cells the mTORC1 in-hibitor rapamycin has been shown to induce IL-6, suggesting that this would be the cause for cytokine induction (9), our experi-ments and those from others indicate that some mTORC1 ac-tivity is required for cytokine secretion (7). Enhanced translation of specific genes during the UPR/ISR may also be contributing to promote synthesis of the cytokines (8). The transcriptional and translational links between mTOR, the UPR/ISR, and starvation are, however, far from simple, and more experiments should be performed to establish the precise role for each sig-naling pathway in the regulation of each cytokine upon different forms of starvation.
Several recent reports indicate that the metabolic rewiring of tumors interferes with antitumor immunity in many ways (reviewed by ref. 37). On one hand, tumor-derived metabolites, such as lactate or adenosine, influence the immune response. On the other hand, in the tumor microenvironment low in glucose, immunity is impaired due to a“metabolic competition” between the tumor and the T cells (38, 39). However, not only T cells are affected: The innate immune system could also play a role in immune escape. In this sense, tumor hypoxia rewires tumor-associated macrophages (40), and our data suggest that low nutrients could be promoting macrophage and neutrophil at-traction. It was also shown that inhibition of glycolysis in the tumor by using 2-DG in vitro or silencing lactate dehydrogenase A in vivo prevents the secretion of a cytokine required for the development of myeloid-derived suppressor cells, which have yet to be analyzed in the starvation settings used in our study (41). Since tumor-intrinsic factors, including chemokines, are often responsible for the differences of a T cell inflamed versus an inflammatory suppressor environment (42), we propose that cell–cell effects of cancer starvation are one of the suppressive factors impairing immune activity. In summary, our data indicate that nutrient shortage promotes a response that resembles wound healing. This response could be required to coordinate
Fig. 6. Conditioned (cond) medium promotes migration of immune cells and HUVECs. (A) A549 cells were pretreated for 16 h with conditioned (yellow) or washed conditioned (orange) media derived from other A549 cells which were cultured for 24 h with 25 (+) or 0 (−) mM glucose. Fresh Glc was added when indicated. Cells were harvested and plated in a collagen-coated plate, and attached cells were counted by crystal violet. Results were normalized to each Glc+
control and show mean± SEM (n = 4). Asterisks denote significant differences between each pair. (B and C) A549 (B) and HUVECs (C) were cultured for 24 h with media containing 25 mM glucose or with washed conditioned (orange) media of other A549 cells which were cultured as described in A; 10% FBS was added in all conditions. Fresh Glc was added when indicated. Proliferation was measured by crystal violet staining. Values were normalized to cells cultured in fresh glucose containing media (white bar). Results show mean± SEM of A549 (n = 6) and HUVEC (n = 7) experiments. Asterisks denote significant differences using one-tailed (A549) or two-tailed (HUVEC) t test as indicated. (D) HUVECs were allowed to migrate for 16 h toward washed conditioned (orange) media derived from A549 cells treated as in A. Fresh Glc was added when indicated. Migrated cells were stained by crystal violet and counted by ImageJ. Results show mean± SEM (n = 4). (E and F) Human PBMCs were allowed to migrate for 20 h toward fresh glucose-containing (25 mM) or glucose-free medium (white bars), or conditioned media (yellow bars) from A549 cells grown in glucose-containing or glucose-free medium for 24 h. Conditioned media which were refreshed are designated in orange, and elution in blue (SI Appendix, Fig. S7). Migrated cells were stained for indicated markers and analyzed by fluorescence-activated cell sorter (FACS). Data are represented as mean± SEM. CD3−CD56+(n= 5–7) and CD19+(n= 6–9). The dashed line indicates the level
of basal migration in fresh Glc+medium. Asterisks denote significant differences between cells migrated toward the Glc+control sample (white bar) or as
indicated. (G) THP-1 cells were differentiated, allowed to migrate for 20 h toward media as described in E, and counted. Data are represented as mean± SEM (n= 3–4). Asterisks denote significant differences of cells migrated toward fresh Glc+and conditioned media or as indicated. (H) HL60 cells were differentiated
and cells migrated for 2 h toward fresh (white bars) or conditioned media of H460 cells (yellow bars) which were grown for 24 h in media containing 25 (+) or 0 (−) mM glucose and 2% FBS. "−/+" indicates conditioned, glucose-free medium to which 25 mM glucose was added before the experiment. Data represent mean± SEM (n = 3). Asterisks denote significant differences of cells migrated toward fresh Glc−media using one-tailed Student t test. (I) Neutrophils were
extracted from human blood and allowed to migrate for 1 h toward conditioned media as described in H. Data are represented as mean± SEM (n = 6). Asterisks denote significant differences versus Glc+. Error bars represent the SEM. The significance was indicated as follows: *P< 0.05; **P < 0.01.
IMM
UNOLOGY
AND
INFLAM
tissue repair after an episode of ischemia, but, in the case of cancer, it could contribute to maintenance of the tumor. Methods
Cell Lines and Human-Derived Primary Cultures. Human blood samples (buffy coats) were obtained from the Banc de Sang i Teixits (BST) (Blood and Tissue Bank). Experiments were approved by the Clinical Research Ethical Com-mittee from the Hospital of Bellvitge (Comitè d’Ètica d’Investigació Clínica [CEIC]). Isolation of peripheral blood mononuclear cells (PBMCs) and neu-trophils was performed immediately after arrival of buffy coats, and primary cultures did not exceed 24 h, including experiments. Primary immune cells were cultured in pyruvate-free Dulbecco’s modified Eagle’s medium (DMEM) containing 25 mM glucose, decomplemented 10% fetal bovine serum (FBS) (heated at 57 °C for 30 min), and 2 mM freshL-glutamine at 37 °C and 5% CO2atmosphere. Primary endothelial cells (HUVEC/TERT) were cultured in
EGMTM-2 Endothelial Cell Growth Medium-2 BulletKit containing additional 10% FBS. Primary bronchial/tracheal epithelial cells (HBTECs) were cultured in Airway Epithelial Cell Basal Medium supplemented with the Bronchial Epithelial Cell Growth Kit at 37 °C and 5% CO2atmosphere.
Different cancer cell lines (lung: A549, H1299, H460, H520, SW900; cervix: HeLa; rhabdomyosarcoma: Rh4; and leukemia: HL60) were cultured in DMEM supplemented as for immune cells. Cells were maintained at 37 °C and 5% CO2atmosphere, and adherent cells were split twice a week when they
reached 90% confluence using a 0.05% trypsin ethylenediaminetetraacetic acid solution. THP-1 (leukemia) cells were grown in RPMI supplemented with 10% FBS and 1%L-glutamine and diluted once a week with fresh RPMI at a ratio of 1:20. Cells were grown in antibiotic-free medium.
Cell Treatments. Cell treatments were performed by plating 300,000 (6-well plate) or 150,000 (12-well plate) cells 24 h prior to treatment. At a conflu-ence of 80%, cells were washed twice with pyruvate-free DMEM, 0 mM glucose, and 0% FBS, and glucose-deprived cells were treated with
pyruvate-free DMEM containing 0 mM glucose, 10% dialyzed FBS, and 1%L
-gluta-mine while the control cells were supplemented with glucose at concen-trations indicated in the figures. For FBS dialysis, the dialyzing membrane was washed according to the manufacturer’s recommendations and filled with 100 mL of heat-inactivated FBS. The pipe was washed twice for 1 h and once overnight in 1 L of PBS at 4 °C while stirring. Dialyzed FBS was sterilized by using a 22-μm syringe filter.
For other treatments, cells were incubated in pyruvate-free DMEM with 25 mM glucose, 10% FBS, and 1%L-glutamine, unless indicated. For HBSS treatments, cells were washed twice and incubated in HBSS with calcium, magnesium and glucose 5.5 mM. For glutamine free treatments, cells were washed twice with glutamine-free, pyruvate-free DMEM containing 10% FBS and incubated with this medium.
Statistical Analysis. The significance of the data was calculated using the two-tailed, paired Student’s t test unless indicated differently. Two-way ANOVA followed by Sidak’s multiple comparison test was performed using Prism GraphPad. Error bars represent the SEM. The significance was indicated as follows: P< 0.05, one asterisk (*); P < 0.01, two asterisks (**) ; P < 0.001, three asterisks (***). N.S. means not significant.
For detailed materials and methods, seeSI Appendix.
Data Availability Statement. All data are included in the manuscript and supporting information.
ACKNOWLEDGMENTS. We are grateful to M. Sánchez Céspedes, E. Ballestar, M. Molina, I. Fabregat, M. Graupera, V. Soto, and R. Pérez-Tomás (Bellvitge Biomedical Research Institute) for providing cell lines; J. Moreno and M. Hernández for assistance in performing experiments; M. A. Pujana, S. Logue, I. Zuazo-Gaztelu, T. Avril, J. Obacz, and E. Hernández for help with methods; and S. J. Martin, F. Viñals, and J. Aramburu for conceptual suggestions. We thank the CERCA Program/Generalitat de Catalunya for institutional sup-port. This study has been funded by Ministerio de Ciencia, Innovación y Fig. 7. Conditioned medium from starved cells alters immune cell composition in the peritoneal cavity. (A) Conditioned medium from CT26 cells that had been incubated for 48 h with or without 25 mM 2-DG was cleared by centrifugation and further concentrated 20 times. Then 350μL of this medium were injected intraperitoneally every 24 h. Forty-eight hours after the first injection, peritoneal cells were isolated and subjected to FACS analysis using the in-dicated markers. Asterisks denote significance using Student t test (P< 0.05). (B) PBMCs were plated in the top of Boyden chambers and allowed to migrate to conditioned media from glucose-deprived A549 cells (0 mM glucose, 24 h) previously transfected for 40 h with nontargeting siRNA (control,“C”), ATF4#1 (“A#1”), or p65#1 (“p#1”), or toward conditioned medium from glucose-deprived A549 cells containing control unspecific immunoglobulin G (IgG) or neutralizing antibodies against ("α") IL-6 or IL-8. CD19+cells were measured by FACS analysis 20 h later. Results show mean± SEM of four to six experiments.
Asterisks denote significant differences between each treatment and its siRNA or antibody control. (C and D) Neutrophils or differentiated THP-1 were allowed to migrate to media described in B for 2 or 20 h, respectively, and counted. Data show mean± SEM of five to six experiments. Asterisks denote significant differences between each treatment and its siRNA or antibody control. (E) Conditioned media of H460 cells starved for 24 h (0 mM Glc, 2% FBS) were incubated with unspecific IgG or neutralizing antibodies against IL-6 or IL-8 and placed in the bottom of a Boyden chamber. Neutrophils extracted from human blood were allowed to migrate for 1 h and counted. Results show mean± SEM (n = 4–6) experiments. Asterisks denote significant differences between IgG and each treatment. Error bars represent the SEM. The significance was indicated as follows: *P< 0.05; **P < 0.01.
Universidades, part of Agencia Estatal de Investigación, through Grant BFU2016-78154-R (cofunded by the European Regional Development Fund, “A way to build Europe,” ISCIII PI13-00139); and the European Union’s
Horizon 2020 Research and Innovation Programme under the Marie Skłodowska-Curie Grant Agreements 675448 (TRAINERS) and 766214 (META-CAN).
1. L. B. Sullivan et al., Supporting aspartate biosynthesis is an essential function of res-piration in proliferating cells. Cell 162, 552–563 (2015).
2. G. Jiménez-Valerio, O. Casanovas, Angiogenesis and metabolism: Entwined for therapy resistance. Trends Cancer 3, 10–18 (2017).
3. Y. Wang et al., The unfolded protein response induces the angiogenic switch in hu-man tumor cells through the PERK/ATF4 pathway. Cancer Res. 72, 5396–5406 (2012). 4. A. Longchamp et al., Amino acid restriction triggers angiogenesis via GCN2/ATF4
regulation of VEGF and H2S production. Cell 173, 117–129.e14 (2018).
5. S. D. Prabhu, N. G. Frangogiannis, The biological basis for cardiac repair after myo-cardial infarction: From inflammation to fibrosis. Circ. Res. 119, 91–112 (2016). 6. M. Lenski, M. A. Scherer, Analysis of synovial inflammatory markers to differ
in-fectious from gouty arthritis. Clin. Biochem. 47, 49–55 (2014).
7. N. P. Shanware et al., Glutamine deprivation stimulates mTOR-JNK-dependent che-mokine secretion. Nat. Commun. 5, 4900 (2014).
8. P. A. Gameiro, K. Struhl, Nutrient deprivation elicits a transcriptional and translational inflammatory response coupled to decreased protein synthesis. Cell Rep. 24, 1415–1424 (2018).
9. S. Yoon et al., NF-κB and STAT3 cooperatively induce IL6 in starved cancer cells. On-cogene 31, 3467–3481 (2012).
10. N. El Mjiyad, A. Caro-Maldonado, S. Ramírez-Peinado, C. Muñoz-Pinedo, Sugar-free approaches to cancer cell killing. Oncogene 30, 253–264 (2011).
11. C. Alfaro et al., Interleukin-8 in cancer pathogenesis, treatment and follow-up. Cancer Treat. Rev. 60, 24–31 (2017).
12. H. Xi, M. Kurtoglu, T. J. Lampidis, The wonders of 2-deoxy-D-glucose. IUBMB Life 66, 110–121 (2014).
13. A. Levy, J. Doyen, Metformin for non-small cell lung cancer patients: Opportunities and pitfalls. Crit. Rev. Oncol. Hematol. 125, 41–47 (2018).
14. M. Bergamino et al., Fasting plasma glucose is an independent predictor of survival in patients with locally advanced non-small cell lung cancer treated with concurrent chemoradiotherapy. BMC Cancer 19, 165 (2019).
15. S. Ramírez-Peinado et al., 2-deoxyglucose induces Noxa-dependent apoptosis in al-veolar rhabdomyosarcoma. Cancer Res. 71, 6796–6806 (2011).
16. X. H. Lowman et al., The proapoptotic function of Noxa in human leukemia cells is regulated by the kinase Cdk5 and by glucose. Mol. Cell 40, 823–833 (2010). 17. H. Y. Lee et al., Ca2+-dependent demethylation of phosphatase PP2Ac promotes
glucose deprivation–induced cell death independently of inhibiting glycolysis. Sci. Signal 11, eaam7893 (2018).
18. C. L. León-Annicchiarico et al., ATF4 mediates necrosis induced by glucose deprivation and apoptosis induced by 2-deoxyglucose in the same cells. FEBS J. 282, 3647–3658 (2015).
19. P. S. Gonzalez et al., Mannose impairs tumour growth and enhances chemotherapy. Nature 563, 719–723 (2018).
20. C. C. Dibble, B. D. Manning, Signal integration by mTORC1 coordinates nutrient input with biosynthetic output. Nat. Cell Biol. 15, 555–564 (2013).
21. H. Muaddi et al., Phosphorylation of eIF2α at serine 51 is an important determinant of cell survival and adaptation to glucose deficiency. Mol. Biol. Cell 21, 3220–3231 (2010).
22. S. Shin et al., ERK2 mediates metabolic stress response to regulate cell fate. Mol. Cell 59, 382–398 (2015).
23. C. Chaveroux et al., Nutrient shortage triggers the hexosamine biosynthetic pathway via the GCN2-ATF4 signalling pathway. Sci. Rep. 6, 27278 (2016).
24. J. Obacz et al., Regulation of tumor-stroma interactions by the unfolded protein response. FEBS J. 286, 279–296 (2019).
25. C. Rubio-Patiño et al., Low-protein diet induces IRE1α-dependent anticancer im-munosurveillance. Cell Metab. 27, 828–842.e7 (2018).
26. J. Obacz et al., IRE1-UBE2D3 signaling controls the recruitment of myeloid cells to glioblastoma. bioRxiv:10.1101/533018 (31 January 2019).
27. S. E. Logue et al., Inhibition of IRE1 RNase activity modulates the tumor cell secretome and enhances response to chemotherapy. Nat. Commun. 9, 3267 (2018). 28. Y. Iwasaki et al., Activating transcription factor 4 links metabolic stress to
interleukin-6 expression in macrophages. Diabetes interleukin-63, 152–1interleukin-61 (2014).
29. K. Zhang, R. J. Kaufman, From endoplasmic-reticulum stress to the inflammatory response. Nature 454, 455–462 (2008).
30. K. L. Chong et al., Human p68 kinase exhibits growth suppression in yeast and ho-mology to the translational regulator GCN2. EMBO J. 11, 1553–1562 (1992). 31. C. García-Jiménez, C. R. Goding, Starvation and pseudo-starvation as drivers of cancer
metastasis through translation reprogramming. Cell Metab. 29, 254–267 (2019). 32. N. Sunaga et al., Oncogenic KRAS-induced interleukin-8 overexpression promotes cell
growth and migration and contributes to aggressive phenotypes of non-small cell lung cancer. Int. J. Cancer 130, 1733–1744 (2012).
33. D. E. Johnson, R. A. O’Keefe, J. R. Grandis, Targeting the IL-6/JAK/STAT3 signalling axis in cancer. Nat. Rev. Clin. Oncol. 15, 234–248 (2018).
34. K. P. Malabanan, P. Kanellakis, A. Bobik, L. M. Khachigian, Activation transcription factor-4 induced by fibroblast growth factor-2 regulates vascular endothelial growth factor-A transcription in vascular smooth muscle cells and mediates intimal thickening in rat arteries following balloon injury. Circ. Res. 103, 378–387 (2008).
35. V. Bezzerri et al., Mapping the transcriptional machinery of the IL-8 gene in human bronchial epithelial cells. J. Immunol. 187, 6069–6081 (2011).
36. M. A. Reid, Z. Dai, J. W. Locasale, The impact of cellular metabolism on chromatin dynamics and epigenetics. Nat. Cell Biol. 19, 1298–1306 (2017).
37. C. Ecker, J. L. Riley, Translating in vitro T cell metabolic findings to in vivo tumor models of nutrient competition. Cell Metab. 28, 190–195 (2018).
38. C. H. Chang et al., Metabolic competition in the tumor microenvironment is a driver of cancer progression. Cell 162, 1229–1241 (2015).
39. P.-C. Ho et al., Phosphoenolpyruvate is a metabolic checkpoint of anti-tumor T cell responses. Cell 162, 1217–1228 (2015).
40. A.-T. Henze, M. Mazzone, The impact of hypoxia on tumor-associated macrophages. J. Clin. Invest. 126, 3672–3679 (2016).
41. W. Li et al., Aerobic glycolysis controls myeloid-derived suppressor cells and tumor immunity via a specific CEBPB isoform in triple-negative breast cancer. Cell Metab. 28, 87–103.e6 (2018).
42. J. Li et al., Tumor cell-intrinsic factors underlie heterogeneity of immune cell in-filtration and response to immunotherapy. Immunity 49, 178–193.e7 (2018).
IMM
UNOLOGY
AND
INFLAM