HAL Id: hal-02267190
https://hal.archives-ouvertes.fr/hal-02267190
Submitted on 19 Aug 2019
HAL is a multi-disciplinary open access archive for the deposit and dissemination of sci-entific research documents, whether they are pub-lished or not. The documents may come from teaching and research institutions in France or abroad, or from public or private research centers.
L’archive ouverte pluridisciplinaire HAL, est destinée au dépôt et à la diffusion de documents scientifiques de niveau recherche, publiés ou non, émanant des établissements d’enseignement et de recherche français ou étrangers, des laboratoires publics ou privés.
High-altitude and long-range transport of aerosols
causing regional severe haze during extreme dust storms
explains why afforestation does not prevent storms
Ping Guo, Shaocai Yu, Liqiang Wang, Pengfei Li, Zhen Li, Khalid Mehmood,
Xue Chen, Weiping Liu, Yannian Zhu, Xing Yu, et al.
To cite this version:
Ping Guo, Shaocai Yu, Liqiang Wang, Pengfei Li, Zhen Li, et al.. High-altitude and long-range trans-port of aerosols causing regional severe haze during extreme dust storms explains why afforestation does not prevent storms. Environmental Chemistry Letters, Springer Verlag, 2019, 17 (3), pp.1333-1340. �10.1007/s10311-019-00858-0�. �hal-02267190�
Environmental Chemistry Letters (2019) 17:1333–1340 https://doi.org/10.1007/s10311-019-00858-0
ORIGINAL PAPER
High‑altitude and long‑range transport of aerosols causing regional
severe haze during extreme dust storms explains why afforestation
does not prevent storms
Ping Guo1 · Shaocai Yu1,2 · Liqiang Wang1 · Pengfei Li1,7 · Zhen Li1 · Khalid Mehmood1 · Xue Chen1 · Weiping Liu1 ·
Yannian Zhu3 · Xing Yu3 · Kiran Alapaty4 · Eric Lichtfouse5 · Daniel Rosenfeld6 · John H. Seinfeld2
Received: 14 October 2018 / Accepted: 19 January 2019 / Published online: 14 March 2019 © Springer Nature Switzerland AG 2019
Abstract
Climate change is predicted to induce more extreme events such as storms, heat waves, drought and floods. Dust storms are frequently occurring in northern China. Those storms degrade air quality by decreasing visibility and inducing cardiovascular and respiratory diseases. To control dust storms, the Chinese government has launched a large-scale afforestation program by planting trees in arid areas, but the effectiveness of this program is still uncertain because the trajectories and altitudes of dust transport are poorly known. In particular, afforestation would be effective only if dust transport occurs at low altitudes. To test this hypothesis, we analyzed the extreme dust storm from May 2 to 7, 2017, which resulted in record-breaking dust loads over northern China. For that, we used dust RGB-composite data from the Himawari-8 satellite and the cloud-aerosol lidar, moderate-resolution imaging spectroradiometer data, and surface monitoring data. The source regions of the dust storms were identified using the hybrid single-particle Lagrangian integrated trajectory model and infrared pathfinder satellite observa-tion. Contrary to our hypothesis, results show that dust is transported at high altitude of 1.0–6.5 km over long distances from northwestern China. This finding explains why the afforestation has not been effective to prevent this storm. Results also disclose the highest particulate matter (PM) concentrations of 447.3 μg/m3 for PM
2.5 and 1842.0 μg/m3 for PM10 during the
dust storm. Those levels highly exceed Chinese ambient air quality standards of 75 μg/m3 for PM
2.5 and 150 μg/m3 for PM10.
Keywords Regional severe haze · Massive dust storm · Satellite observation · Optical properties
Introduction
Climate change is predicted to modify the frequency of extreme events such as heat waves, heavy precipitation, and storms (Beniston et al. 2007). Dust affects atmospheric
dynamics, cloud formation, and air temperature (Evan et al.
2008; Seinfeld and Pandis 2016; Kim et al. 2017). Sky-borne dusts are transported over long distance and degrade air quality by decreasing visibility and inducing cardiovas-cular and respiratory diseases (Ichinose et al. 2008; Shen
* Shaocai Yu
shaocaiyu@zju.edu.cn; shaocaiy@caltech.edu * Pengfei Li
lpf_zju@163.com
1 Research Center for Air Pollution and Health, Key
Laboratory of Environmental Remediation and Ecological Health, Ministry of Education, College of Environmental and Resource Sciences, Zhejiang University,
Hangzhou 310058, Zhejiang, People’s Republic of China
2 Division of Chemistry and Chemical Engineering, California
Institute of Technology, Pasadena, CA 91125, USA
3 Meteorological Institute of Shaanxi Province, 36
Beiguanzhengjie, Xi’an 710015, China
4 Systems Exposure Division, National Exposure Research
Laboratory, U.S. Environmental Protection Agency (EPA), Research Triangle Park, NC 27711, USA
5 Aix-Marseille Univ, CNRS, IRD, INRA, Coll France,
CEREGE, Avenue Louis Philibert, 13100 Aix en Provence, France
6 Institute of Earth Sciences, The Hebrew University
of Jerusalem, Jerusalem, Israel
7 College of Science and Technology, Agricultural
University of Hebei, Baoding 071000, Hebei, People’s Republic of China
Ping Guo1, Shaocai Yu1,2, Liqiang Wang1, Pengfei Li1,7, Zhen Li1, Khalid Mehmood1, Xue Chen1, Weiping Liu1,
1334 Environmental Chemistry Letters (2019) 17:1333–1340
1335 Environmental Chemistry Letters (2019) 17:1333–1340
et al. 2009; Johnston et al. 2011; Kang et al. 2013; Crooks et al. 2016; Kim et al. 2017; Bi et al. 2016; Sun et al. 2018). Eastern Asia is one of the largest sources of dust worldwide with annual amounts of about 800 Tg atmospheric dust, fre-quently occurring in spring (Zhang et al. 1997). Asian dust storms originate mainly from the desert and Gobi regions located in Inner Mongolia of China, the Taklamakan Desert in Xin Jiang Province of China, and southern Mongolia (Bishop et al. 2002; Shao and Dong 2006; Cao et al. 2008; Tan et al. 2017). In China, desert and Gobi areas account for about 13% of the country’s total land area and are thus abundant sources of dust storms (Song 2004).
In recent years, dust storms have seriously impacted northern China (NC) and downwind areas. For instance, an intense dust storm occurred from March 29 to April 7, 2007, during which the average concentration of total suspended particulate matter (TSP) was 4198.6 μg/m3 with an extreme
peak of 9607.4 μg/m3 on March 31 (Huang et al. 2010). In
Beijing, PM10 concentrations for two dust storms on March
28 and April 28, 2012 reached 755 μg/m3and 767 μg/m3,
respectively, reducing visibility and causing substantial eco-nomic losses (Liu et al. 2014).
Aerosol spectral optical properties are primary param-eters governing scattering and absorption of solar radiation (Jung et al. 2017). In addition to aerosols from anthropo-genic emissions, dust aerosols have prominent influences on radiative forcing (IPCC 2013). Aerosol optical thickness (AOT) observed by the aerosol robotic network AERONET provides an assessment of global aerosol properties (Holben et al. 1998). Bi et al. (2016) showed that Asian dust has a high light scattering propensity single-scattering albedo (SSA) of 0.935 at 550 nm and a low wavelength dependence of optical properties, shown by an angström exponent (AE) of 0.2 at 440–870 nm.
Ground-based observations and satellite remote sensing are used to track the sources, transport paths, and optical properties of dust aerosols. For instance, Tong et al. (2012)
obtained aerosol concentration data from the interagency monitoring of protected visual environments network (IMPROVE) and analyzed the characteristics of dust storms in the western U.S.. The hybrid single-particle Lagrangian integrated trajectory model HYSPLIT has been used to identify the transport paths of dust storms (Yu et al. 2014; Mamouri et al. 2016; Jung et al. 2017; Wang et al. 2017; Sun et al. 2018). The vertical structure of dust aerosols based on cloud-aerosol lidar with orthogonal polarization (CALIOP) is used to track dust storms on a global scale since June 2006 (Hunt et al. 2009). Satellite-retrieved aerosol optical properties, e.g., aerosol optical thickness (AOT), angström exponent (AE), and single-scattering albedo (SSA), have also been compared with data from the European aero-sol research lidar network (EARLINET) and AERONET (Mamouri et al. 2016).
Here, we analyzed the massive dust storm that occurred over northern China during May 2 to 7, 2017 with multiple data sources; we determined the origins and track trajec-tories of air masses with the HYSPLIT model and cloud-aerosol lidar and infrared pathfinder satellite observation (CALIPSO). Additionally, we analyzed the optical proper-ties of dust aerosols based on data provided by the AER-ONET network to investigate the radiative impacts of dust aerosols.
Experiments
Data sourcesThe dust red green blue (RGB)-composite product was provided at hourly intervals by the Himawari-8 satellite and is used to monitor dust transport events (http://rammb .cira.colos tate.edu/ramsd is/onlin e/himaw ari-8.asp). The composite is produced from a combination of three infra-red channels of SEVIRI: IR 12.3-IR 11.2 (infra-red), IR 11.2-IR 8.6 (green), and 11.2-IR 11.2 (blue). The dust RGB images are described in detail by Lensky and Rosenfeld (2008). Daily particle concentrations with PM2.5 and PM10 from May 2 to 7, 2017, were obtained from online monitoring and analysis platform for air quality in China, at https :// www.aqist udy.cn.
The CALIOP instruments provide vertical profiles and depolarization measurements of aerosol and cloud layers at 532 and 1064 nm near nadir. Detailed information about CALIPSO and its instruments is described by Winker et al. (2003) and Hunt et al. (2009). This current study used total attenuated backscatter at 532 nm and aerosol sub-types based on color-modulated, altitude-time images of CALIPSO, version 3.4, on May 5, 2017, 2:42 Beijing time (BT) and May 6, 2017, 3:26 BT.
Fig. 1 a: Himawari-8 satellite RGB-composite images showing dust
in northern China from May 2 to 7, 2017. The white lines denote Chi-na’s boundaries. The pink and purple colors represent dust. The dust plumes move from west to east. b and c: Daily averaged observed concentrations of PM2.5 and PM10 (μg/m3), respectively, at the
moni-toring site over China. Sparse dust layer was observed on May 2, and visually dense dust plumes are clearly seen over western Inner Mongolia at 22:00, May 3. These layers moved to the middle and east areas. The most widely affected dust loads were observed over many areas in northern China on May 4 and 5. The dust slowly decreased and dissipated on May 6 and 7. The daily average values of both PM2.5 and PM10 in northern China were relatively low on May 2, as
sporadic higher levels in northern China began to occur on May 3. The highest concentrations occurred on May 4 and 5, with the high-est PM2.5 and PM10 concentrations of 447.3 μg/m3 and 1842.0 μg/m3,
respectively. High PM2.5 and PM10 concentrations seriously affected
air quality. RGB red green blue. PM particulate matter. PM2.5
particu-lates with a diameter of 2.5 μm or less ◂
1336 Environmental Chemistry Letters (2019) 17:1333–1340
1 3
Land surface elements of global ecological patterns were characterized by an ecophysiographic stratification of the earth. The stratification promoted 3923 terrestrial ecologi-cal land units (ELU). In this study, the data characterizing desert, Gobi, and sandy lands were extracted from the ELU at a base resolution of 250 m. The Three-North Shelter For-est Program, launched in 1978, focuses on soil and water conservation and desertification control by planting trees in semiarid and arid areas. See detail in Zhang et al. (2016).
Moderate-resolution imaging spectroradiometer (MODIS) products at the Beijing site (39.98°N, 116.38°E), provided by the AERONET, are applied to illustrate dust
aerosol optical characteristics, at https ://aeron et.gsfc. nasa.gov. In order to further analyze the effects of fine and coarse particles on optical properties, the validated aerosol optical thickness (AOT) at 440, 500, 675, 870, and 1020 nm was obtained during May 2 and 7, 2017. Unfor-tunately, size distributions on May 3 and 5, AOT and AE on May 3, and SSA on May 3, 5, 6, and 7 are not available because of missing data. Moreover, we also estimated the effects of aerosols on radiative forcing through volume aerosol size distributions (dV/dlnr), angström exponent (AE) at 440–870 nm, and single-scattering albedo (SSA) at 440, 670, 870, and 1020 nm.
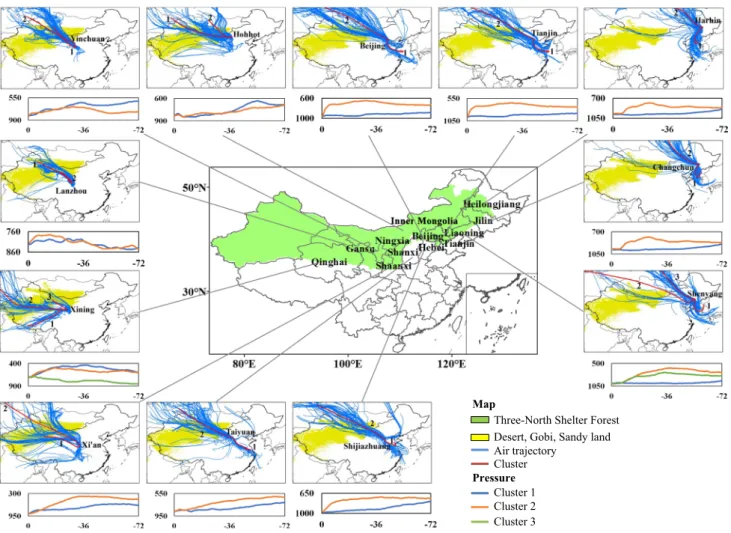
Three-North Shelter Forest Desert, Gobi, Sandy land
Cluster 1 Cluster 2 Cluster 3 Map Pressure Air trajectory Cluster
Fig. 2 72 h air mass backward trajectories at 12 cities from May 2 to 7, 2017. The locations of the 12 cities are displayed in the mid-dle map. In the surrounding maps, the airflow back trajectories (blue lines) and their clusters (red lines) at each city are presented in the top panels, and the pressure characteristics (hPa) of cluster-mean back trajectories are shown in the bottom panels. The blue, red, and green lines in the pressure diagrams correspond to clusters 1, 2 and, 3, respectively. Most of the air flows are mainly from northwest China. Trajectories were divided into two or three clusters in 12 cit-ies, and all of the main contribution clusters were found to primarily originate from northwestern China and western Outer Mongolia. The mean altitude of the trajectories remained between 1.0 and 6.5 km.
This illustrates why the Three-North Shelter Forest Program did not play a role in prevention of the dust storm for this case. This is due to the long-range and high-altitude transport of dust, whereas the Three-North Shelter Forest Program can only mainly improve the local cli-mate and is good for windbreak and sand fixation. The data of desert, Gobi, and sandy land, extracted from the ecological land units (ELU) at a base resolution of 250 m, show that abundant dust sources are located in the northwest of China (northern Xinjiang, northwestern Qinghai and Gansu, and western Inner Mongolia) and the southern part of the Outer Mongolia. The airflow carried large amounts of dust from this region through high-altitude transport to northern China’s provinces during the dust storm
1337 Environmental Chemistry Letters (2019) 17:1333–1340
Back‑trajectory model configuration
To investigate the effects of transport sources on air qual-ity during the dust storm in northern China, the HYSPLIT model was used to calculate air mass back trajectories (Wang et al. 2009; Yu et al. 2014, http://ready .arl.noaa. gov/HYSPL IT.php). The 72 h back trajectories were calcu-lated every 2 h at 100 m above surface from 12 monitoring sites of two municipalities, Beijing and Tianjing, and ten provincial capital cities: Harbin, Changchun, Shenyang, Shijiazhuang, Taiyuan, Xi’an, Xining, Lanzhou, Yinchuan, and Hohhot. The national centers for environmental pre-diction final analyses (NCEP FNL) fields, retrieved from NOAA data with a spatial resolution of 0.5 × 0.5° at every 3 h, were used as input meteorological data.
Results and discussion
Atmospheric characteristics in northern China derived from satellite and surface observations Figure 1a presents dust RGB-composite images during May 2 to May 7, 2017. A sparse dust layer is observed on May 2 (top image). Then, visually dense dust plumes are clearly formed over western Inner Mongolia at 22:00, May 3. These layers moved to the middle and east areas. The most widely affected dust loads are then observed over many areas in northern China on May 4 and 5. The dust then slowly decreased and dissipated on May 6 and 7 (bottom image).
Figure 1b, c presents the spatial distributions of the daily averaged variations of particulate matter PM2.5 and PM10
concentrations at each monitoring station during the dust storm. PM2.5 refers to particulates with a diameter of 2.5 μm
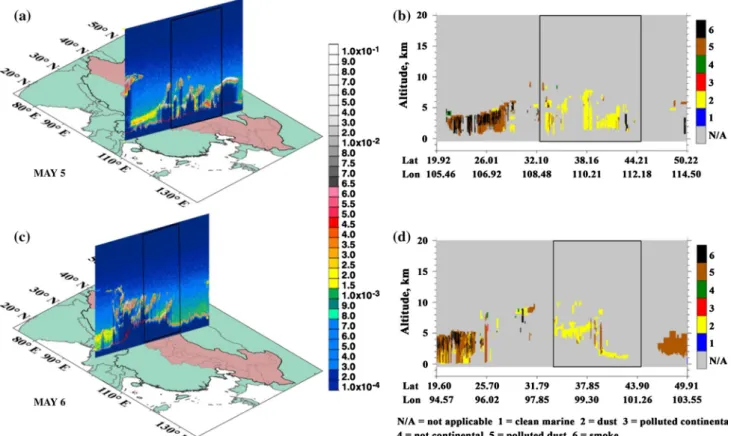
Fig. 3 CALIPSO a total attenuated backscatter profiles and b aerosol
subtype at 532 nm on May 5, 2017, 2:42 Beijing time (BT); c total attenuated backscatter profiles and d aerosol subtype at 532 nm on May 6, 2017, 3:26 BT. The black boxes represent the study regions along orbits. The aerosol layer structures including the total attenu-ated backscatter profiles at 532 nm and aerosol subtypes transporting from west to east were captured by two CALIPSO overpass obser-vations at 2:42, May 5, 2017 and at 3:26, May 6, 2017. On May 5, the total attenuated backscatter profiles clearly show the existence of multiple aerosol layers over Shaanxi, Shanxi, and Inner
Mongo-lia. Intensive aerosol layers were detected from 1.5 to 8.0 km. The aerosol layers for the second overpass on May 6 were slightly lower and concentrated between 1.0 and 7.0 km over Qinghai, Ningxia, and Inner Mongolia, especially in Inner Mongolia where the height reached only up to 1.9 km due to the eastward movements of the cyclonic flow. Aerosol subtype images provide information about the vertical structures of the aerosol layer. It can be seen that the aerosol types are identified as dust accompanied by a small amount of other anthropogenic species during the dust storm
1338 Environmental Chemistry Letters (2019) 17:1333–1340
1 3
or less. The daily average values of both PM2.5 and PM10 in northern China were relatively low on May 2 (top). Spo-radic higher levels began to occur on May 3 in northern China. Then, the highest concentrations occurred on May 4 and 5, with the highest PM2.5 and PM10 concentrations of 447.3 μg/m3 and 1842.0 μg/m3, respectively. Those levels
highly exceed the limits of the GB 3095-2012 Secondary Chinese Ambient Air quality Standard CAAQS of 75 μg/ m3 for PM
2.5 and 150 μg/m3 for PM10. High PM2.5 and PM10
concentrations thus seriously degraded air quality. Origins of the dust storm engulfing northern China Figure 2 shows transport pathways of airflow using back-trajectory analyses during the dust storm. Trajectories were classified into two or three clusters in 12 cities. All of the main contributing clusters originated from northwestern China and western Outer Mongolia. The mean altitude of the trajectories remained between 1.0 and 6.5 km. This illus-trates why the Three-North Shelter Forest Program (Zhang et al. 2016) as one of the most enterprising meteorological-modification programs of the twentieth century in China, did not prevent this dust storm. Indeed, this program can only improve the local climate at low altitude, e.g., for windbreak and sand fixation.
The data from the desert, Gobi, and sandy land, extracted from the ecological land units (ELU) at a base resolution of 250 m, show that abundant dust sources are located in the northwest of China, e.g., northern Xinjiang, northwestern Qinghai and Gansu, and western Inner Mongolia, and in the southern part of the Outer Mongolia. The airflow car-ried large amounts of dust through high-altitude transport to provinces of northern China during the dust storm.
Figure 3 shows that the aerosol layer structures, including the total attenuated backscatter profiles at 532 nm and aero-sol subtypes transporting from west to east, were captured by two CALIPSO overpass observations at 2:42, May 5, 2017 and at 3:26, May 6, 2017. On May 5, the total attenuated backscatter profiles clearly show the existence of multiple aerosol layers over Shaanxi, Shanxi, and Inner Mongolia. Massive aerosol layers were detected from 1.5 to 8.0 km, consistent with the previous results (Fig. 3a). The aerosol layers for the second overpass on May 6 were slightly lower and concentrated between 1.0 and 7.0 km over Qinghai, Ningxia, and Inner Mongolia. Yet in Inner Mongolia, the aerosol height reached up to 1.9 km due to the eastward movements of the cyclonic flow (Fig. 3c).
Aerosol subtype images provide information about the vertical structures of the aerosol layer (Fig. 3b, d). Here, it can be seen that the aerosol is composed of dust accom-panied by a small amount of other anthropogenic species during the dust storm.
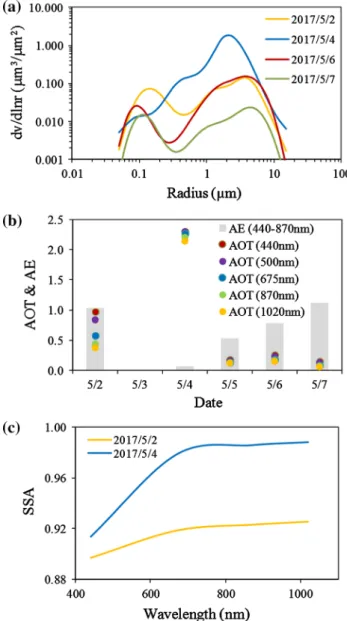
Impacts of dust on optical and radiative variables Figure 4 presents time series of aerosol optical properties at the Beijing site from May 2 to May 7, 2017. We studied two types of size distributions: the fine mode with radius lower than 0.6 μm and the coarse mode with radius higher than 0.6 μm (Dubovik et al. 2002). Figure 4a shows that size distributions are primarily influenced by the coarse mode. On May 2, the dust storm has not reached Beijing. Then, the size distribution is unimodal on May 4. At this date, the coarse mode has increased dramatically and the peak value of number concentration in the coarse mode is around 2.2 μm as a result of the dust transport.
The daily averaged trends of aerosol optical thickness (AOT) at various different wavelengths from 440 to 1020 nm have similar trends, and the amounts of AOT440nm are the
highest among them (Fig. 4b). The maximum retrievable AOT440nm value is 2.3 on May 4, when the dust plume is the densest. Daily averaged variations of the angström exponent (AE) values at 440–870 nm are almost the opposite of the AOT (Fig. 4b).
Because the AE presents a negative correlation with par-ticle diameters (Eck et al. 1999), greatly lower AE values reflect larger aerosol particles. As shown by Bi et al. (2016), Asian dust has a low wavelength dependence of optical prop-erties with AE of about 0.2 at 440–870 nm. In addition, single-scattering albedo (SSA) is also one of the crucial fac-tors used in assessing the aerosol effects on radiative forcing and climate change (Jacobson 2000; Yu et al. 2000). In our results, SSA values at the four wavelengths, 440, 670, 870, and 1020 nm, are similar and range from 0.90 to 0.93 with an average of 0.92 ± 0.02 on May 2 (Fig. 4c). Subsequently, the values increased on May 4, illustrating that external dust aerosols may strengthen aerosol scattering.
Conclusion
Severe dust episodes over northern China are caused by long-range transported dust from northwestern China and western Outer Mongolia. A massive dust storm occurred in northern China from May 2 to 7, 2017. The downwind area was affected by the dust storm, and the air quality strongly deteriorated in a short time. During this period, high PM2.5 and PM10 concentrations were observed in northwestern China with maximum values of 447.3 μg/m3 and 1842.0 μg/
m3, respectively. During the storm, aerosols were
concen-trated vertically from 1.0 to 8.0 km, and the aerosol types were identified as dust accompanied by a small amount of anthropogenic emissions during the dust storm. The dust was thus transported at high altitudes, which made the Three-North Shelter Forest Program inefficient in this case.
1339 Environmental Chemistry Letters (2019) 17:1333–1340
Therefore, it needs to accurately locate the source of dust in order to reduce hazards of dust storms.
The air mass back-trajectory clusters originated primar-ily from northwestern China and southern Outer Mongolia. Additionally, aerosol size distributions during the dust storm were primarily influenced by the coarse mode particles. A significant increase in coarse particles led to high concen-trations of PM10, especially on May 4. Extreme values of aerosol optical thickness and single-scattering albedo (SSA) and low values of angström exponent were observed when the dust plume was the most dense.
Acknowledgements This work was partially supported by the
Depart-ment of Science and Technology of China (Nos. 2016YFC0202702; 2014BAC22B06) and National Natural Science Foundation of China (No. 21577126). This work was also supported by the Joint NSFC–ISF Research Program (No. 41561144004), jointly funded by the National Natural Science Foundation of China and the Israel Science Founda-tion. Part of this work was also supported by the “Zhejiang 1000 Talent Plan” and Research Center for Air Pollution and Health in Zhejiang University. The views expressed in this presentation are those of the author(s) and do not necessarily represent those of the US EPA.
References
Beniston M, Stephenson DB, Christensen OB, Ferro CAT, Frei C, Goyette S, Halsnaes K, Holt T, Jylhä K, Koffi B, Palutikof J, Schöll R, Semmler T, Woth K (2007) Future extreme events in European climate: an exploration of regional climate model pro-jections. Clim Change 81(Suppl 1):71. https ://doi.org/10.1007/ s1058 4-006-9226-z
Bi J, Huang J, Holben B, Zhang G (2016) Comparison of key absorp-tion and optical properties between pure and transported anthropo-genic dust over East and Central Asia. Atmos Chem Phys 16:1–37. https ://doi.org/10.5194/acp-16-15501 -2016
Bishop JK, Davis RE, Sherman JT (2002) Robotic observations of dust storm enhancement of carbon biomass in the North Pacific. Science 298:817–821. https ://doi.org/10.1126/scien ce.10749 61 Cao JJ, Chow JC, Watson JG, Wu F, Han YM, Jin ZD, Shen ZX, An
ZS (2008) Size-differentiated source profiles for fugitive dust in the Chinese Loess Plateau. Atmos Environ 42:2261–2275. https ://doi.org/10.1016/j.atmos env.2007.12.041
Crooks JL, Cascio WE, Percy MS, Reyes J, Neas LM, Hilborn ED (2016) The association between dust storms and daily non-acci-dental mortality in the United States, 1993–2005. Environ Health Persp 124:1735–1743. https ://doi.org/10.1289/EHP21 6
Dubovik O, Holben B, Eck TF, Smirnov A, Kaufman YJ, King MD, Tanré D, Slutsker I (2002) Variability of absorption and opti-cal properties of key aerosol types observed in worldwide loca-tions. J Atmos Sci 59:590–608. https ://doi.org/10.1175/1520-0469(2002)059%3c059 0:VOAAO P%3e2.0.CO;2
Eck TF, Holben BN, Reid JS, Dubovik O, Smirnov A, O’Neill NT, Slutsker I, Kinne S (1999) Wavelength dependence of the optical depth of biomass burning, urban, and desert dust aerosols. J Geo-phys Res Atmos 104:31333–31349. https ://doi.org/10.1029/1999J D9009 23
Evan AT, Heidinger AK, Bennartz R, Bennington V, Mahowald NM, Corrada-Bravo H, Velden CS, Myhre G, Kossin JP (2008) Ocean temperature forcing by aerosols across the Atlantic tropi-cal cyclone development region. Geochem Geophys Geosyst 9:Q05V04. https ://doi.org/10.1029/2007G C0017 74
Fig. 4 Daily average variations for a aerosol size distributions, b aerosol optical thickness (AOT) and Ångström exponent (AE) at 440, 500, 675, 870, and 1020 nm, and c single-scattering albedo (SSA) at 440, 670, 870, and 1020 nm from May 2 to 7, 2017. Basically, two types of size distributions are classified: the fine mode with radius lower than 0.6 μm and the coarse mode with radius higher than 0.6. On May 2, the dust storm has not reached Beijing. The size distribu-tion appeared unimodal on May 4. At this time, the coarse mode has increased dramatically and the peak value is around 2.2 μm as a result of the dust transport. The daily averaged trends of AOT at five dif-ferent wavelengths (440, 500, 675, 870, and 1020 nm) are consistent, and the amounts of AOT440nm are the uppermost among them. The
maximum retrievable AOT440nm value is 2.3 on May 4, when the dust
plume is the densest. Daily averaged variations of AE values at 440– 870 nm are almost the opposite of the AOT. SSA values at the four wavelengths (440, 670, 870, and 1020 nm) are close and ranged from 0.90 to 0.93 with an average of 0.92 ± 0.02 on May 2. Subsequently, the values increased on May 4, illustrating that external dust aerosols may strengthen aerosol scattering
1340 Environmental Chemistry Letters (2019) 17:1333–1340
1 3
Holben BN, Eck TF, Slutsker I, Tanré D, Buis JP, Setzer A, Vermote E, Reagan JA, Kaufman YJ, Nakajima T, Lavenu F, Jankowiak I, Smirnov A (1998) AERONET-A federated instrument network and data archive for aerosol characterization. Remote Sens Envi-ron 66:1–16. https ://doi.org/10.1016/S0034 -4257(98)00031 -5 Huang K, Zhuang GS, Li J, Wang QZ, Sun Y, Lin YF, Fu JS (2010)
Mixing Asian dust with pollution aerosol and the transforma-tion of aerosol components during the dust storm over China in spring 2007. J Geophys Res Atmos 115:1307–1314. https ://doi. org/10.1029/2009J D0131 45
Hunt WH, Winker DM, Vaughan MA, Powell KA, Lucker PL, Weimer C (2009) CALIPSO lidar description and performance assessment. J Atmos Ocean Technol 26:1214–1228. https ://doi. org/10.1175/2009J TECHA 1223.1
Ichinose T, Yoshida S, Hiyoshi K, Sadakane K, Takano H, Nishikawa M, Mori I, Yanagisawa R, Kawazato H, Yasuda A, Shibamoto T (2008) The effects of microbial materials adhered to Asian sand dust on allergic lung inflammation. Arch Environ Contam Toxicol 55:348–357. https ://doi.org/10.1007/s0024 4-007-9128-8 IPCC (2013) Climate change 2013: the physical science basis:
con-tribution of working group I to the fifth assessment report of the intergovernmental panel on climate change. Volume IPCC WGI fifth assessment report. Cambridge University Press, Cambridge Jacobson MZ (2000) A physically-based treatment of elemental carbon
optics: implications for global direct forcing of aerosols. Geophys Res Lett 27:217–220. https ://doi.org/10.1029/1999G L0109 68 Johnston F, Hanigan I, Henderson S, Morgan G, Bowman D (2011)
Extreme air pollution events from bushfires and dust storms and their association with mortality in Sydney, Australia 1994– 2007. Environ Res 111:811–816. https ://doi.org/10.1016/j.envre s.2011.05.007
Jung J, Yu JA, Lyu Y, Lee M, Hwang T, Lee S (2017) Ground-based characterization of aerosol spectral optical properties of haze and Asian dust episodes under Asian continental outflow dur-ing winter 2014. Atmos Chem Phys 17:5297–5309. https ://doi. org/10.5194/acp-2016-961
Kang JH, Liu TC, Keller J, Lin HC (2013) Asian dust storm events are associated with an acute increase in stroke hospitalisation. J Epidemiol Commun H 67:125–131. https ://doi.org/10.1136/jech-2011-20079 4
Kim D, Chin M, Kemp EM, Tao ZN, Peters-Lidard CD (2017) Devel-opment of high-resolution dynamic dust source function—a case study with a strong dust storm in a regional model. Atmos Environ 159:11–25. https ://doi.org/10.1016/j.atmos env.2017.03.045 Lensky IM, Rosenfeld D (2008) Clouds-aerosols-precipitation satellite
analysis tool (CAPSAT). Atmos Chem Phys 8:6739–6753. https ://doi.org/10.5194/acp-8-6739-2008
Liu QY, Liu YJ, Yin JX, Zhang MG, Zhang TT (2014) Chemical characteristics and source apportionment of PM10 during Asian
dust storm and non-dust storm days in Beijing. Atmos Environ 91:85–94. https ://doi.org/10.1016/j.atmos env.2014.03.057 Mamouri RE, Ansmann A, Nisantzi A, Solomos S, Kallos G,
Hadjimitsis DG (2016) Extreme dust storm over the eastern Mediterranean in September 2015: satellite, lidar, and sur-face observations in the Cyprus region. Atmos Chem Phys 16:13711–13724. https ://doi.org/10.5194/acp-16-13711 -2016 Seinfeld JH, Pandis SN (2016) Atmospheric chemistry and physics:
from air pollution to climate change, 3rd edn. Wiley, Hoboken, pp 970–972
Shao Y, Dong CH (2006) A review on East Asian dust storm climate, modelling and monitoring. Glob Planet Change 52:1–22. https ://doi.org/10.1016/j.glopl acha.2006.02.011
Shen ZX, Cao JJ, Arimoto R, Han ZW, Zhang RJ, Han YM, Liu SX, Okuda T, Nakao S, Tanaka S (2009) Ionic composition of TSP and PM2.5 during dust storms and air pollution episodes
at Xi’an. China Atmos Environ 43:2911–2918. https ://doi. org/10.1016/j.atmos env.2009.03.005
Song Z (2004) A numerical simulation of dust storms in China. Envi-ron Model Softw 19:141–151. https ://doi.org/10.1016/S1364 -8152(03)00116 -6
Sun T, Che H, Qi B, Wang Y, Dong Y, Xia X, Wang H, Gui K, Zheng Y, Zhao H, Ma Q, Du R, Zhang X (2018) Aerosol optical char-acteristics and their vertical distributions under enhanced haze pollution events: effect of the regional transport of different aerosol types over eastern China. Atmos Chem Phys 18:1–45. https ://doi.org/10.5194/acp-18-2949-2018
Tan SC, Li JW, Che HZ, Chen B, Wang H (2017) Transport of East Asian dust storms to the marginal seas of China and the southern North Pacific in spring 2010. Atmos Environ 148:316–328. https ://doi.org/10.1016/j.atmos env.2016.10.054
Tong DQ, Dan M, Wang T, Lee P (2012) Long-term dust climatology in the western United States reconstructed from routine aerosol ground monitoring. Atmos Chem Phys 12:5189–5205. https ://doi. org/10.5194/acp-12-5189-2012
Wang YQ, Zhang XY, Draxler D (2009) TrajStat: GIS-based software that uses various trajectory statistical analysis methods to identify potential sources from long-term air pollution measurement data. Environ Model Softw 24:938–939. https ://doi.org/10.1016/j.envso ft.2009.01.004
Wang S, Yu S, Li P, Wang L, Mehmood K, Liu W, Yan R, Zheng X (2017) A study of characteristics and origins of haze pollu-tion in Zhengzhou, China, based on observapollu-tions and hybrid receptor models. Aerosol Air Qual Res 17:513–528. https ://doi. org/10.4209/aaqr.2016.06.0238
Winker DM, Pelon J, McCormick MP (2003) The CALIPSO mission: spaceborne lidar for observation of aerosols and clouds. Proc SPIE 4893:1211–1229. https ://doi.org/10.1117/12.46653 9
Yu S, Saxena VK, Wenny BN, Deluisi JJ, Yue GK, Petropavlovskikh IV (2000) A study of the aerosol radiative properties needed to compute direct aerosol forcing in the southeastern United States. J Geophys Res Atmos 105:24739–24749. https ://doi. org/10.1029/2000J D9003 46
Yu S, Zhang Q, Yan R, Wang S, Li P, Chen B, Liu W, Zhang X (2014) Origin of air pollution during a weekly heavy haze episode in Hangzhou, China. Environ Chem Lett 12:543–550. https ://doi. org/10.1007/s1031 1-014-0483-1
Zhang XY, Arimoto R, An ZS (1997) Dust emission from Chinese desert sources linked to variations in atmospheric circulation. J Geophys Res 102:28041–28047. https ://doi.org/10.1029/97JD0 2300
Zhang Y, Peng CH, Li WZ, Tian LX, Zhu Q, Chen H, Fang XQ, Zhang GL, Liu GB, Mu XM, Li ZB, Li SQ, Yang YZ, Wang J, Xiao XM (2016) Multiple afforestation programs accelerate the greenness in the ‘Three North’ region of China from 1982 to 2013. Ecol Indic 61:404–412. https ://doi.org/10.1016/j.ecoli nd.2015.09.041
Publisher’s Note Springer Nature remains neutral with regard to