HAL Id: hal-00634519
https://hal.univ-brest.fr/hal-00634519
Submitted on 7 May 2021
HAL is a multi-disciplinary open access
archive for the deposit and dissemination of
sci-entific research documents, whether they are
pub-lished or not. The documents may come from
teaching and research institutions in France or
abroad, or from public or private research centers.
L’archive ouverte pluridisciplinaire HAL, est
destinée au dépôt et à la diffusion de documents
scientifiques de niveau recherche, publiés ou non,
émanant des établissements d’enseignement et de
recherche français ou étrangers, des laboratoires
publics ou privés.
Distributed under a Creative Commons Attribution| 4.0 International License
E. Goberville, Gregory Beaugrand, Benoit Sautour, Paul Tréguer, Team
Somlit
To cite this version:
E. Goberville, Gregory Beaugrand, Benoit Sautour, Paul Tréguer, Team Somlit. Climate-driven
changes in coastal marine systems of western Europe. Marine Ecology Progress Series, Inter
Re-search, 2010, 408, pp.129-148. �10.3354/meps08564�. �hal-00634519�
INTRODUCTION
Many studies have shown that climate variability in-fluences marine systems ranging from benthic (Kron-cke et al. 1998, Warwick et al. 2002) to pelagic (Ohman & Hirche 2001) and from oceanic (Hare & Mantua 2000) to coastal (Attrill & Power 2002). The impact of climate on marine systems is not limited to a particular biological component but generally extends to all eco-system functional units (Drinkwater et al. 2003). Some studies have documented potential links from
phyto-plankton to zoophyto-plankton to higher trophic levels (Aebischer et al. 1990, Frank et al. 2005, Lehodey et al. 2006). Climate also impacts the biodiversity of marine systems and their spatial and temporal fluctuations, modulating the phenology of many organisms (i.e. their rhythm of reproduction, Edwards & Richardson 2004) as well as their response at both year-to-year and decadal scales (Cury et al. 2002).
Climate influences systems through a number of physical and chemical processes and pathways (Kirby et al. 2009). In coastal systems, in addition to the
well-© Inter-Research 2010 · www.int-res.com *Email: e.goberville@epoc.u-bordeaux1.fr
Climate-driven changes in coastal marine systems of
western Europe
Eric Goberville
1, 2,*, Grégory Beaugrand
1, 3, Benoit Sautour
2, Paul Tréguer
4,
SOMLIT Team
51Laboratoire d’Océanologie et de Géosciences, UMR CNRS 8187 (LOG), 28 avenue Foch, 62930 Wimereux, France 2Université Bordeaux I – Laboratoire d’Océanographie Biologique UMR CNRS 5805, Rue du Pr Jolyet, 33120 Arcachon, France
3Centre National de la Recherche Scientifique, Université des Sciences et Technologies de Lille, Lille 1, France 4Institut Universitaire Européen de la Mer, UMS CNRS 3113, Université Européenne de Bretagne, Technopole Brest-Iroise,
Place Nicolas Copernic, 29280 Plouzané, France
5Coordinators of the team in 2009: Pascal Claquin and Sébastien Lefebvre (Luc-sur-mer), Eva Bucciarelli and Jacques Guillou
(Brest), Pascal Morin (Roscoff), Laure Mousseau (Villefranche-sur-Mer), Patrick Raimbault (Marseille), Nicolas Savoye (Arcachon), Sami Souissi (Wimereux), Renaud Vuillemin and Stéphane Blain (Banyuls)
ABSTRACT: Coastal marine systems, the interface between the ocean and terrestrial realms, are among the most important systems on the planet both ecologically and economically because of their crucial role in earth system functioning. Although direct impacts of human activities on physical, chemical and biological components of these systems have been widely documented, the potential influence of climate variability is less well known. Here, we used data from Service d’Observation en Milieu Littoral (SOMLIT), a marine monitoring programme that has since 1997 collected samples at 12 sites located along the French coasts from 42° to 51° N. Applying standardised principal compo-nent analysis (PCA), we documented the year-to-year fluctuations in these coastal systems and eval-uated the potential influence of climate variability using data on atmospheric circulation (wind inten-sity and direction), precipitation and temperature. Our study revealed a pronounced sensitivity of these systems to climate variability. As the impact of climate change may become more prominent in the next decades, this study suggests that climate might strongly influence the marine coastal envi-ronment and act in synergism with other anthropogenic pressures to alter the state and functioning of biological and ecological systems and the services they provide.
KEY WORDS: Coastal systems · Climate change · SOMLIT · Anthropogenic impact · Multivariate analyses
documented direct effects of temperature on organ-isms (Beaugrand 2004), temperature has an impact on water stratification, which in turn modulates vertical nutrient and oxygen inputs (Sarmiento & Gruber 2006). For example, climate warming is likely to in-crease the frequency of hypoxia or anoxia events (Diaz 2001, Selman et al. 2008). Atmospheric circulation (sea level pressure and wind direction and intensity), by its action on oceanic currents, also contributes to the hor-izontal inputs of nutrients and di-oxygen in coastal sys-tems (Cloern 2001, Reid et al. 2003). Wind-induced and/or tidal-induced turbulent mixing are important as they control the onset of the spring phytoplankton bloom (Sverdrup 1953, Legendre & Demers 1984, Clo-ern 1996, Ragueneau et al. 1996, Gaedke et al. 1998) and the contact rates between prey and predators (Gaedke et al. 1998, Lewis & Pedley 2001, Lewis & Bala 2006). Coastal systems are also strongly influenced by the continent. Precipitation, by its effect on the volume of river discharge, is among the major mechanisms by which the strength of the interaction between the land and the ocean can be modulated (Harley et al. 2006).
The impact of humans on marine ecosystems occurs on a variety of temporal and spatial scales (Dobson et al. 1997). Biodiversity of marine systems is being al-tered by many human-induced factors including over-exploitation of marine resources (e.g. Omori et al. 1994, Jennings & Kaiser 1998), destruction of wetlands and habitat loss (Cloern 2001) and invasion of exotic species (Cariton & Geller 1993, Steneck 1998, Edwards et al. 2001). For decades, this has also included eutrophica-tion as a result of increasing nutrient inputs (e.g. Howarth 1988, North Sea Task Force 1993, Cloern 2001) and perturbation due to dispersion of chemical pollutants in estuarine and coastal waters (e.g. Norse 1993). Fisheries have affected the marine environment both directly and indirectly (Omori et al. 1994, Omori & Norman 1998, Jennings et al. 2001). Teasing out the re-spective influence of natural and anthropogenic forcing on ecosystems represents perhaps one of the biggest challenges of this century.
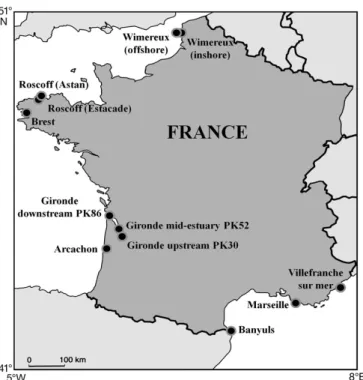
Marine coastal systems of western Europe have been monitored since 1997 by Service d’Observation en Milieu Littoral (SOMLIT). Since 1997 this monitoring programme has gathered a database of physical, chemical and biological parameters at 12 sites located along the coasts of France, from the Mediterranean Sea (42° 30’ N) to the English Channel (51° N) on a bimonthly basis (i.e. twice a month). The 12 studies sites have specific hydrographic features. The Atlantic, and especially the English Channel, coastal stations are under the direct influence of Atlantic ocean waters and are characterised by strong tidal forcing (e.g. the Ushant Front; Sournia et al. 1990); however, fresh-water inputs can impact their physical and chemical
characteristics locally, especially in the English Chan-nel (the River Seine) and in the Bay of Biscay (the Gironde estuary). In the Mediterranean Sea, stations experience weak tidal forcing. The water circulation patterns are typically driven by the Liguro-Provençal current and surface currents flowing in a roughly NE-SW direction, almost parallel to the shoreline (Font et al. 1988). The Rhône River strongly influences fresh-water inputs in the north-western part of the Mediter-ranean Sea.
The main objectives of our study were (1) to examine year-to-year changes in coastal systems monitored by SOMLIT and (2) to quantify the potential influence of climate variability on coastal systems. Both the re-gional climatic and coastal variability were first char-acterised and then related to large-scale hydro-climatic forcing. Our analyses suggest a clear influence of climate variability on coastal systems.
MATERIALS AND METHODS
Environmental database: SOMLIT. SOMLIT is a
French marine monitoring programme, created by a national institute, the Institut National des Sciences de l’Univers (INSU), which has coordinated activities of a number of marine stations along the French coasts since 1997 (Fig. 1). This programme currently com-prises 7 marine laboratories which monitor sampling sites in the English Channel, the Atlantic Ocean and
Fig. 1. Location of the Service d’Observation en Milieu Littoral (SOMLIT) sites used in our study
the Mediterranean Sea. At the beginning of the pro-gramme, the sampling sites were chosen because they reflected the diversity of systems along the French coasts (e.g. marine, estuarine and mixed systems). In practical terms, the choice of sampling sites was driven by (1) their local or regional environmental benefits, (2) the existence of historical biological or hydro-climatic monitoring and (3) the accessibility for regular sam-pling and for possible automation in the measurement of some parameters. Coastal systems studied under this programme have a variety of hydro-climatic char-acteristics ranging from the non-tidal Mediterranean Sea (e.g. Marseille) to the mega-tidal English Channel (Wimereux, see Fig. 1). Sampling has been carried out at least twice a month since 1997. A protocol has been established so that sampling is carried out at all sta-tions at sub-surface and at high tide (for the tidal seas). More details on the monitoring are available at http:// somlit.epoc.u-bordeaux1.fr/fr. All data gathered by this programme were considered in this study. It is important to note that because of dependency on meteorological conditions during sampling, the per-centage of available data is not always the optimum (Tables 1 & 2).
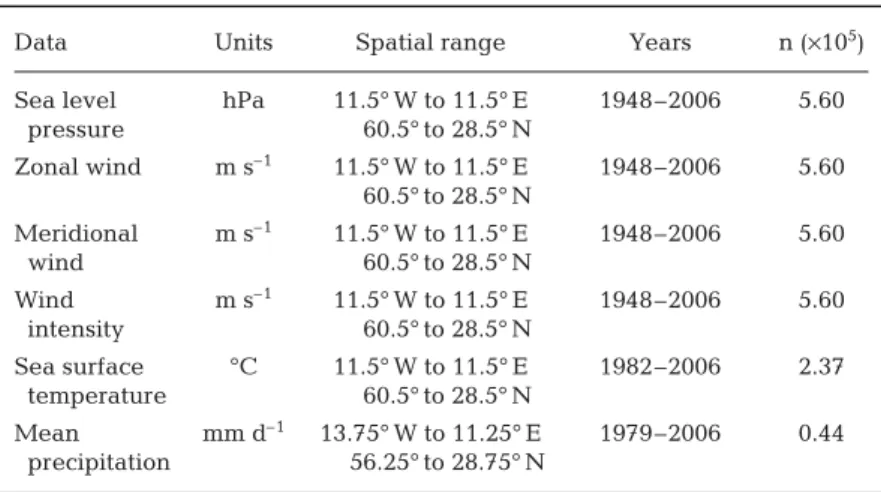
Climatological variables. In this paper, gridded data
on sea level pressure (SLP), wind intensity and its zonal (i.e. the west to east component of the wind) and meridional (i.e. the south to north component of the wind) components were used (Table 3). The wind intensity can be considered as a surface pressure gra-dient (Henderson-Sellers & Robinson 1986). Defined in this way, when combined, the information on both zonal and meridional wind enables the true average direction and strength of the wind to be calculated from the Pythagorean formula. These data were obtained from the National Centers for Environmental Prediction (NCEP, USA) and the National Center for Atmospheric Research (NCAR, USA). The
methodol-ogy of the NCEP-NCAR reanalysis data assimilation was discussed in detail by Kalnay et al. (1996) and Kistler et al. (2000), and more information on the numerical procedures was provided by Betts et al. (1996) and Kalnay et al. (1996).
Sea surface temperatures (SST) were used as they can have a large influence on coastal processes (Harley et al. 2006). The data set is based on methods that use high-frequency SST anomalies interpolated in such a way that interpolated temperatures fit spatial modes. The technique takes into account sea-ice con-centration to better assess SST at high latitudes and a modified historical bias correction for the period 1939 to 1941 as well as an improved error estimate. The optimum interpolation (OI) SST analysis is produced weekly on a 1° grid, so SST over land and island lakes is filled by interpolation. A full description of the OI analysis can be found in Reynolds & Smith (1994). In the present study, data were interpolated on a grid of 1° longitude × 1° latitude from December 1981 to December 2006 (Table 3).
Precipitation data were used, as this parameter impacts both the input of freshwater and nutrients from land to ocean. Data consisted of monthly values from January 1979 to December 2006, with a spatial resolution of 2.5° longitude × 2.5° latitude. More infor-mation on the data can been found at www.cru.uea. ac.uk/cru/data/ncep. All gridded climatological data were analysed between 1997 and 2006.
Large-scale hydro-climatic indices. Three
large-scale hydro-climatic indices were selected because of their potential importance in the studied area (Mar-shall et al. 2001, Beaugrand 2009).
The winter North Atlantic Oscillation index (NAO; Hurrell 1995a) is a basin-scale alternation of atmos-pheric masses between the subtropical and the Arctic Atlantic (Dickson & Turrell 2000). This oscillation has been correlated with a large range of physical and
bio-Site Latitude Longitude Period Depth Distance Bathymetry River close River flow (mm/yy) sampling to coast (m) to site (m3s–1)
(m) (km)
Wimereux offshore 50° 40’ 75” N 1° 24’ 60” E 11/97–12/06 1 9.26 53 Liane 3 Wimereux inshore 50° 40’ 75” N 1° 31’ 17” E 11/97–12/06 1 1.85 26 Liane 3 Roscoff Astan 48° 46’ 40” N 3° 56’ 15” W 02/00–12/06 1 3.5 60 Penzé 4 Roscoff Estacade 48° 43’ 56” N 3° 58’ 58” W 01/97–12/06 1 0.05 3 Penzé 4 Brest 48° 21’ 60” N 4° 33’ 38’ W 03/98–12/06 2 0.25 10 Aulne 30 Downstream estuary 45° 31’ 00” N 1° 57’ 00” W 03/97–12/06 1 2 8.2 Garonne 631 Mid-estuary 45° 14’ 80” N 0° 43’ 50” W 01/97–12/06 1 1 7 Garonne 631 Upstream estuary 45° 04’ 10” N 0° 38’ 30” W 01/97–12/06 1 0.5 8 Garonne 631 Arcachon 44° 40’ 00” N 1° 10’ 00” W 01/97–12/06 3 0.05 6 Eyre 18.8 Villefranche-sur-Mer 43° 41’ 00” N 7° 19’ 00” E 01/97–12/06 1 1.85 95 – 0 Marseille 43° 14’ 30” N 5° 17’ 30” E 01/97–12/06 1 6.48 60 Rhône 1700 Banyuls 42° 29’ 30” N 3° 8’ 70” E 03/97–12/06 3 0.92 27 Baillaury 4
logical indicators or phenomena, e.g. the paths of Atlantic storms and their intensity (Hurrell 1995b), pre-cipitation patterns (Hurrell 1995a), abundances of zoo-plankton species (Fromentin & Planque 1996, Beau-grand et al. 2000), or fluctuations in the productivity of some fish and invertebrate species (Alheit & Hagen 1997, Anderson 2000).
An index of Northern Hemisphere temperature (NHT) anomalies from 1958 to 2006 was used (Beau-grand 2009). Data were provided by the Hadley Centre for Climate Prediction and Research, Meteorological Office (Exeter, UK).
The Atlantic Multidecadal Oscillation (AMO) is a large-scale oceanic phenomenon, the source of natural variability in the range of 0.4°C in many oceanic regions (Enfield et al. 2001). We used the index con-structed from Extended Reconstruction SST (ERSST) data and averaged in the area of 25 to 60° N and 7 to 75° W, minus regression (i.e. detrending is intended to remove the North Atlantic SST anomaly data from the analysis) on global mean temperature (National Cli-mate Data Center, USA: NCDC). This index was downloaded from http://climexp.knmi.nl/. Previous studies have shown that this oceanic oscillation might have a large influence on SST changes (Enfield et al. 2001, Keenlyside et al. 2008).
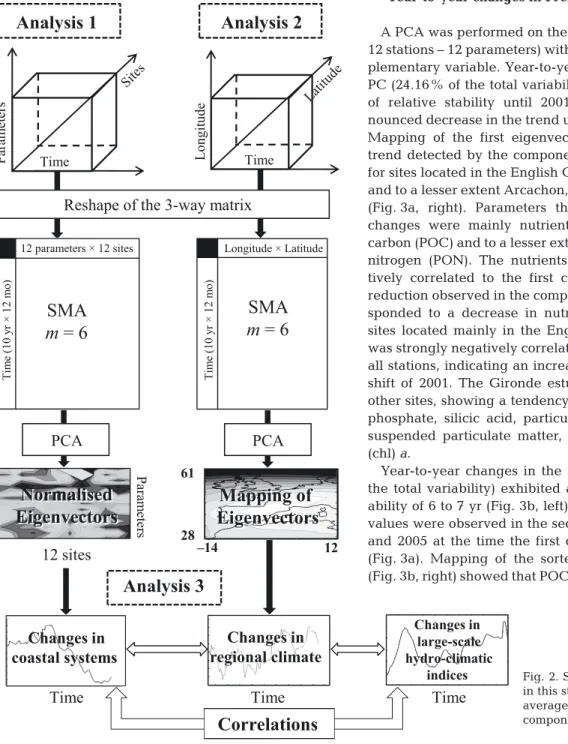
Analysis 1: long-term spatial and temporal changes in coastal systems. SOMLIT data gather information on
physical, biological and chemical properties of the wa-ter column structured in space and time. The original 3-way data matrix was therefore composed of 13 para-meters × 120 mo (period 1997 to 2006) × 12 stations.
Prior to the analysis, data were averaged per month, and a simple moving average of order 6 was used to remove the effect of seasonality (Legendre & Legendre 1998):
(1) where yiis the simple moving average at observation i, m is the number of months, 2m +1 is the time window with
m +1 ≤ i ≤ n–m, with n being the length of the time series.
Only a few statistical techniques exist to analyse such complex tables, e.g. co-inertia analysis (Dolédec & Chessel 1994) and 3-mode principal component analysis (PCA; Hohn 1993). The 3-mode PCA, used by Beaugrand et al. (2000), first calculates 3 classical PCAs on 2-dimensional tables after having trans-formed 1 table to ensure that the total inertia is identi-cal in each mode (Beaugrand et al. 2000). The analysis then relates the different modes by assessing a core matrix calculated from the eigenvectors of each mode (Beaugrand et al. 2000). In the present study, we only calculated 1 standardised PCA (i.e. subtracting the mean and dividing by the SD to give all parameters the same variation) on the deployed 3-way matrix 120 mo
y m x i i i m i m = + − +
∑
1 2 1 Site T emp. Salinity Oxygen pH Ammonium Nitrate Nitrite Phosphate Silicate Par ticulate Par ticulate Suspended Chl a (°C) (‰) (ml l –1) (µmol l –1) (µmol l –1) (µmol l –1) (µmol l –1) (µmol l –1) or ganic or ganic matter (µg l –1) nitr ogen carbon (µg l –1) (µg l –1 ) (µg l –1) W imer eux of fshor e 80.13 78.21 89.74 85.26 83.97 85.26 85.26 84.62 88.46 87.82 86.54 87.18 89.74 W imer eux inshor e 90.06 87.58 95.65 91.93 90.06 93.79 93.79 93.17 96.27 93.79 93.17 93.79 96.89 Roscof f Astan 96.79 97.33 97.33 86.63 96.79 98.40 98.40 98.40 98.40 73.80 73.80 85.56 97.86 Roscof f Estacade 97.19 97.99 97.59 90.76 98.39 97.99 97.99 97.99 91.57 55.02 55.02 83.53 97.19 Br est 99.79 98.73 98.31 58.05 97.88 98.73 96.61 98.52 98.73 89.83 90.04 58.26 98.73 Downstr eam estuar y 95.51 95.51 86.89 86.89 61.05 65.92 66.29 66.29 50.94 64.04 20.60 87.27 69.66 Mid-estuar y 98.63 98.63 93.84 91.44 59.93 66.78 67.47 67.12 53.08 66.44 18.15 91.10 71.92 Upstr eam estuar y 100 100.00 94.37 90.85 60.92 66.90 67.96 67.96 53.52 66.20 19.72 91.55 72.18 Ar cachon 99.73 98.92 85.71 86.52 61.99 85.18 81.67 83.29 68.19 83.83 22.37 94.61 95.42 V illefranche-sur -Mer 98.51 97.91 37.16 4.63 0.00 85.82 86.72 84.03 83.88 40.00 36.27 5.37 95.52 Marseille 99.15 93.62 94.47 0.00 94.04 97.02 97.02 96.60 96.60 82.98 82.98 77.87 96.60 Banyuls 79.58 79.58 67.11 44.61 83.55 87.90 58.79 63.71 66.16 26.47 23.82 42.72 87.90 T able 2. Percentages of data available in the SOMLIT database for the studied period and for each site. For location of sites s
× (12 parameters × 12 stations) (Fig. 2), which repre-sents the first stage performed in a 3-mode PCA. This PCA was performed on a correlation matrix. Although the number of variables is greater than the number of observations, our analysis remains valid because we only focused on a limited number of principal compo-nents (PCs; a total of 2 here) (Legendre & Legendre 1998). It should also be noted that temperature was not included directly in the analysis but as a supplemen-tary variable, so that it does not contribute to PCs. Eigenvectors were normalised as follows:
(2) where Unis the matrix of normalised eigenvectors, U is the matrix of eigenvectors and ΛΛ is the diagonal matrix of eigenvalues. Thus, the variables in the space of eigenvectors represented the linear correlation with the first and the second PCs (Legendre & Legendre 1998). We used this mathematical property to add tempera-ture as a supplementary variable, simply by calculating the linear correlation (Pearson correlation coefficient) between temperature and the first 2 PCs. Thus, temper-ature had no weight in the calculation of the PCs. The use of this statistical technique allowed in a single analysis the characterisation of temporal changes, the identification of parameters that contribute to the change and the recognition of locations mainly influ-enced by the temporal patterns. Prior to the mapping of each eigenvector (12 stations × 13 parameters), the or-der of each parameter was sorted by performing a PCA on the matrix of eigenvectors acquired after PCA on SOMLIT data. The PCA of eigenvectors identifies para-meters that are close to each other in a Euclidean dis-tance sense (Elmore & Richman 2001), thereby provid-ing a new similarity matrix choice.
To examine the influence of each envi-ronmental parameter on the first and sec-ond PC, we did a sensitivity analysis by re-performing the standardised PCA on a decreasing number of parameters from 12 to 1. It should be noted that even with 1 parameter, there were still 12 sites; therefore, the dimension of the matrix was 120 observations × 12 sites when only 1 parameter remained. The sensitiv-ity analysis was also performed by re-moving each site from 12 sites to only 1. In such a case, when only 1 site re-mained, the dimension of the matrix was 120 observations × 12 parameters. Two separate standardised PCAs were also conducted for Mediterranean (matrix 120 observations × 36 parameters and sites) and Atlantic sites (matrix 120 observa-tions × 108 parameters and sites).
Analysis 2: long-term spatial and temporal changes in some climatological variables. Long-term
climato-logical changes were investigated by standardised PCA (Joliffe 1986). The PCA was performed on a cor-relation matrix with the double objective of identifying major long-term changes in climatological variables (examination of PCs) and locating their geographical patterns (mapping of eigenvectors, Beaugrand 2009). A total of 6 PCAs was performed on the climatological data (Table 3). The analyses were applied in the spatial domain ranging from 14° W to 12° E and from 28° to 61° N (Table 3). For all climatological variables, except precipitation (Table 3), the spatial grid had a spatial resolution of 1° latitude × 1° longitude. As with SOM-LIT data, a simple moving average of order 6 was used to remove the effect of seasonality.
Analysis 3: correlation analysis. Correlation
analy-ses were performed between the first PCs obtained from Analysis 1 (year-to-year changes in the coastal en-vironment) and the first PCs from the PCAs performed on (regional) climatological variables (Analysis 2), and all PCs were correlated to large-scale hydro-climatic indices (see Figs. 2 & 8, see Tables 4 & 5). Probabilities were corrected to account for temporal autocorrelation. A Box-Jenkins (Box & Jenkins 1976) autocorrelation function modified by Chatfield (1996) was used to as-sess the temporal dependence of years. The Chelton formula (Chelton 1984) was applied to adjust the de-grees of freedom. This procedure was recommended by Pyper & Peterman (1998).
When ordinary correlations between year-to-year changes in the coastal systems and hydro-climatic variability were greater than 0.5, cross-correlation analyses were performed to examine whether these relationships were direct or occurred with a certain
Un==UΛΛ1 2/
Data Units Spatial range Years n (×105)
Sea level hPa 11.5° W to 11.5° E 1948–2006 5.60 pressure 60.5° to 28.5° N Zonal wind m s–1 11.5° W to 11.5° E 1948–2006 5.60 60.5° to 28.5° N Meridional m s–1 11.5° W to 11.5° E 1948–2006 5.60 wind 60.5° to 28.5° N Wind m s–1 11.5° W to 11.5° E 1948–2006 5.60 intensity 60.5° to 28.5° N Sea surface °C 11.5° W to 11.5° E 1982–2006 2.37 temperature 60.5° to 28.5° N Mean mm d–1 13.75° W to 11.25° E 1979–2006 0.44 precipitation 56.25° to 28.75° N
Table 3. Origin and characteristics of climatic data used in this study. Source: National Centers for Environmental Protection/National Center for Atmospheric Research (NCEP/NCAR). n: number of data. For all climatological variables the spatial resolution of the grid was 1°, with the exception of precipitation for which
lag. These analyses were performed by lagging months from 1 to 60 (5 yr). To assess the probability of the cross-correlogram, we adjusted the degrees of freedom for each lag and also for temporal autocorrela-tion. As a result of this procedure, an identical value of correlation for 2 successive lags can have different val-ues of probability, independently of the degrees of freedom lost by the lag itself.
Multiple testing increases the probability of a type I error (i.e. finding too many significant correlations). To correct for this potential bias, the Hochberg (1988)
method was applied with α = 0.05 for correlations with climatological variables and for correlations with large-scale hydro-climatic indices. This nonparametric correction is considered more robust and less conserv-ative than the Bonferroni technique (Legendre & Le-gendre 1998).
All methods used in the present study were pro-grammed using MATLAB language.
RESULTS
Year-to-year changes in French coastal systems
A PCA was performed on the 2-way table (120 mo × 12 stations – 12 parameters) with temperature as a sup-plementary variable. Year-to-year changes in the first PC (24.16% of the total variability) exhibited a period of relative stability until 2001, followed by a pro-nounced decrease in the trend until 2005 (Fig. 3a, left). Mapping of the first eigenvector indicated that the trend detected by the component is especially strong for sites located in the English Channel, the Celtic Sea and to a lesser extent Arcachon, Banyuls and Marseille (Fig. 3a, right). Parameters that contributed to the changes were mainly nutrients, particulate organic carbon (POC) and to a lesser extent particulate organic nitrogen (PON). The nutrients and POC were posi-tively correlated to the first component so that the reduction observed in the component after 2001 corre-sponded to a decrease in nutrient concentration for sites located mainly in the English Channel. Salinity was strongly negatively correlated with the first PC for all stations, indicating an increase in salinity after the shift of 2001. The Gironde estuary differed from the other sites, showing a tendency toward an increase in phosphate, silicic acid, particulate matter (PON and suspended particulate matter, SPM) and chlorophyll (chl) a.
Year-to-year changes in the second PC (14.13% of the total variability) exhibited a pseudo-cyclical vari-ability of 6 to 7 yr (Fig. 3b, left). Pronounced negative values were observed in the second PC between 2001 and 2005 at the time the first component diminished (Fig. 3a). Mapping of the sorted second eigenvector (Fig. 3b, right) showed that POC, PON, SPM, pH and to 12 parameters × 12 sites Ti m e (10 y r × 12 m o)
SMA
m = 6
Longitude × Latitude Ti m e (10 y r × 12 m o)SMA
m = 6
PCA
PCA
12 sites
Param etersNormalised
Eigenvectors
Mapping of
Eigenvectors
Normalised
Eigenvectors
Mapping of
Eigenvectors
28 61 –14 12Analysis 1
Analysis 2
Analysis 3
Longit u de Latitude Sites Time Time Param etersReshape of the 3-way matrix
Time
Changes in
coastal systems
Time
Changes in
regional climate
Time
Changes in large-scale hydro-climatic indicesCorrelations
Fig. 2. Statistical analyses applied in this study. SMA: simple moving average of order 6; PCA: principal component analysis; m: no. of
a lesser extent chl a were negatively related to the sec-ond PC in stations located in Arcachon and north-wards, indicating an increase in the values of these parameters between 2001 and 2005. There was a dis-tinct difference between the western coasts and the Mediterranean Sea. Dissolved di-oxygen was strongly positively correlated with the second component for all the stations, indicating a low-amplitude tendency to-ward a decrease in di-oxygen concentration every-where during the period 2001 to 2005.
Environmental temperature was added in the analy-sis as a supplementary variable because we then cal-culated correlations between changes in both regional temperature and the first PC. If environmental temper-ature was included directly in the PCA, the 2 variables (PC1 SOMLIT and regional SST) would not be entirely
independent (an important assumption in correlation analysis, see Sokal & Rohlf 1995). Thereby, the vari-able was removed from the analysis. However, as the eigenvectors show (Fig. 3), the environmental temper-ature is highly correlated to the first component and therefore the removal of this variable did not affect the first PC.
Results from the sensitivity analysis showed that our conclusions were not greatly affected by remov-ing an increasremov-ing number of parameters or sites (Fig. 4). Indeed, the correlation of the first compo-nent decreased from 0.994 (p < 0.05) when based on 11 parameters to 0.458 (p < 0.05) when based on only 1 parameter. Despite the decrease observed in the percentage of variance explained by the analysis, the significant positive correlation suggested that Fig. 3. Principal component analysis (PCA) of the year-to-year changes in the coastal systems of western Europe in (a) the first and (b) the second principal component (PC) location-parameter (left) and mapping of the first eigenvector (right). Temperature was added in the analysis as a supplementary variable. Sites were ordered from north to south and estuarine sites positioned along the abscissa. Ofs-Wim: Wimereux (offshore); Ins-Wim: Wimereux (inshore); Astan: Roscoff Astan; Estaca: Roscoff Estacade; Brest; Arca: Arcachon; Vil/Mer: Villefranche-sur-Mer; Mars: Marseille; Banyuls; Dst-Est: Gironde PK86 (downstream); Mid-Est: Gironde PK52 (middle); Ups-Est: Gironde PK30 (upstream); Sal: salinity; Ox: oxygen; NH4: ammonium; NO3: nitrate; NO2: nitrite; PO4:
phos-phate; SiOH4: silicate; POC: particulate organic carbon; PON: particulate organic nitrogen; SPM: suspended particulate matter;
results were still positively correlated based on only 1 variable. For the second PC, this correlation decreased from 0.996 to 0.637. Our conclusion was also not affected by the removal of sites. The correla-tion of the first component decreased from 0.998 when based on 11 sites to 0.657 when based on only 1 site; the correlation of the second PC decreased from 0.996 to 0.389.
The 2 separate standardised PCAs confirmed the average correlation between the year-to-year changes in Atlantic and Mediterranean sites observed in Fig. 3 (mapping of eigenvectors). The correlation between the 2 first PCs (Atlantic: 28.47% of the total variance; Mediterranean Sea: 33.10% of the total variance) were high (r = 0.69) although at the limit of significance (p = 0.12) when the temporal autocorrelation was taken into account (Fig. 5a). The correlation was low (r = 0.08) and not significant (p = 0.78) when the 2 second PCs (Atlantic: 16.82% of the total variance; Mediter-ranean Sea: 17.20% of the total variance) were exam-ined (Fig. 5b).
Year-to-year changes in regional climate
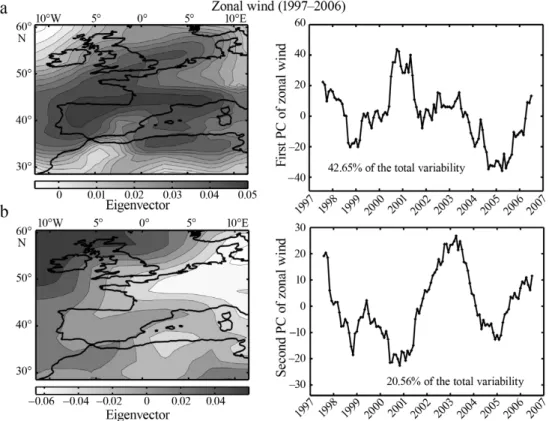
Six PCAs were performed on the 2-way table (time × space) of each climatological variable to characterise the spatial and temporal changes in regional climate during the period of sampling by SOMLIT. We only describe 4 analyses in detail (zonal and meridional wind, temperature and precipitation), as results ob-tained on SLP and wind intensity can be deduced from the analyses performed on directional wind.
Changes in atmospheric circulation may strongly affect coastal systems. The examination of the first component (42.65% of the total variability) of the PCA performed on zonal winds showed, for all regions cov-ering the French coast, a stepwise increase in zonal wind in 2001 and the occurrence of 2 minima around 1999 and 2005 (Fig. 6a). Between 2001 and 2005, an irregular reduction in zonal wind was observed. As the eigenvectors were positive, an increase in the value of the PC should be interpreted as an increase in zonal wind and vice versa. The second component (20.56% Fig. 4. Sensitivity analysis on the first 2 principal components (PCs) calculated from a standardised principal component analysis (PCA) performed on a decreasing number of parameters and sites. The thick black line represents the PCs when no parameter or site was removed. (a) First and (b) second PC of the PCA performed on the table: time × (observations – variables) based on a decreasing number of variables from 12 to 1. (c) First and (d) second PC of the PCA performed on the table: time × (observations – variables) based on a decreasing number of sites from 12 to 1. ‘0’ indicates that no variable or site was removed;
of the total variability) showed a pseudo-cyclical vari-ability of about 4 yr (Fig. 6b). For regions mainly located in the eastern part of the English Channel and Villefranche-sur-Mer where eigenvectors are nega-tive, the component indicated higher zonal winds be-tween 1998 and 2001 and lower winds bebe-tween 2001 and 2005. Locations of high values in the first and sec-ond eigenvectors are obviously related to the bound-ary between regions of lower and higher SLP (see
Fig. S1 in the supplement at www.int-res.com/articles/
suppl/m408p129_supp.pdf).
The examination of the first eigenvectors (45.35% of the total variability) of the PCA performed on merid-ional winds showed a clear bi-polar pattern (Fig. 7a). Values of the eigenvectors were strongly positive around Spain and negative north of France. Therefore, the first component was not considered to explain year-to-year changes in the French coastal systems. Fig. 5. Comparison of (a) the first and (b) second principal components (PCs) from a standardised principal component analysis (PCA) performed on Atlantic (black) and Mediterranean sites (gray), showing changes in the coastal systems of western Europe. Probabilities were corrected to account for temporal autocorrelation using the method recommended by Pyper & Peterman (1998)
Fig. 6. Principal component analysis (PCA) on the year-to-year changes in zonal wind (1997–2006). Mapping of (a) the first eigenvector (left) and year-to-year changes in the first principal component (PC; right; 42.65% of the total variability) and (b) the
The second eigenvectors (31.62% of the total variabil-ity) had great negative values centred around France (Fig. 7b, left). The second component therefore re-vealed a continued decrease in meridional winds with a superimposed pseudo-cyclical variability. Minima in meridional winds were observed during 1998, 2003 and 2006, and a maximum in 1999. The information gained from both zonal and meridional winds was in general also found in the examination of the PCA performed on wind intensity (see Fig. S2 in the supple-ment at www.int-res.com/articles/suppl/m408p129_
supp.pdf).
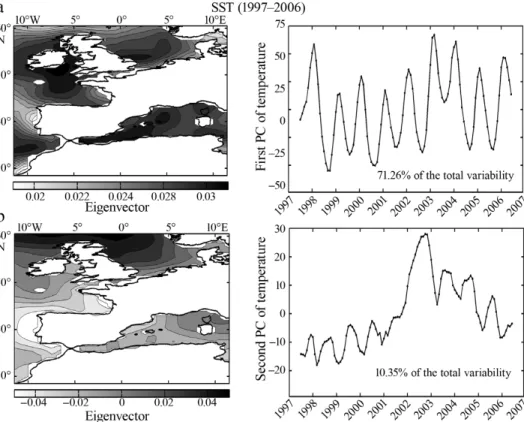
Change in atmospheric circulation influences SST. The examination of year-to-year changes in the PC (71.26% of the total variability) showed high values in 1998 and 2003–2004, and minima in 1999 and 2005– 2006 (Fig. 8a). As the first eigenvector was positive, a positive value of the component indicated warmer SST (and vice versa). The component exhibited a cyclical variability, close but slightly greater than an annual cycle and despite the use of the order-6 simple moving average. The second PC (10.35% of the total variance) detected an anomaly in SST in 2002 (Fig. 8b).
Atmospheric circulation changes also influence pre-cipitation patterns that affect coastal systems through river run-off. Year-to-year changes in the first PC
(36.99% of the total variability) showed an abrupt increase in the value of the component that started at the end of 1998 and ended in 2002 (Fig. 9a). This phe-nomenon was particularly pronounced in the Mediter-ranean Sea but also reflected changes occurring over the western coasts of France (see high values in the first eigenvector, Fig. 9a). The second PC (19.92% of the total variance) exhibited a pseudo-cyclical variabil-ity of about 3 yr with opposite consequences in south-ern and northsouth-ern regions.
Relationships between year-to-year changes in coastal systems, regional climate and large-scale
hydro-climatic indices
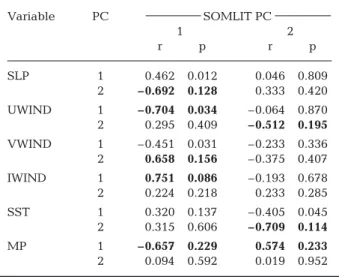
Linear correlations between the first 2 PCs that orig-inated from the 6 PCAs and the first 2 components from the PCA performed to investigate year-to-year changes in coastal systems were calculated to test whether such changes were related to changes in regional climate (Table 4).
Results from correlation analyses suggested a con-comitant change in coastal systems (as inferred from the first component of the PCA performed on environ-mental parameters) and atmospheric circulation, tem-Fig. 7. Principal component analysis (PCA) on the year-to-year changes in meridional wind (1997–2006). Mapping of (a) the first eigenvector (left) and year-to-year changes in the first principal component (PC; right; 45.35% of the total variability) and (b) the
Fig. 8. Principal component analysis (PCA) on the year-to-year changes in sea surface temperature (SST; 1997–2006). Mapping of (a) the first eigenvector (left) and year-to-year changes in the first principal component (PC, right; 71.26% of the total variability)
and (b) the second eigenvector (left) and year-to-year changes in the second PC (right; 10.35% of the total variability)
Fig. 9. Principal component analysis (PCA) on the year-to-year changes in mean precipitation (1997–2006). Mapping of (a) the first eigenvector (left) and year-to-year changes in the first principal component (PC; right; 36.99% of the total variability) and
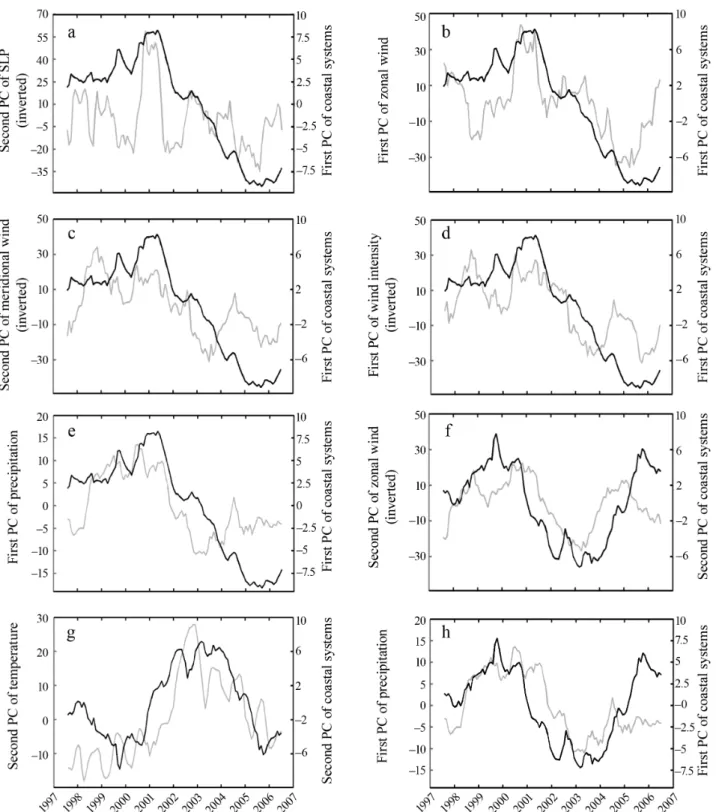
perature and precipitation (Table 4). The link between the changes in the coastal systems and climate was patent. However, a graphical examination of the corre-lation showed that the link with climate occurred when the forcing was markedly low or high (Fig. 8). For example, high values observed in 2001 of the first com-ponent from the PCA performed on the coastal envi-ronment coincided with high values of zonal wind and vice versa (Fig. 10b), lower temperatures (not shown) and higher precipitation (Fig. 10e). Taking into consid-eration interpretations of the PCAs (see Figs. 5–9), this analysis indicated that the changes observed in nutri-ents, di-oxygen, chl a and particulate matter in the Atlantic ocean and the English Channel were posi-tively related to wind intensity, direction and precipita-tion and negatively related to temperature. The link between environmental and climate change seemed more difficult to detect after 2005.
The second PC originating from the PCA performed on environmental parameters (SOMLIT) was in general less related to climatological parameters (Table 4). A weak but significant link was detected with zonal wind (Fig. 10f) and precipitation (Fig. 10h). However, analysis of the graphs showed that the link was detected for sub-stantial changes in climatological variables and seemed less obvious at the end of the time series.
Examination of potential lags was carried out by cross-correlation analysis for pairs of variables that
showed correlations > 0.5 (see Table 4). Examination of all cross-correlograms (Fig. 11) suggests that no lag existed between the year-to-year variability in coastal systems and hydroclimate. The slight increase in the value of the correlation was too small (maximum range of correlation between r = 0.704 and r = 0.752 for the cross-correlogram between PC1 SOMLIT data and PC1 zonal wind, Fig. 11b) to be related to a signif-icant lag. This was probably more influenced by the decrease in the degrees of freedom. However, the present analysis is influenced by the application of the order-6 simple moving average.
Correlations between coastal environmental and regional climatological changes (annual mean) and large-scale hydro-climatic indices (NHT, AMO and NAO) were calculated between 1997 and 2006 (Table 5). Only NHT anomalies were correlated with changes in the coastal environment. High correlations were found between regional climate and this index, but only SLP was correlated significantly with NHT anomalies after adjusting the probability of consider-ing multiple tests of correlation. Correlations between the state of the NAO and regional climate and changes in the coastal environment were low and insignificant, suggesting a weak impact of the NAO in our region (Table 5). High correlations were found between the AMO and the first PC that originated from the analysis on SOMLIT data. However, after correction to account for multiple testing, the probability of the correlation (i.e. the p value) exceeded 0.05 (Table 5).
DISCUSSION
Results suggest that coastal systems of western Eu-rope located in the 42 to 51° N latitude range were af-fected by climate variability during the period 1997 to 2006. Strong correlations were found between regional climate and changes observed in the coastal environ-ment, suggesting a substantial impact of climate on the coastal systems of western Europe. Both regional hy-dro-climatic and coastal changes were influenced by NHT, a large-scale climatological index. However, our study only covers a short time period. According to Southward (1995), long periods of monitoring are re-quired to unambiguously separate the main drivers of changes that can affect a marine system (Hawkins et al. 2003). For example, Fromentin & Planque (1996) de-tected a strong negative correlation between the state of the NAO and the abundance of Calanus
finmarchi-cus in the North Sea for the period 1962 to 1992. As the
relationship was highly significant, they attempted to forecast the abundance of the species for a given value of the NAO. However, the correlation broke down after 1996 (Planque & Reid 1998). This example suggests Variable PC SOMLIT PC 1 2 r p r p SLP 1 0.462 0.012 0.046 0.809 2 –0.692 0.128 0.333 0.420 UWIND 1 –0.704 0.034 –0.064 0.870 2 0.295 0.409 –0.512 0.195 VWIND 1 –0.451 0.031 –0.233 0.336 2 0.658 0.156 –0.375 0.407 IWIND 1 0.751 0.086 –0.193 0.678 2 0.224 0.218 0.233 0.285 SST 1 0.320 0.137 –0.405 0.045 2 0.315 0.606 –0.709 0.114 MP 1 –0.657 0.229 0.574 0.233 2 0.094 0.592 0.019 0.952 Table 4. Correlations between the first 2 principal components (PCs) of the principal component analysis (PCA) performed on Service d’Observation en Milieu Littoral (SOMLIT) data and the first 2 PCs of the PCA performed on each climatological variable (SLP: sea level pressure; UWIND: zonal wind; VWIND: meridional wind; IWIND: wind intensity; SST: sea surface temperature; MP: mean precipitation), with probabil-ity corrected to account for temporal autocorrelation with the method recommended by Pyper & Peterman (1998); df = 106. p values were also adjusted with Hochberg’s procedure (1988) and α = 0.05. Significant correlations (r > 0.5) are in bold
Fig. 10. Year-to-year changes in the coastal systems of western Europe in relation to hydro-climatic forcing. Year-to-year changes in the coastal systems of western Europe (first principal component [PC1] of the principal component analysis [PCA] performed on SOMLIT data; in black) and (a) sea level pressure (SLP; PC2 of the PCA performed on SLP; in gray), (b) zonal wind (PC1 of the PCA performed on zonal wind; in gray), (c) meridional wind (PC2 of the PCA performed on meridional wind; in gray), (d) wind intensity (PC1 of the PCA performed on wind intensity; in gray), (e) precipitation (PC1 of the PCA performed on precipitation; in gray). Year-to-year changes in the coastal systems of western Europe (PC2 of the PCA performed on SOMLIT data; in black) and (f) zonal wind (PC2 of the PCA performed on zonal wind; in gray), (g) sea surface temperature (SST; PC2 of the PCA performed on SST; in gray), (h) precipitation (PC1 of the PCA performed on precipitation; in gray). See Table 4 for the values of correlations. Probabilities were corrected to account for temporal autocorrelation using the method recommended by Pyper & Peterman (1998), p values were
Fig. 11. Cross-correlograms between year-to-year changes in the coastal systems and hydro-climatic variability (only pairs of variables characterised by ordinary correlations > 0.5; see Table 4). (a) First principal component (PC1) SOMLIT data and PC2 sea level pressure (SLP), (b) PC1 SOMLIT data and PC1 zonal wind, (c) PC1 SOMLIT data and PC2 meridional wind, (d) PC1 SOMLIT data and PC1 wind intensity, (e) PC1 SOMLIT data and PC1 precipitation, (f) PC2 SOMLIT data and PC2 zonal wind, (g) PC2 SOMLIT data and PC2 sea surface temperature, (h) PC2 SOMLIT data and PC1 precipitation. White bars are not signif-icant; black bars are significant: the significance threshold was set at p = 0.25 after accounting for the reduction in the degrees
that the relationships between a large-scale climatic phenomenon and some coastal systems may not be constant through time. Such a result also reveals the nonlinearity of the system.
When analysing the effects of climate on marine sys-tems, it is often relevant to separate natural changes from those caused by the confounding influence of human activity (Harley et al. 2006). Long-term moni-toring is also preferable to establish a baseline against which perturbations can be better identified. However, most environmental coastal time series are short (e. g. Lindahl et al. 1998, Marty et al. 2002, Fernandez de Puelles et al. 2004). The SOMLIT programme, imple-mented in 1997, also suffers from lack of background. However, the spatial extent of the programme and the number of parameters measured are unique, compen-sating in part the short temporal coverage. The large spatial extent of the programme reduces the noise inherent to a sampling site (e. g. local disturbance and forcing), the influence of local hydro-dynamical forc-ing (e. g. tide, turbulence, frontal structures) and there-by increases the signal to noise ratio that enables the effect of climate to be better detected (Taylor et al. 2002, Beaugrand & Ibañez 2004).
In the regions where changes in nutrients, dissolved di-oxygen and salinity were observed, the positive cor-relations between chl a and the first PC from the analy-sis performed on SOMLIT data (Fig. 3) also revealed a decrease after 2001. These changes, led by regional climate forcing, are likely to have affected biological
systems. Lotze & Worm (2002) and Nielsen (2003) have suggested that variations in nutrients may have sub-sequent effects on primary production, which can eventually cascade or be amplified through trophodynamics (Frank et al. 2005, Kirby et al. 2009). Many biological changes such as a modification in the grazing rates of zoo-plankton, a shift in species composition and phenological or biogeographical shifts (Richardson & Schoeman 2004, Winder & Schindler 2004) have been attributed to rising water temperature or changes in physico-chemical charac-teristics of the water column, at least in temperate coastal systems (Harley et al. 2006, Kirby et al. 2009).
SST appears to be a master parame-ter governing the changes in the coastal environment (Scavia et al. 2002, Beaugrand 2009). The increase in SST observed after 2001 and particularly pronounced in 2003 (during the sum-mer heat wave of 2003, Fig. 8) might have exacerbated the decrease in nutrients observed mainly along the western coast of France. This phe-nomenon, combined with the reduction in zonal wind and precipitation, which is likely to have reduced hor-izontal inputs, could have contributed to the diminu-tion of nutrients observed in these coastal regions. The effect of SST in the water column would be to increase the vertical stratification in the coastal non-tidal regions monitored by the SOMLIT programme and in offshore areas (Diaz & Rosenberg 1995, Bopp et al. 2002), but this phenomenon is not likely to occur in tidal regions because of the mixing by currents. Another impact of temperature is through the amount of di-oxygen that water can hold (i.e. warmer water holds less di-oxygen than cooler water; e.g. Beaugrand et al. 2008). Furthermore, warming increases bacterial production and the metabolism of organisms, aug-menting di-oxygen consumption (Najjar et al. 2000). Our study has revealed a small reduction in the con-centration of dissolved di-oxygen. This event, observed between 2001 and 2005, is currently too weak to lead to hypoxia or anoxia events, but reveals a possible tendency for the future as suggested by some authors such as Chan et al. (2008). The projected increase in temperature (IPCC 2007) may also place further stress on coastal systems already affected by eutrophication, pollution and harmful algal blooms and exacerbate phenomena of anoxia or hypoxia (Diaz & Rosenberg 1995, Justic et al. 1997, Najjar et al. 2000, Peperzak 2003, Selman et al. 2008).
Variable PC North Atlantic Northern Atlantic Multidecadal Hemisphere
Oscillation Oscillation temperature
r p r p r p SLP 1 0.276 0.440 –0.566 0.088 –0.783 0.007 2 –0.279 0.434 –0.294 0.410 –0.055 0.880 UWIND 1 0.063 0.928 –0.716 0.020 –0.641 0.046 2 –0.215 0.551 0.115 0.752 0.462 0.179 VWIND 1 –0.152 0.676 0.308 0.386 0.630 0.051 2 –0.064 0.860 –0.610 0.061 –0.380 0.279 IWIND 1 –0.100 0.783 0.460 0.181 0.635 0.048 2 –0.018 0.961 0.253 0.481 0.432 0.212 SST 1 –0.135 0.710 0.338 0.340 0.419 0.228 2 0.269 0.453 –0.064 0.860 0.494 0.146 MP 1 0.349 0.323 –0.356 0.313 –0.693 0.026 2 0.425 0.221 –0.519 0.124 –0.231 0.521 SOMLIT 1 –0.344 0.330 0.708 0.022 0.871 0.001 2 –0.275 0.442 0.063 0.862 –0.150 0.679 Table 5. Correlations (df = 8) between the first 2 principal components (PCs) of the principal component analysis (PCA) performed on climatic and SOMLIT data and large-scale hydro-climatic variables (abbreviations as in Table 4). As the time series were too short, correlations were not corrected to account for temporal autocorrelation. However, the p values were adjusted with Hochberg’s procedure (1988) and α = 0.05. Significant correlations (r > 0.5) are in bold
While many studies to date have focused exclusively on the impact of temperature as an indicator of climate change (e.g. Edwards & Richardson 2004), our results suggest that atmospheric circulation is also an impor-tant parameter, as shown by the strong correlations between both zonal circulation and wind intensity and the state of coastal systems (see Fig. 10 and Table 4). After a period of relative stability, the decreases in nutrients, PON, POC and chl a in regions located in western France and the reduction in dissolved di-oxy-gen at all sites (Fig. 3) observed during the period 2001 to 2005 coincided with the decrease observed in the intensity of zonal wind during the same period. Changes in atmospheric circulation influence the At-lantic storm track (e.g. Dickson & Turrell 2000) and affect precipitation patterns (Rogers 1997). Precipita-tion was also highly related to changes in the state of the coastal systems (Fig. 10, Table 4), a result also found by Harley et al. (2006) for other coastal systems. The reduction in nutrients observed during 2001 to 2005 may have been reinforced by the decrease in pre-cipitation and its influence on drainage and river runoff. In a study of 137 representative rivers around the world, Milliman et al. (2008) suggested that river discharge generally reflected precipitation patterns, themselves a climatic response to oceanic/atmospheric drivers such as El Niño and Southern Oscillation (ENSO) or NAO and AMO (New et al. 2001). Direct human impact (damming, irrigation and interbasin water transfers) could be superimposed to the river flow pattern (Ludwig et al. 2009) and thereby also influence these concentrations in nutrients and partic-ulate matters (e.g. damming in the Ebro River in Spain, Ibàñez et al. 1996). Contrary to Livingston et al. (1997), who showed a reduced nutrient input after drought periods in an estuary located in the Gulf of Mexico, our results (Fig. 3) revealed a particularity of the Gironde that presents a conservative behaviour, except in downstream areas (Irigoien & Castel 1997). This con-servative behaviour suggests the absence of intense biogeochemical processes in this estuary (Cabeçadas et al. 1999).
Changes in ocean circulation can affect the regional circulation of shelf and coastal seas (Scavia et al. 2002, Harley et al. 2006). Although reduced wind might also alter physical mixing, the examination of bottom and surface samples for some sites monitored by SOMLIT shows that there are generally no vertical differences and that the system is more likely influenced by hori-zontal inputs from offshore. In the North Sea, the atmospheric circulation influences the hydrodynamics that modulate the nature of sea water entering from the North Atlantic and the English Channel (Reid et al. 2003). Jickells (1998) stressed that the oceanic inflow had a strong impact on the concentration of nutrients
in this sea and that a percentage of 82.68% of nitrogen input originated from this phenomenon. In contrast to the sites of the Atlantic and adjacent seas considered in this study, Mediterranean waters export a great amount of nutrients to the Atlantic Ocean because of its negative water balance and the resulting water cir-culation (Hopkins 1985).
Substantial correlations were generally observed be-tween the state of the coastal environment and large-scale climatological indices (Table 5), although not all correlations were significant after correction for tem-poral autocorrelation and for multiple testing. Beau-grand & Reid (2003) showed that NHT anomalies and SST covaried positively for many months in the eastern part of the North Atlantic, around the British Isles and the North Sea, the influence of which was stronger than that of the NAO. No influence of the NAO on the state of coastal systems was detected, probably because this oscillation only has a modest influence on the regional climatological parameters of the region (Marshall et al. 2001).
The effect of climate depended upon the intensity of the climate anomalies. The scale, the rhythm and the intensity of physical forcing indeed influence biologi-cal production (e.g. the theory of ergoclines, Legendre & Demers 1984). Our results showed that both substan-tial negative or positive forcing were related to changes in the state of the coastal systems, while mod-erate forcing had no effect (Fig. 10). Such threshold effects are beginning to be widely documented for sys-tems ranging from physical (Rahmstorf 1995, Paillard 2001) to biological and ecological systems (Scheffer et al. 2001, Carpenter & Brock 2006) and reflect a pro-nounced non-linearity (e.g. the strength of the correla-tion may vary locally and temporally) and thereby sen-sitivity of the response of most natural systems to climate change.
Coastal regions, located at the interface between oceanic and terrestrial systems, play a crucial role in earth system functioning (Le Tissier et al. 2006). It is as-sumed that currently more than 60% of the world’s pop-ulation live less than 60 km from the sea, increasing the human pressure on these systems at the same time as we are experiencing a period of rapid climate change (IPCC 2007). The spatial and temporal heterogeneity of coastal systems is considerable (Vafeidis et al. 2004), leading to methodological problems in developing global perspec-tives on the role and scale of the coastal domain in earth system functioning (Kremer et al. 2004, Harley et al. 2006). The acquisition of data by coordinated sampling programmes enables a robust comparison of the hetero-geneity between sites to be made and relationships be-tween contrasting coastal systems of western Europe and climate variability to be outlined. Although it is well known that coastal systems are locally strongly impacted
by human activities, it remains difficult to disentangle climatic from anthropogenic forcing (Behrenfeld et al. 2006, Le Tissier et al. 2006).
In summary, our results suggest that (1) regional cli-mate through its influence on local atmospheric and ocean circulation and temperature substantially influ-ences coastal systems of Europe in the 42 to 51° N lati-tudinal range, and that (2) regional climate variability is correlated to an index of global temperature change (NHT anomalies). Our analysis shows that changes observed in nutrients are also detected in chl a and indicate that the climatic signal may propagate through the trophodynamics. Monitoring such as SOMLIT should be pursued and perhaps extended, as it represents the only way forward to robustly detect potential alterations of coastal systems in the future.
Acknowledgements. We thank the National Institute for the
Sci-ences of the Universe and the entire SOMLIT team — techni-cians, researchers, captains and crews — who have contributed to the collection of the SOMLIT samples since 1997. Thanks also to I. Rombouts for reading the manuscript. The database is available at: http://somlit.epoc.u-bordeaux1.fr/fr. This project was funded by a French grant BDI-CNRS.
LITERATURE CITED
Aebischer NJ, Coulson JC, Colebrook JM (1990) Parallel long-term trends across four marine trophic levels and weather. Nature 347:753–755
Alheit J, Hagen E (1997) Long-term forcing of European her-ring and sardine populations. Fish Oceanogr 6:130–139 Anderson NJ (2000) Miniview: diatoms, temperature and
cli-matic change. Eur J Phycol 35:307–314
Attrill MJ, Power M (2002) Climatic influence on a marine fish assemblage. Nature 417:275–278
Beaugrand G (2004) Monitoring marine plankton ecosystems. I: Description of an ecosystem approach based on plank-ton indicators. Mar Ecol Prog Ser 269:69–81
Beaugrand G (2009) Decadal changes in climate and eco-systems in the North Atlantic Ocean and adjacent seas. Deep-Sea Res II 56:656–673
Beaugrand G, Ibañez F (2004) Monitoring marine plankton ecosystems. II: Long-term changes in North Sea calanoid copepods in relation to hydro-climatic variability. Mar Ecol Prog Ser 284:35–47
Beaugrand G, Reid PC (2003) Long-term changes in phyto-plankton, zooplankton and salmon related to climate. Glob Change Biol 9:801–817
Beaugrand G, Ibañez F, Reid PC (2000) Spatial, seasonal and long-term fluctuations of plankton in relation to hydrocli-matic features in the English Channel, Celtic Sea and Bay of Biscay. Mar Ecol Prog Ser 200:93–102
Beaugrand G, Edwards M, Brander K, Luczak C, Ibanez F (2008) Causes and projections of abrupt climate-driven eco-system shifts in the North Atlantic. Ecol Lett 11:1157–1168 Behrenfeld MJ, O’Malley RT, Siegel DA, McClain CR and others (2006) Climate-driven trends in contemporary ocean productivity. Nature 444:752–755
Betts AK, Hong SY, Pan HL (1996) Comparison of NCEP-NCAR reanalysis with 1987 FIFE data. Mon Weather Rev 124:1480–1498
Bopp L, Le Quéré C, Heimann M, Manning AC, Monfray P (2002) Climate-induced oceanic oxygen fluxes: implica-tions for the contemporary carbon budget. Global Bio-geochem Cycles 16:1022, doi: 10.1029/2001GB001445 Box GEP, Jenkins GW (1976) Time series analysis: forecasting
and control. Holden-Day, San Francisco, CA
Cabeçadas G, Nogueira M, Brogueira MJ (1999) Nutrient dynamics and productivity in three European estuaries. Mar Pollut Bull 38:1092–1096
Cariton JT, Geller JB (1993) Ecological roulette: the global transport of nonindigenous marine organisms. Science 261:78–82
Carpenter SR, Brock WA (2006) Rising variance: a leading indicator of ecological transition. Ecol Lett 9:311–318 Chan F, Barth JA, Lubchenco J, Kirincich A, Weeks H,
Peter-son WT, Menge BA (2008) Emergence of anoxia in the Cal-ifornia Current large marine ecosystem. Science 319:920 Chatfield C (1996) The analysis of time series: an
introduc-tion. Chapman & Hall, London
Chelton DB (1984) Commentary: short-term climatic variabil-ity in the northeast Pacific Ocean. In: Pearcy W (ed) The influence of ocean conditions on the production of salmo-nids in the North Pacific. Oregon State University Press, Corvallis, OR, p 87–99
Cloern JE (1996) Phytoplankton bloom dynamics in coastal ecosystems: a review with some general lessons from sus-tained investigation of San Francisco Bay, California. Rev Geophys 34:127–168
Cloern JE (2001) Our evolving conceptual model of the coastal eutrophication problem. Mar Ecol Prog Ser 210:223–253 Cury PM, Shannon L, Shin YJ (2002) The functioning of
marine ecosystems: a fisheries perspective. In: Sinclair M, Valdimarsson G (eds) Responsible fisheries in the marine ecosystem. FAO and CAB International, Rome, p 103–123
Diaz RJ (2001) Overview of hypoxia around the world. J Env-iron Qual 30:275–281
Diaz R, Rosenberg R (1995) Marine benthic hypoxia: a review of its ecological effects and the behavioural responses of benthic macrofauna. Oceanogr Mar Biol Annu Rev 33: 245–303
Dickson RR, Turrell WR (2000) The NAO: the dominant atmospheric process affecting oceanic variability in home, middle and distant waters of European Atlantic salmon. In: Mills D (ed) The ocean life of Atlantic salmon: environ-mental and biological factors influencing survival. Fishing News Books, Bodmin, p 92–115
Dobson AP, Bradshaw AD, Baker AJM (1997) Hopes for the future: restoration ecology and conservation biology. Sci-ence 277:515–522
Dolédec S, Chessel D (1994) Co-inertia analysis: an alterna-tive method for studying species-environment relation-ships. Freshw Biol 31:277–294
Drinkwater KF, Belgrano A, Borja A, Conversi A and others (2003) The response of marine ecosystems to climatic vari-ability associated with the North Atlantic Oscillation. Geo-phys Monogr 134:211–234
Edwards M, Richardson AJ (2004) Impact of climate change on marine pelagic phenology and trophic mismatch. Nature 430:881–884
Edwards M, John AWG, Johns DG, Reid PC (2001) Case his-tory and persistence of the non-indigenous diatom
Coscin-odiscus wailesii in the north-east Atlantic. J Mar Biol
Assoc UK 81:207–211
Elmore KL, Richman MB (2001) Euclidean distance as a simi-larity metric for principal component analysis. Mon Weather Rev 129:540–549
➤
➤
➤
➤
➤
➤
➤
➤
➤
➤
➤
➤
➤
➤
➤
➤
➤
➤
➤
➤
➤
➤
➤
➤
➤
➤
➤
➤
Enfield DB, Mestas-Nuñez AM, Trimble PJ (2001) The Atlantic Multidecadal Oscillation and its relationship to rainfall and river flows in the continental U.S. Geophys Res Lett 28:2077–2080
Fernandez de Puelles ML, Valencia J, Vicente L (2004) Zoo-plankton variability and climatic anomalies from 1994 to 2001 in the Balearic Sea (Western Mediterranean). ICES J Mar Sci 61:492–500
Font J, Salat J, Tintoré J (1988) Permanent features of the cir-culation in the Catalan Sea. Oceanol Acta 9:51–57 Frank KT, Petrie B, Choi JS, Leggett WC (2005) Trophic
cas-cades in a formerly cod-dominated ecosystem. Science 308:1621–1623
Fromentin JM, Planque B (1996) Calanus and environment in the eastern North Atlantic. II. Influence of the North Atlantic Oscillation on C. finmarchicus and C.
helgolandi-cus. Mar Ecol Prog Ser 134:111–118
Gaedke U, Ollinger D, Bauerle E, Straile D (1998) The impact of the interannual variability in hydrodynamic conditions on the plankton development in Lake Constance in spring and summer. Adv Limnol 53:565–585
Hare SR, Mantua NJ (2000) Empirical evidence for North Pacific regime shifts in 1977 and 1989. Prog Oceanogr 47: 103–145
Harley CDG, Hughes AR, Hultgren KM, Miner BG and others (2006) The impacts of climate change in coastal marine systems. Ecol Lett 9:228–241
Hawkins SJ, Southward AJ, Genner MJ (2003) Detection of en-vironmental change in a marine ecosystem–evidence from the western English Channel. Sci Total Environ 310:245–256 Henderson-Sellers A, Robinson PJ (1986) Contemporary
cli-matology. John Wiley & Sons, New York, NY
Hochberg Y (1988) A sharper Bonferroni procedure for multi-ple tests of significance. Biometrika 75:800–802
Hohn ME (1993) Principal component analysis of three-way data. In: Davis JC, Hertzfeld UC (eds) Computers in geol-ogy: 25 years of progress. Oxford University Press, New York, NY, p 181–194
Hopkins TS (1985) Physics of the sea. In: Margalef R (ed) Key environments: western Mediterranean. Pergamon Press, New York, NY, p 100–125
Howarth RW (1988) Nutrient limitation of net primary produc-tion in marine ecosystems. Annu Rev Ecol Syst 19:89–110 Hurrell JW (1995a) Decadal trends in the North Atlantic
Oscillation: regional temperatures and precipitations. Sci-ence 269:676–679
Hurrell JW (1995b) Transient eddy forcing of the rotational flow during Northern winter. J Atmos Sci 52:2286–2301 Ibàñez C, Prat N, Canicio A (1996) Changes in the hydrology
and sediment transport produced by large dams on the lower Ebro River and its estuary. Regul Rivers Res Manag 12:51–62
Intergovernmental Panel on Climate Change (IPCC) (2007) Climate change 2007: the physical science basis. Cam-bridge University Press, CamCam-bridge
Irigoien X, Castel J (1997) Light limitation and distribution of chlorophyll pigments in a highly turbid estuary: the Gironde (SW France). Estuar Coast Shelf Sci 44: 507–517
Jennings S, Kaiser MJ (1998) The effects of fishing on marine ecosystems. Adv Mar Biol 34:201–352
Jennings S, Kaiser MJ, Reynolds JD (2001) Marine fisheries ecology. Blackwell Scientific Publishers, Oxford
Jickells TD (1998) Nutrient biogeochemistry of the coastal zone. Science 281:217–222
Joliffe I (1986) Principal component analysis. Springer-Ver-lag, New York, NY
Justic D, Rabalais N, Turner RE (1997) Impacts of climate change on net productivity of coastal waters: implications for carbon budgets and hypoxia. Clim Res 8:225–237 Kalnay E, Kanamitsu M, Kistler R, Collins W and others (1996)
The NCEP/NCAR 40-year reanalysis project. Bull Am Meteorol Soc 77:437–471
Keenlyside NS, Latif M, Jungclaus J, Kornblueh L, Roeckner E (2008) Advancing decadal-scale climate prediction in the North Atlantic sector. Nature 453:84–88
Kirby R, Beaugrand G, Lindley JA (2009) Synergistic effects of climate and fishing in a marine ecosystem. Ecosystems 12: 548–561
Kistler R, Kalnay E, Collins W, Saha S and others (2000) The NCEP–NCAR 50-year reanalysis: monthly means CD-ROM and documentation. Bull Am Meteorol Soc 82: 247–267
Kremer HH, Le Tissier MDA, Burbridge PR, Talaue-McManus L and others (2004) Land –ocean interactions in the coastal zone: science plan and implementation strategy. International Geosphere-Bioshpere Programme Report 51/International Human Dimensions Programme on Global Environmental Change Report 18. IGBP Secre-tariat, Stockholm
Kroncke I, Dippner JW, Heyen H, Zeiss B (1998) Long-term changes in macrofaunal communities off Norderney (East Frisia, Germany) in relation to climate variability. Mar Ecol Prog Ser 167:25–36
Legendre L, Demers S (1984) Towards dynamic biological oceanography and limnology. Can J Fish Aquat Sci 41: 2–19
Legendre P, Legendre L (1998) Numerical ecology, 2nd edn. Elsevier Science BV, Amsterdam
Lehodey P, Alheit J, Barange M, Baumgartner T and others (2006) Climate variability, fish and fisheries. J Clim 19: 5009–5030
Le Tissier MDA, Buddemeier R, Parslow J, Swaney DP and others (2006) The role of the coastal ocean in the disturbed and undisturbed nutrient and carbon cycles — a manage-ment perspective. Land –Ocean Interactions in the Coastal Zone (LOICZ), Geesthacht
Lewis DM, Bala SI (2006) Plankton predation rates in turbu-lence: a study of the limitations imposed on a predator with a non-spherical field of sensory perception. J Theor Biol 242:44–61
Lewis DM, Pedley TJ (2001) The influence of turbulence on plankton predation strategies. J Theor Biol 210:347–365 Lindahl O, Belgrano A, Davidsson L, Hernroth B (1998)
Primary production, climatic oscillations, and physico-chemical processes: the Gullmar Fjord time-series data set (1985–1996). ICES J Mar Sci 55:723–729
Livingston RJ, Niu X, Lewis Iii FG, Woodsum GC (1997) Freshwater input to a gulf estuary: long-term control of trophic organization. Ecol Appl 7:277–299
Lotze HK, Worm B (2002) Complex interactions of climatic and ecological controls on macroalgal recruitment. Limnol Oceanogr 47:1734–1741
Ludwig W, Dumont E, Meybeck M, Heusser S (2009) River discharges of water and nutrients to the Mediterranean and Black Sea: major drivers for ecosystem changes during past and future decades? Prog Oceanogr 80: 199–217
Marshall J, Kushnir Y, Battisti D, Chang P and others (2001) North Atlantic climate variability: phenomena, impacts and mechanisms. Int J Climatol 21:1863–1898
Marty JC, Chiavérini J, Pizay MD, Avril B (2002) Seasonal and interannual dynamics of nutrients and phytoplank-ton pigments in the western Mediterranean Sea at the