HAL Id: ird-01224950
https://hal.ird.fr/ird-01224950
Submitted on 5 Nov 2015
HAL is a multi-disciplinary open access archive for the deposit and dissemination of sci-entific research documents, whether they are pub-lished or not. The documents may come from teaching and research institutions in France or abroad, or from public or private research centers.
L’archive ouverte pluridisciplinaire HAL, est destinée au dépôt et à la diffusion de documents scientifiques de niveau recherche, publiés ou non, émanant des établissements d’enseignement et de recherche français ou étrangers, des laboratoires publics ou privés.
to runoff and erosion : validation at several levels
Bernard Barthès, Eric Roose
To cite this version:
Bernard Barthès, Eric Roose. Aggregate stability as an indicator of soil susceptibility to runoff and erosion : validation at several levels. CATENA, Elsevier, 2002, 47, pp.133-149. �10.1016/S0341-8162(01)00180-1�. �ird-01224950�
Aggregate stability as an indicator of soil susceptibility to runoff and erosion; validation at several levels
Bernard Barthès *, Eric Roose
Institut de Recherche pour le Développement (IRD), BP 5045, 34032 Montpellier cedex 1, France
* Corresponding author. Email: Bernard.Barthes@ird.fr
Abstract
The evaluation of soil susceptibility to runoff and water erosion in the field is often expensive or time-consuming. Several authors have reported that susceptibility is linked to aggregate stability, whose determination is far easier. However, this susceptibility has generally been deduced from rainfall simulation experiments on sieved soil samples, whose behaviour is not always representative of field-scale phenomena. Our aim was to extend the validity of relationships between soil aggregation and erosion through comparisons of topsoil aggregate stability and field-assessed susceptibility to runoff and erosion.
Susceptibility to runoff and erosion was determined at several levels, first on a southern French Regosol, through measurements of runoff and soil loss from 1-m2 microplots under simulated rainfall; second, from 100- to 800-m2 runoff plots on a Nitosol in Benin, a Ferralsol in Cameroon and a Regosol in Mexico (with additional data on Syria from the literature); and finally, soil susceptibility to erosion was determined through semi-quantitative assessment of the frequency of erosion features on vineyard hillsides in southern France. Aggregate stability was determined by immersion in water and wet-sieving of 2-mm sieved air-dried 0-10 cm soil samples, which actually tests aggregate resistance to slaking.
Under simulated rainfall, runoff depth and soil loss after 30 min were negatively correlated with topsoil content in stable macroaggregates (>0.2 mm). On runoff plots, three-year runoff rate and soil loss were negatively correlated with topsoil aggregate stability, especially stable macroaggregate content; these correlations were improved when slope gradient and climate aggressiveness were considered in addition to aggregate stability. On vineyard hillsides, the frequency index of erosion features was negatively correlated with topsoil content in stable macroaggregates, especially in the absence of conservation practices.
These results confirm that aggregate stability is a relevant indicator of soil susceptibility to runoff and erosion, especially in Mediterranean and tropical areas where intense rainfall is frequent. They also confirm that simple laboratory determination can provide data closely correlated with those resulting from field investigations.
Keywords: Erosion; Runoff; Erodibility; Aggregate stability; Slaking
1. Introduction
Soil erosion caused by water is primarily due to particle detachment and transport by rainfall and runoff (Ellison, 1947). This type of erosion is referred to as interrill erosion when detachment and transport are caused by raindrops and shallow surface flow, and as rill erosion when they are caused by runoff concentrated into discernible channels (Jayawardena and Bhuiyan, 1999). The evaluation of soil susceptibility to runoff and water erosion in the field is often expensive or time-consuming. Runoff and soil loss may be assessed at different scales: catchment (>104 m2), plot (10-104 m2) or microplot (<10 m2) (Mutchler et al., 1988; Hudson, 1993). At the catchment scale, evaluation often involves equipping the outlet to measure and sample runoff output, implying either the use of sophisticated equipment or the presence of operators. Similarly, runoff plots have to be fitted out with tanks, and the measurement of collected runoff and sediments also requires operators or expensive equipment. Moreover, these evaluations are made under natural rainfall, and to provide significant results they generally require long-term experiments, i.e. a minimum of three years. At the microplot scale, evaluation of runoff and soil loss often involves rainfall simulation, which is a rather sophisticated method requiring several operators over a period of several days as well as large quantities of water with low electrolyte concentration. Other methods such as 137Cs counting and measurement of magnetic susceptibility have also been used to estimate soil redistribution in the landscape. However, in addition to the need for sophisticated analyses, they provide pluri-decennial balances of soil movements, which are not the most suitable for assessing water erosion and the effects of some of its determinants (e.g. cropping systems). Moreover, variability in 137Cs counting from non-eroded references remains an important concern as regards the first method, as well as variability in parent materials (with different magnetic properties) regarding the second one (Sutherland, 1996; De Jong et al., 1998).
Due to these constraints, soil susceptibility to runoff and erosion, or soil erodibility, has also been evaluated through laboratory tests on small soil samples (<100 g), which are easy to implement and far less expensive and time-consuming than field-experiments. Among these
laboratory tests, those relating to aggregate stability have received much attention. However, the relevance of aggregate stability as an erodibility indicator remains questionable because: (i) relevance has generally been established through comparisons with runoff and soil loss measured under simulated rainfall during laboratory experiments, i.e. on rehandled and sieved soil samples (Bryan, 1968; Luk, 1977; Reichert and Norton, 1994; Amezketa et al., 1996; Le Bissonnais and Arrouays, 1997); (ii) the behaviour of sieved rehandled samples is not always representative of field phenomena.
The objective of our work was to extend the validation of soil aggregation characterisation as a simple and relevant method to evaluate soil susceptibility to runoff and water erosion. This was done through comparisons of topsoil aggregate stability and field-assessed susceptibility to runoff and erosion. Aggregate stability was determined through immersion and subsequent wet-sieving of <2-mm air-dried soil samples into water, which actually tests aggregate resistance to slaking (Le Bissonnais, 1996). Susceptibility to runoff and erosion was determined at three levels: first through measurements of runoff and soil loss from microplots (1 m2) under simulated rainfall in a southern French Regosol; second through three-year measurements of runoff and soil loss on runoff plots (100 to 800 m2) in Benin, Cameroon and Mexico, with additional data on Syria from the literature; and lastly, soil susceptibility to erosion was determined through the semi-quantitative assessment of the frequency of erosion features, on vineyard hillslopes in southern France.
2. Materials and methods
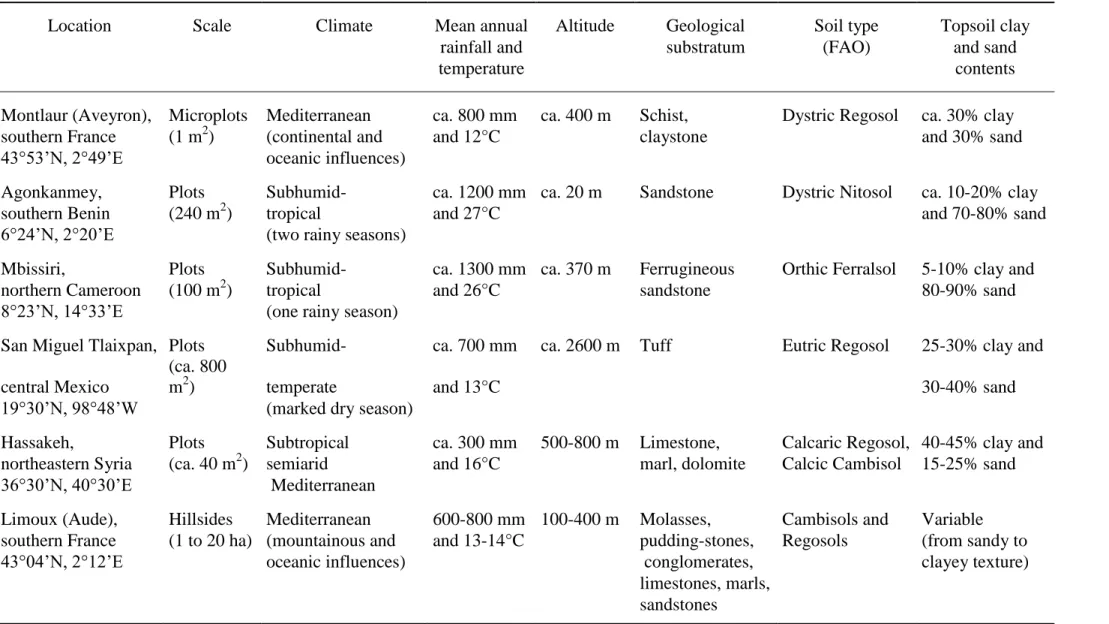
Information on the location, climate, geology and soils of the experimental sites is presented in Table 1.
2.1 Rainfall simulation on microplots in Aveyron, southern France (Barthès et al., 1998, 1999)
Rainfall simulation tests were carried out in Montlaur, in the Department of Aveyron, in southern France. The experimental plots were located on the upper part of a hill with a slope of 5-12%. The experimental design included seven 18 9 m plots mechanically cropped with spring-oats: flat mouldboard ploughing, raised mouldboard ploughing and superficial tillage with either mineral fertilizers or sheep manure, and direct drilling with sheep manure only. Soil sampling and rainfall simulation were done ten weeks after seeding. Rainfall simulation was carried out with an ORSTOM device (Asseline and Valentin, 1978). Rainfall was produced by a nozzle mounted on a 4-m-high tower, and was applied to a 1 1 m microplot
surrounded by a half-buried frame with an opening at the lower side to collect runoff. Prior to the rainfall
Table 1. Main characteristics of the experimental situations.
Location Scale Climate Mean annual Altitude Geological Soil type Topsoil clay rainfall and substratum (FAO) and sand
temperature contents
Montlaur (Aveyron), Microplots Mediterranean ca. 800 mm ca. 400 m Schist, Dystric Regosol ca. 30% clay southern France (1 m2) (continental and and 12°C claystone and 30% sand 43°53’N, 2°49’E oceanic influences)
Agonkanmey, Plots Subhumid- ca. 1200 mm ca. 20 m Sandstone Dystric Nitosol ca. 10-20% clay southern Benin (240 m2) tropical and 27°C and 70-80% sand 6°24’N, 2°20’E (two rainy seasons)
Mbissiri, Plots Subhumid- ca. 1300 mm ca. 370 m Ferrugineous Orthic Ferralsol 5-10% clay and northern Cameroon (100 m2) tropical and 26°C sandstone 80-90% sand 8°23’N, 14°33’E (one rainy season)
San Miguel Tlaixpan, Plots Subhumid- ca. 700 mm ca. 2600 m Tuff Eutric Regosol 25-30% clay and
central Mexico
(ca. 800
m2) temperate and 13°C 30-40% sand
19°30’N, 98°48’W (marked dry season)
Hassakeh, Plots Subtropical ca. 300 mm 500-800 m Limestone, Calcaric Regosol, 40-45% clay and northeastern Syria (ca. 40 m2) semiarid and 16°C marl, dolomite Calcic Cambisol 15-25% sand 36°30’N, 40°30’E Mediterranean
Limoux (Aude), Hillsides Mediterranean 600-800 mm 100-400 m Molasses, Cambisols and Variable southern France (1 to 20 ha) (mountainous and and 13-14°C pudding-stones, Regosols (from sandy to 43°04’N, 2°12’E oceanic influences) conglomerates, clayey texture)
limestones, marls, sandstones
application, microplot vegetation was uprooted and the top 15 cm of the soil was manually tilled, in order to obtain similar roughness in all plots. Rainfall at 60 mm h-1 was applied to each experimental plot, beginning with dry soil and continuing until runoff steady state was achieved. Runoff intensity and solid discharge were measured by means of periodical runoff sampling, and these values were cumulated to calculate runoff depth and soil loss respectively. Undisturbed 0-10 cm soil samples were collected close to each microplot.
2.2 Runoff plots in Benin, Cameroon, Mexico (Barthès et al., 2000) and Syria (Shinjo et al., 2000)
Runoff plots were set up in Agonkanmey (southern Benin), Mbissiri (northern Cameroon), and San Miguel Tlaixpan (central Mexico).
At Agonkanmey (Benin), the study was carried out on four 30 8 m runoff plots with 4% slope, with one cultivation treatment tested in each plot: pure maize cropping system with or without mineral fertilization, and intercropping of maize and a legume cover crop (Mucuna
pruriens var. utilis) every year or one year out of two (with pure maize cropping during the
second year), in each case with superficial hoe cultivation. Current experimentation began in 1988, but our study is concerned only with the years 1995-97. Annual rainfall reached respectively 1000, 1126 and 1558 mm in 1995, 1996 and 1997, and the rainfall erosion index respectively 8762, 9768 and 13516 MJ mm (ha h)-1, i.e. an average of 10688 (following Wischmeier and Smith, 1978, this index was determined by adding, over a period of one year, the products of the energy of each rainstorm multiplied by its maximum 30-min intensity). At Mbissiri (Cameroon), the study was carried out on five 20 5 m runoff plots, with one treatment per plot: savanna (1% slope), mouldboard ploughing on a 30-year-old clearing with either residue removal or spreading (2.5% slope), and either mouldboard ploughing with residue removal or direct drilling on a 1991 clearing (2% slope). The four cultivated plots were cropped in maize (1991, 1993) and cotton (1992, 1994), and involved mechanized mounding with the rows parallel to the slope, and mineral fertilization. Experimentation began in 1991, but our study is concerned only with the years 1992-94. Annual rainfall reached respectively 1511, 1072 and 1353 mm in 1992, 1993 and 1994, and the rainfall erosion index respectively 13620, 8606 and 7513 MJ mm (ha h)-1, i.e. an average of 9907. At San Miguel Tlaixpan (Mexico), the experimental plots were set up on material resulting from splitting up and loosening of an outcropping indurated horizon, called tepetate. Cultivation of the tepetate involved 40-cm deep subsoiling, terracing, mouldboard ploughing
0 1 2 3 350 400 450 R u n o ff d e p th i n 3 0 m in ( m m ) r=-0.950** 0 10 20 30 40 350 400 450 S o il l o s s i n 3 0 m in ( g m -2) r=-0.900** 30 40 50 60 350 400 450 S te a d y s ta te r u n o ff in te n s it y ( m m h -1) r=-0.693 NS 0 1 2 3 10 15 20 r=-0.676NS 0 10 20 30 40 10 15 20 r=-0.753NS 30 40 50 60 10 15 20 r=-0.788* 0.0 0.5 1.0 10 15 20
Total carbon content (g kg-1soil <2 mm) r=-0.982** 0.0 0.5 1.0 350 400 450 S te a d y s ta te s o li d d is c h a rg e ( k g m -2 h -1) Macroaggr2 (g kg-1soil <0.2 mm) r=-0.773*
Figure 1. Relationships between runoff or erosion parameters under simulated rainfall, and
topsoil (0-10 cm) contents in stable macroaggregates (>0.2 mm) or total carbon, in a southern France Regosol.
then twofold disc-harrowing. The study was carried out on five 40 20 m runoff plots, with one treatment per plot: the reference plot (4.4% slope) was under cereal-legume mixed cropping with mineral fertilization; the other plots differed from the reference one in fourfold disc-harrowing (second plot, 2.5% slope), monocropping of cereals (third plot, 3.2% slope), manure application instead of mineral fertilization (fourth plot, 3.4% slope), and 60-cm deep subsoiling (fifth plot, 4.7% slope). Experimentation began in 1993 and our study is concerned with the years 1993-95. Annual rainfall reached respectively 411, 736 and 768 mm in 1993, 1994 and 1995, and rainfall erosion index respectively 954, 2151 and 1961 MJ mm (ha h)-1, i.e. an average of 1683.
All 14 runoff plots were surrounded by half-buried sheets and fitted out with collectors draining runoff and sediments toward tanks set up in series. The runoff amount was assessed on every plot after each rainfall event by measuring the volume of water in each tank and multiplying it by a coefficient depending on divisors. Runoff depth was calculated by dividing the runoff amount by the plot area; annual runoff rate was defined as the ratio of annual runoff depth to annual precipitation, and three-year runoff rate as the ratio of three-year runoff depth to three-year precipitation. Wet coarse sediments were collected at the bottom of the first tank and weighed; dry coarse sediment amount was determined after oven-drying of the whole or of aliquots. Quantities of suspended sediment were assessed by flocculation and oven-drying of aliquots collected in the tanks. Annual soil loss was defined as the sum of dry-coarse and -suspended sediment amounts over one year; its average over three years was denoted mean annual soil loss. Composite soil samples were collected on each plot at a 0-10 cm depth, towards the end of the studies.
We completed our results with those from Shinjo et al. (2000), relating to six runoff plots near Hassakeh, in north-eastern Syria. The plots covered 21 1.8 m and had slopes ranging from 3 to 19%. They were mainly under herbaceous and shrub vegetation and either extensively grazed as natural rangeland or preserved from grazing, with an additional tilled fallow. The average rainfall erosion index was 215 MJ mm (ha h)-1. Equipment and measurements were similar to those used in Benin, Cameroon and Mexico.
Although these 20 runoff plots represented a wide range of cropping systems and soil and climate conditions, the variations in slope gradient (generally <5%), length (from 20 to 40 m) and vegetation cover (mainly herbaceous) between plots were generally rather low.
0.0 0.1 0.2 0.3 0.4 0.5 0 1 2 3 4 5 T h re e -y e a r ru n o ff r a te (m m m m -1) 103/ Macroaggr2 r=0.824** 0 10 20 30 40 0 1 2 3 4 5 M e a n a n n u a l s o il l o s s (M g h a -1 yr -1) 103/ Macroaggr2 r=0.732** 0.0 0.1 0.2 0.3 0.4 0.5 0 50 100 150 SlopeRainfall / Macroaggr2
Ben Cam Mex Syr
r=0.859** 0 10 20 30 40 0 50 100 150 SlopeRainfall / Macroaggr2 r=0.895** 0.0 0.1 0.2 0.3 0.4 0.5 0 100 200 300 SlopeRainfall x Microaggr1 x 10-4 r=0.871** 0 10 20 30 40 0 300 600 900 SlopeRainfall x Mesoaggr1 x 10-4 r=0.922**
Figure 2. Relationships between three-year runoff rate or mean annual soil loss and topsoil (0-10 cm) aggregation and environment parameters,
in runoff plots from Benin, Cameroon, Mexico and Syria (Macroaggr2 >0.2 mm in Benin, Cameroon and Mexico, >0.25 mm in Syria, in g kg-1 soil <0.2 mm; Microaggr1 <0.02 mm and 0.02< Mesoaggr1 <0.2 mm, in g kg-1 soil <2 mm; SlopeRainfall = slope gradient × mean rainfall erosion index, in % and MJ mm (ha h)-1, respectively).
2.3 Semi-quantitative assessment of erosion features on hillsides in Aude, southern France (Guichou, 1998)
The Limoux vineyard is located on the hillsides of the Pyrenean piedmont, in the Department of Aude, in southern France. Eight hillsides were studied, each covering between 1 and 20 ha, with slopes often reaching 20% under cultivation. Each hillside was divided into functional segments with homogeneous slope (shape, gradient), topsoil (colour, texture, stoniness) and geological substratum, which were briefly characterised in the field; land use, direction of the vineyard rows and conservation practices, such as ditches and grass strips, were also noted. Altogether 23 segments were identified for the eight hillsides. The frequency of each type of erosion feature was assessed semi-quantitatively on three perpendicular-to-the-slope 10-m transects per functional segment, and marked from 0 (absence) to 4 (omnipresence): these erosion features were sedimentation crusts (whose frequency was denoted a1), stones on the
soil surface (a2), small pedestals (a3), microcliffs (a4), related to sheet erosion, and grooves
(whose frequency was denoted b), rills (c) and gullies (d), related to linear erosion (grooves, rills and gullies were defined by their depth, which was <10, 10-30 and >30 cm, respectively). The erosion index was defined as:
erosion index = a1 + a2 + a3 + a4 + 2b + 3c + 4d. (1)
This erosion index was averaged over the three transects of each functional segment. Erosion features were not visible on some plots, which had been tilled a few days before observations were made; the erosion index was thus determined on the 17 remaining segments. In addition, composite soil samples were collected on each functional segment at a depth of 0-10 cm.
2.4 Soil analysis
Water-stability of aggregates was determined on 2-mm sieved air-dried soil samples of 4 g, in four replicates, using a test adapted from Kemper & Rosenau (1986). Each sample was rapidly immersed in deionized water for 30 min (Aveyron) or 2 h (runoff plots and Aude); both immersion times were assumed to give equivalent results. The sample was then wet-sieved using a motor-driven holder lowering and raising 0.2-mm sieves in containers of water, following Kemper & Rosenau (1986); the stroke length was 1.3 cm and the sieving frequency was 35 cycles min-1 for 6 min. The fraction <0.2 mm was collected to determine fraction <0.02 mm by sedimentation (pipette method); this fraction <0.02 mm was denoted microaggregate fraction (Microaggr1). The fraction >0.2 mm was dried at 105°C and weighed; next it was sieved into dispersive NaOH solution (0.05 M) for 30 min using the same
device, then dried at 105°C and weighed to determine coarse sand content (with coarse organic matter
Table 2. Semi-quantitative assessment of the frequency of erosion features and topsoil (0-10 cm) content in stable macroaggregates (>0.2 mm),
on hillsides of southern France (a1, a2, a3 and a4 were the frequencies of sedimentation crusts, stones on the soil surface, small pedestals and
microcliffs, respectively, whereas b, c and d were the frequencies of grooves, rills and gullies, respectively; the erosion index was defined as the sum a1 + a2 + a3 + a4 + 2b + 3c + 4d; Macroaggr1 in g kg-1 soil <2 mm and Macroaggr2 in g kg-1 soil <0.2 mm).
Hillside / segment Assessment of erosion features Aggregation
Replicate 1 Replicate 2 Replicate 3 Erosion Macro- Macro-
a1 a2 a3 a4 b c d a1 a2 a3 a4 b c d a1 a2 a3 a4 b c d index aggr1 aggr2
Couteille 1 / a Recently tilled 178 255
Couteille 1 / b Recently tilled 154 245
Couteille 1 / c 0 0 0 0 0 1 0 0 0 0 0 1 0 0 1 0 0 0 0 0 0 2 301 441
Couteille 2 / a Recently tilled 178 255
Couteille 2 / b* 0 0 0 0 2 0 0 0 0 0 0 2 0 0 0 0 0 0 2 0 0 4 122 166
Couteille 2 / c* 1 2 0 0 0 0 0 2 0 0 0 0 0 0 2 0.5 0 0 0 0 0 2.5 148 255
Pradals 1 / a 0 0 0 0 0 2 0 0 0 0 0 0 2 0 0 0 0 0 0 2 0 6 136 203
Pradals 1 / b* 0 0 0 0 2 0 0 0 0 0 0 0.5 1 0 0 0 0 0 2 0 0 4 96 124
Pradals 1 / c Recently tilled 91 133
Pradals 1 / d* 1 0 0 0 1 0 0 1 0 0 0 1 0 0 0 0 0 0 0 0 0 2 185 272
Pradals 1 / e Recently tilled 185 272
Pradals 2 / a 0 1 1 0 2 1 0 0 2 0 0 1 0 0 0 0 1 1 0 2 0 7 69 123 Pradals 2 / b 0 1 1 1 2 1 0 0 0 0 0 1.5 1 0 1 0 1 1 1 0 0 7 69 123 Pradals 2 / c 0 0 0 0 2 0 0 0 0 0 0 2 0 0 0 0 0 0 2 0 0 4 237 367 Ginestas 1 / a 1 1 0 0 2 0 0 0 0 0 0 3 0 0 0 0 0 0 3 0 0 6 216 235 Ginestas 1 / b 1 1 0 0 1 2 0 0 0 0 0 0 2 0 0 0 0 0 1 1 0 7 51 55 Ginestas 2 / a* 0 0 0 0 1 0 0 0 0 0 0 1 0 0 0 0 0 0 1 0 0 2 84 89 Pech-Cerda / a* 0 0 0 0 1 0 0 0 0 0 0 1 0 0 0 0 0 0 1 0 0 2 540 562
Pech-Cerda / b Not measured 402 425
Pech-Cerda / c 1 2 1 0 0 2 0 1 0 0 0 3 0 0 0 1 1 0 1 0 0 7 95 104 Pech-Cerda / d 1 1 0 0 1 0 0 0 0 0 0 1 0 0 0 0 0 0 0 0 0 2 474 489 Roquentin / a 1 1 1 0 0 0 0 1 0 0 1 0 0 0 2 1 1 1 1 1 0 5 238 345 Roquentin / b 1 0 0 0 0 0 0 2 0 0 0 0 0 0 0 1 0 0 1 0 0 2 226 339
* Functional segment with conservation practices
weight being considered as negligible). Macroaggregate (>0.2 mm) and mesoaggregate (0.02-0.2 mm) fractions (Macroaggr1 and Mesoaggr1) were defined as follows:
Macroaggr1 = Fraction >0.2 – Coarse sands (2) Mesoaggr1 = 1000 – Coarse sands - Macroaggr1 – Microaggr1. (3)
Coarse sand, Fraction >0.2, Macroaggr1, Mesoaggr1 and Microaggr1 were expressed in g kg-1 soil <2 mm. Following Kemper & Rosenau (1986), macro-, meso- and microaggregate fractions were also determined on a basis free of coarse sand (Macroaggr2, Mesoaggr2 and Microaggr2, respectively), as follows:
Macroaggr2 = 1000 Macroaggr1 / (1000 - Coarse sands) (4) Mesoaggr2 = 1000 Mesoaggr1 / (1000 - Coarse sands) (5) Microaggr2 = 1000 Microaggr1 / (1000 - Coarse sands), (6)
with Macroaggr2 + Mesoaggr2 + Microaggr2 = 1000 g kg-1 soil <0.2 mm. The macroaggregate fraction (>0.2 mm) included aggregates only, whereas meso- and microaggregate fractions (0.02-0.2 and <0.02 mm, respectively) included genuine aggregates as well as elementary particles of the corresponding sizes.
As regards the experiment carried out in Syria (Shinjo et al., 2000), determination of topsoil aggregate stability differed from ours in the following ways: soil samples were collected from the surface horizons, whose depth ranged from 3 to 11 cm (instead of 0-10 cm), and only 1-2 mm dry aggregates were tested (instead of <1-2 mm-dry soil); wet-sieving followed immediately after immersion (instead of after a delay of 30-min or 2-h), stroke length was 5 cm and sieving frequency 30 cycles min-1 for 5 min (instead of 1.3 cm and 35 cycles min-1 for 6 min, respectively); only macroaggregate content was determined (>0.25 mm, instead of >0.20 mm).
Total carbon content of samples from Aveyron, Benin, Cameroon and Mexico was determined by dry combustion using an Elemental Analyser (CHN 600, Leco Corporation, St Joseph, MI).
2.5 Statistical analysis
Correlation coefficients (r) significant at p<0.05 and p<0.01 were denoted * and **, respectively, whereas non significant ones were denoted NS.
3. Results
Within the population formed by the seven plots, runoff and erosion measured under simulated rainfall on microplots were correlated with topsoil (0-10 cm) aggregate stability or carbon content C. In this manner, runoff depth and soil loss during the initial 30 min of rainfall were significantly correlated with Macroaggr1 (r=-0.937** and r=-0.811*, respectively) and with Macroaggr2 (r=-0.950** and r=-0.900**, respectively), but not with C (r -0.753NS). During runoff steady state, which was reached 50 to 90 min after the onset of rainfall, runoff intensity and solid discharge were correlated with C (r=-0.788* and
r=-0.982**, respectively), but solid discharge only was correlated with Macroaggr2
(r=-0.773*). Other correlations between rainfall simulation parameters and aggregation were not significant, except that between the 30-min runoff depth and Mesoaggr2 (r=0.808*). Runoff and erosion were thus closely linked with topsoil macroaggregate stability during the first part of the rainfall. During the second part of the rainfall, they were mainly linked with C, and to a lesser extent with macroaggregate stability; however, rainfall with an intensity of 60-mm h-1 and lasting 30 minutes occurs only every ten years in this region.
3.2 Runoff plots in Benin, Cameroon, Mexico and Syria (Figure 2)
Correlation coefficients involving Macroaggr1 and Macroaggr2 were calculated within the population formed by all 20 runoff plots, including those in Syria. Correlations involving other aggregation parameters or C were only determined within the population formed by the 14 plots in Benin, Cameroon and Mexico.
There were simple linear correlations between runoff or erosion measured on runoff plots and topsoil aggregation parameters. In this manner, the three-year runoff rate and mean annual soil loss were significantly correlated with Macroaggr1 and Macroaggr2 (-0.73**< r <-0.62**), with their inverse functions 1/Macroaggr1 and 1/Macroaggr2 (0.73**< r <0.84**), with Mesoaggr2 (0.68**< r <0.73**), but not with the other aggregation parameters or C (r <0.5NS).
Multiple linear correlations between (i) three-year runoff rate or mean annual soil loss and (ii) slope gradient, mean rainfall erosion index and aggregation parameters were closer than correlations involving only aggregation parameters. With this approach, the three-year runoff rate was significantly correlated with slope gradient, mean rainfall erosion index and Macroaggr2, 1/Macroaggr1, 1/Macroaggr2, Mesoaggr1, Mesoaggr2, Microaggr1 or Microaggr2 (0.84**< r <0.92**). Similarly, the mean annual soil loss was correlated with
slope gradient, mean rainfall erosion index and Macroaggr2, 1/Macroaggr1, 1/Macroaggr2, Mesoaggr1 or Mesoaggr2 (0.82**< r <0.94**).
There were also simple linear correlations between runoff rate or erosion and the product of one of the aggregation parameters (or C) multiplied by a SlopeRainfall factor; this factor was defined as the product of slope gradient (%) by mean rainfall erosion index (MJ mm (ha h)-1). With this approach, the three-year runoff rate and mean annual soil loss were significantly correlated with the product of SlopeRainfall factor by 1/Macroaggr2, Mesoaggr1, Microaggr1, Microaggr2 or 1/C (0.81**< r <0.93**).
Mean annual runoff and erosion measured on runoff plots were thus closely linked with the stability of the topsoil aggregates, especially that of the macroaggregates. Correlations were improved when slope gradient and rainfall aggressiveness were taken into consideration in addition to aggregate stability.
3.3 Semi-quantitative assessment of erosion features on hillsides in Aude, southern France (Table 2 and Figure 3)
Carbon content and meso- and microaggregate fractions were not determined on the samples collected for this study. Within the population formed by the 17 functional segments where the frequency of erosion features was assessed, there were significant simple linear correlations between the semi-quantitative erosion index and Macroaggr1 (r=-0.584*) or Macroaggr2 (r=-0.634**).
Conservation practices such as grass strips, ditches and vineyard planting perpendicular to the slope were observed on six segments; as such practices could reduce runoff and erosion, erosion features on those segments were assumed to be less directly related to soil aggregation. Indeed, the correlation between the erosion index and Macroaggr1 or Macroaggr2 was closer within the 11 remaining segments with no conservation practices (r=-0.855** and r=-0.924**, respectively), than within the population formed by the 17 segments.
4. Discussion
Many authors have reported negative relationships between aggregate stability and soil susceptibility to runoff and erosion (Bryan, 1968; Luk, 1977; Reichert and Norton, 1994; Amezketa et al., 1996; Le Bissonnais and Arrouays, 1997). However, this susceptibility was generally assessed through rainfall simulations on rehandled and sieved soil samples, whose behaviour is not always representative of phenomena occurring in the field. Some authors
have also reported relationships between aggregate stability and soil susceptibility to erosion from field experiments, under simulated rainfall on microplots (Roth et al., 1987; Valentin and Janeau, 1989; Bajracharya et al., 1992; Van Dijk et al., 1996) or under natural rainfall on runoff
Figure 3. Relationship between the semi-quantitative erosion index and topsoil (0-10 cm)
content in stable macroaggregates (the erosion index is the sum of the weighted frequencies of erosion features observed on the hillsides; Macroaggr2 >0.2 mm, in g kg-1 soil <0.2 mm).
plots (Quantin and Combeau, 1962); but each study referred to only a limited number of soil types. Our results confirmed that topsoil aggregate stability was closely and negatively related to soil susceptibility to runoff and erosion investigated in the field at different scales, in different locations and contexts, and using different methods: quantification on 1-m2 microplots under simulated rainfall in southern France; quantification on 100- to 800-m2 runoff plots under natural rainfall in Benin, Cameroon and Mexico (with additional data on Syria from the literature); semi-quantitative determination of the frequency of erosion features on hillsides in southern France.
More precisely, our results showed that soil susceptibility to runoff and erosion was linked to topsoil aggregate resistance to slaking: indeed, slaking results from the compression of air entrapped inside rapidly wetted aggregates, and it is the main mechanism causing aggregates to disintegrate when dry soil is immersed (Le Bissonnais, 1996; Fox and Le Bissonnais, 1998), as was the case in our studies. As other mechanisms than slaking may determine aggregate breakdown, some authors have proposed improvements in the measurement of aggregate stability. In order to distinguish between the elementary mechanisms responsible for aggregate breakdown, i.e. slaking, microcracking through differential swelling, mechanical breakdown by raindrop impact, and physico-chemical dispersion, Le Bissonnais
(1996) designed a method combining three treatments: fast wetting in water, slow wetting in water, and stirring after pre-wetting. Though rather time-consuming, this improved method also has the advantage of separating disintegration and the measurement of this disintegration, which is achieved through gentle wet-sieving in ethanol. Le Bissonnais (1996) nevertheless considered fast wetting, i.e. immersion wetting, as the simplest way to check aggregate stability, and as a good way to compare the behaviour of large ranges of soils on fast wetting under dry conditions. Moreover, using the procedure proposed by Le Bissonnais on a range of California soils, Amezketa et al. (1996) found that among the aggregate stability parameters they tested, those which involved slaking were the most closely correlated with erosion parameters under simulated rainfall. Furthermore, Loch and Foley (1994), studying a wide range of Australian soils, recommended the wetting of soil samples using simulated rainfall, because it produced results more relevant to soil behaviour under field conditions than did tests based on immersion wetting. However, they noted that immersion wetting caused similar aggregate breakdown on average to that from rainfall wetting, and produced results significantly correlated with those from infiltration experiments under field conditions (especially when deleting the swelling soils from the data set). In addition, they suggested that, for most soils, the wetting rate was of greater importance than drop impact as a factor in aggregate breakdown on wetting. Morin and Van Winkel (1996) also questioned the importance of raindrop impact in soil crusting, as they observed the formation of a dense crust on sand protected from rain impact but located downslope from rainfall wetted clay. Moreover, Van Dijk et al. (1996), in field rainfall simulations on a silty loess, showed that runoff was better correlated with the degree of surface slaking, assessed by visual comparisons, than with the kinetic energy of rainfall or aggregate stability determined through a drop test; on the opposite, drop test and measurement of rainfall energy allowed a better prediction of splash erosion than did the assessment of slaking. Studying crust formation on a sandy clay loam Alfisol, Bajracharya and Lal (1998) reported that mechanical breakdown of aggregates by raindrop impact mainly occurred during the early stage of the rain event. Also studying crust formation but on artificial aggregates from Entisols and Inceptisols, Tanaka et al. (1999) distinguished between initial heavy rainfall, which promoted slaking, and initial gentle rainfall, which promoted weakening of aggregates subsequently disintegrated by impact and residual effect of slaking. Though several mechanisms may contribute to aggregate disintegration, slaking may thus be considered as particularly important, especially (i) in tropical or Mediterranean areas, where intense rainfall is frequent (Roose, 1996), and (ii)
in soils with low exchangeable sodium proportion (ESP) and swelling clay content, as was the case in our studies.
However, aggregate disintegration is not the only mechanism involved in erosion: particle detachment through shearing by raindrops and overland flow, as well as transport by rainsplash and runoff, may also contribute to soil erosion by water (Ellison, 1947; Casenave and Valentin, 1989; Agassi and Bradford, 1999). In interrill areas, detachment by sheet flow and transport by rainsplash have often been regarded as negligible, and erosion as resulting mainly from particle detachment by raindrops and sediment transport by sheet flow (Zhang et al., 1998; Agassi and Bradford, 1999). Detachment by rainfall has even been recognized as the dominant erosive force affecting erosion rate in interrill areas, where transport capacity is generally not acknowledged to be a limiting factor (Poesen, 1992; Jayawardena and Bhuiyan, 1999). Considering that aggregate resistance to slaking greatly influences soil detachment by rainfall, especially on Mediterranean and tropical soils with low ESP and swelling clay content, it may thus be concluded that it is an important determinant of interrill erosion. Indeed, the water-stability of macroaggregates is known to prevent detachment of easily transportable particles, and thereby surface clogging and runoff (Le Bissonnais, 1996). Moreover, it has been suggested that the rate of aggregate disintegration determined the rate of seal formation (Shainberg et al., 1997), and it is well established that surface sealing promotes overland-flow generation, and hence, the potential for rilling (Poesen, 1992); consequently topsoil aggregate stability may also be considered an important determinant of rill erosion. Thus the influence of topsoil aggregate resistance to slaking on interrill and rill erosion explains the relationships between aggregate stability and susceptibility to runoff and erosion, especially on low-ESP non-swelling soils that are frequently subject to intense rainfall. Such relationships were observed in each of our three experiments, which involved either interrill erosion alone, particularly on 1-m2 microplots, or both interrill and rill erosion, e.g. on the hillsides in Aude which displayed grooves and rills (Table 2).
Several authors have distinguished between detachment-limiting sediment delivery, controlled by topsoil properties such as soil strength and aggregate stability, and transport-limiting sediment delivery, controlled by the size and density of pre-detached particles (Huang, 1998; Agassi and Bradford, 1999). Based on the links between aggregate stability and erosion, we may assume that detachment-limiting conditions generally prevailed in our experimental plots. Runoff occurs when more rain falls than is absorbed by the soil, and in addition to limited infiltration capacity promoted by aggregate disintegration and subsequent surface clogging, the limited capacity of soil moisture storage has been recognized as a possible cause
of erosion (Van Dijk and Kwaad, 1996; Martínez-Mena et al., 1998). However, again considering the link between topsoil aggregate stability and susceptibility to runoff and erosion, it is likely that our experiments involved infiltration-excess rather than saturation-excess overland flow.
Some authors have proposed to study aggregate stability using calibrated dry aggregates, e.g. 3 to 5 mm, instead of soil fraction <2 mm, which may contain small particles or aggregates resulting from excessive and non-controlled disintegration by initial dry-sieving (Le Bissonnais and Le Souder, 1995). However, small particles and aggregates may also result directly from soil structural conditions at sampling time (e.g. due to excessive pulverisation by disc-harrowing) and as such easily transportable particles greatly influence seal formation, discarding them and using calibrated aggregates might sometimes be inappropriate when studying soil erodibility. Moreover, it is difficult to recover large aggregates from some coarse-textured soils, which pass entirely through a 2-mm sieve during dry-sieving (e.g. our samples from Benin and Cameroon). Thus we would have encountered some difficulty in aggregation studies using calibrated aggregates, whereas using <2 mm soil samples led to results which were closely related to field measurements and observations. In our studies, considering rainfall aggressiveness, slope and the existence of conservation practices in addition to topsoil aggregation resulted in better relationships with soil susceptibility to runoff and erosion than only considering aggregation. The Universal Soil Loss Equation relates erosion to rainfall aggressiveness, soil erodibility, slope, cover and management, and conservation practices (Wischmeier and Smith, 1978); for erosion modelling purposes, it might thus be suitable to express soil erodibility through topsoil aggregate stability.
5. Conclusion
Soil susceptibility to runoff and erosion was investigated in the field at several scales, from 1-m2 microplot to hillside, and using different methods: measurements of runoff rates and soil loss under natural or simulated rainfall, semi-quantitative determination of the frequency of erosion features. The investigations were carried out in different soil and climate conditions: southern France, southern Benin, northern Cameroon, central Mexico; however all the soils had low exchangeable sodium proportion and swelling clay content, and were frequently subject to intense rainfall. Soil susceptibility to runoff and erosion was closely related to the stability of topsoil (0-10 cm) aggregates, assessed through immersion of 2-mm sieved air-dried samples (which actually checks aggregate resistance to slaking). This relationship was
improved when variables such as climate aggressiveness, slope and the existence of conservation practices were considered in addition to aggregate stability.
Thus simple laboratory determination could provide data significantly correlated with those resulting from more expensive or time-consuming field investigations. The resistance of 2-mm sieved air-dried topsoil samples to slaking may thus be regarded as a relevant indicator of soil resistance to runoff and erosion at scales varying from m2 to ha, especially on low-ESP non-swelling Mediterranean and tropical soils. The relevance of aggregate stability as an indicator of soil susceptibility to erosion has already been reported, but rarely through field investigations on a wide range of soil types, as was the case in our studies.
Acknowledgements
We thank G. De Noni, D. Goodfellow, C. Guichou, M.C. Larré-Larrouy and P. Thompson for their assistance, and anonymous referees for their comments.
References
Agassi, M., Bradford, J.M., 1999. Methodologies for interrill soil erosion studies. Soil and Tillage Research 49, 277-287.
Amezketa, E., Singer, M.J., Le Bissonnais, Y., 1996. Testing a new procedure for measuring water-stable aggregation. Soil Science Society of America Journal 60, 888-894.
Asseline, J., Valentin, C., 1978. Construction et mise au point d'un infiltromètre à aspersion. Cahiers ORSTOM, série Hydrologie 15, 321-349.
Bajracharya, R.M., Elliott, W.J., Lal, R., 1992. Interrill erodibility of some Ohio soils based on field rainfall simulator. Soil Science Society of America Journal 56, 267-272.
Bajracharya, R.M., Lal, R., 1998. Crusting effects on erosion processes under simulated rainfall on a tropical Alfisol. Hydrological Processes 12, 1927-1938.
Barthès, B., Albrecht, A., Asseline, J., De Noni, G., Roose, E., Viennot, M., 1998. Pratiques culturales et érodibilité du sol dans les Rougiers de Camarès (Aveyron). Etude et Gestion des Sols 5, 157-170.
Barthès, B., Albrecht, A., Asseline, J., De Noni, G., Roose, E., 1999. Relationships between soil erodibility and topsoil aggregate stability or carbon content in a cultivated Mediterranean highland (Aveyron, France). Communications in Soil Science and Plant Analysis 30, 1929-1938.
Barthès, B., Azontonde, A., Boli, B.Z., Prat, C., Roose, E., 2000. Field-scale run-off and erosion in relation to topsoil aggregate stability in three tropical regions (Benin, Cameroon, Mexico). European Journal of Soil Science 51, 485-496.
Bryan, R.B., 1968. The development, use and efficiency of indices of soil erodibility. Geoderma 2, 5-26.
Casenave, A., Valentin, C., 1989. Les états de surface de la zone sahélienne. Influence sur l’infiltration. ORSTOM, Paris, 229 pp.
De Jong, E., Nestor, P.A., Pennock, D.J., 1998. The use of magnetic susceptibility to measure long-term soil redistribution. Catena 32, 23-25.
Ellison, W.D., 1947. Soil erosion studies - part I. Agriculture Engineering 28, 145-146.
Fox, D.M., Le Bissonnais, Y., 1998. Process-based analysis of aggregate stability effects on sealing, infiltration, and interrill erosion. Soil Science Society of America Journal 62, 717-724.
Guichou, C., 1998. Lutte contre l’érosion dans le vignoble limouxin (Aude). Mémoire Ecole Nationale Supérieure Agronomique de Toulouse, 61 pp.
Huang, C., 1998. Sediment regimes under different slopes and surface hydrologic conditions. Soil Science Society of America Journal 62, 423-430.
Hudson, N.W., 1993. Field measurement of soil erosion and runoff. FAO Soils Bulletin 68, 139 pp. Jayawardena, A.W., Bhuiyan, R.R., 1999. Evaluation of an interrill soil erosion model using
laboratory catchment data. Hydrological Processes 13, 89-100.
Kemper, W.D., Rosenau, R.C., 1986. Aggregate stability and size distribution. In: A. Klute (Ed.), Methods of Soil Analysis, Part 1. American Society of Agronomy and Soil Science Society of America, Madison, Wisconsin, Agronomy Monograph 9, pp. 425-442.
Le Bissonnais, Y., 1996. Aggregate stability and assessment of soil crustability and erodibility: I. Theory and methodology. European Journal of Soil Science 47, 425-437.
Le Bissonnais, Y., Le Souder, C., 1995. Mesurer la stabilité structurale des sols pour évaluer leur sensibilité à la battance et à l’érosion. Etude et Gestion des Sols 2, 43-56.
Le Bissonnais, Y., Arrouays, D., 1997. Aggregate stability and assessment of soil crustability and erodibility: II. Application to humic loamy soils with various organic carbon contents. European Journal of Soil Science 48, 39-48.
Loch, R.J., Foley, J.L., 1994. Measurement of aggregate breakdown under rain: comparison with tests of water stability and relationships with field measurements of infiltration. Australian Journal of Soil Research 32, 701-720.
Luk, S., 1977. Rainfall erosion of some Alberta soils; a laboratory simulation study. Catena 3, 295-309.
Martínez-Mena, M., Albaladejo, J., Castillo, V.M., 1998. Factors influencing surface runoff generation in a Mediterranean semi-arid environment: Chicamo watershed, SE Spain. Hydrological Processes 12, 741-754.
Morin, J., Van Winkel, J., 1996. The effect of raindrop impact and sheet erosion in infiltration rate and crust formation. Soil Science Society of America Journal 60, 1223-1227.
Mutchler, C.K., Murphree, C.E., McGregor, K.C., 1988. Laboratory and field plots for soil erosion studies. In: Lal, R. (Ed.), Soil Erosion Research Methods. Soil and Water Conservation Society, Ankeny, Iowa, pp. 9-36.
Poesen, J.W.A., 1992. Mechanisms of overland-flow generation and sediment production on loamy and sandy soils with and without rock fragments. In: Parsons, A.J., Abrahams, A.D. (Eds.), Overland Flow Hydraulics and Erosion Mechanics. UCL Press, London, pp. 275-305.
Quantin, P., Combeau, A., 1962. Relation entre érosion et stabilité structurale du sol. Comptes Rendus de l’Académie des Sciences 254, 1855-1857.
Reichert, J.M., Norton, L.D., 1994. Aggregate stability and rain-impacted sheet erosion of air-dried and prewetted clayey surface soils under intense rain. Soil Science 158, 159-169.
Roose, E., 1996. Land husbandry: components and strategy. FAO Soils Bulletin 70, 370 pp.
Roth, C.H., Vieira, M.J., Derpsch, R., Meyer, B., Frede, H.G., 1987. Infiltrability of an Oxisol in Parana, Brazil, as influenced by different crop rotations. Journal of Agronomy and Crop Science 159, 186-191.
Shainberg, I., Levy, G.J., Levin, J., Goldstein, D., 1997. Aggregate size and seal properties. Soil Science 162, 470-478.
Shinjo, H., Fujita, H., Gintzbuger, G., Kosaki, T., 2000. Impact of grazing and tillage on water erosion in northeastern Syria. Soil Science and Plant Nutrition 46, 151-162.
Sutherland, R.A., 1996. Caesium-137 soil sampling and inventory variability in reference locations: a literature survey. Hydrological Processes 10, 43-53.
Tanaka, U., Yokoi, Y., Kosaki, T., Kyuma, K., 1999. Mechanisms and processes of crust formation on artificial aggregates. III. Relations between natural rainfall characteristics and degree of crusting. Soil Science and Plant Nutrition 45, 537-549.
Valentin, C., Janeau, J.L., 1989. Les risques de dégradation de la surface des sols en savane humide (Côte d’Ivoire). Cahiers ORSTOM, série Pédologie 25, 41-52.
Van Dijk, P.M., Kwaad, F.J.P.M., 1996. Runoff generation and soil erosion in small agricultural catchments with loess-derived soils. Hydrological Processes 10, 1049-1059.
Van Dijk, P.M., Van der Zijp, M., Kwaad, F.J.P.M., 1996. Soil erodibility parameters under various cropping systems of maize. Hydrological Processes 10, 1061-1067.
Wischmeier, W.H., Smith, D.D., 1978. Predicting rainfall erosion losses. A guide to erosion planning. United States Department of Agriculture, Agriculture Handbook 537, 58 pp.
Zhang, X.C., Nearing, M.A., Miller, W.P., Norton, L.D., West, L.T., 1998. Modeling interrill sediment delivery. Soil Science Society of America Journal 62, 438-444.