HAL Id: hal-01967424
https://hal.archives-ouvertes.fr/hal-01967424
Submitted on 31 Dec 2018HAL is a multi-disciplinary open access archive for the deposit and dissemination of sci-entific research documents, whether they are pub-lished or not. The documents may come from teaching and research institutions in France or abroad, or from public or private research centers.
L’archive ouverte pluridisciplinaire HAL, est destinée au dépôt et à la diffusion de documents scientifiques de niveau recherche, publiés ou non, émanant des établissements d’enseignement et de recherche français ou étrangers, des laboratoires publics ou privés.
Diffuse Urbanization and Mega-Urban Regions in India:
Between Reluctant and Restrictive Urbanism?
Elfie Swerts, Eric Denis, Partha Mukhopadhyay
To cite this version:
Elfie Swerts, Eric Denis, Partha Mukhopadhyay. Diffuse Urbanization and Mega-Urban Regions in India: Between Reluctant and Restrictive Urbanism?. Denise Pumain; Céline Rozenblat; Elkin Velasquez. International and Transnational Perspectives on Urban Systems, Springer, pp.237-262, 2018, Advances in Geographical and Environmental Sciences, 978-981-10-7798-2. �10.1007/978-981-10-7799-9_11�. �hal-01967424�
In International and Transnational Perspectives on Urban Systems (Pumain, Rozenblat &Velasquez eds.), Springer, pp. 237-262
https://link.springer.com/chapter/10.1007/978-981-10-7799-9_11
Diffuse Urbanization and Mega-Urban Regions in
India: Between Reluctant and Restrictive
Urbanism?
Elfie Swerts, Eric Denis, Partha Mukhopadhyay IntroductionIndian has a gigantic urban population. In 2011, its 377 million urban citizen are far more than all the inhabitants of North America (Canada and USA). One of ten urbanites in the world is Indian. Each year, the increment to the urban population is like a large megacity. Developing the proper urban infrastructures to accommodate such population and make the Indian cities contribute as they should to the economic growth constitutes a tremendous challenge.
Paradoxically, India is still predominantly a rural country characterised by a low rate of urbanisation which reached 31.2% in 2011 only. In this context, India is home to among the biggest metropolises of the World. Delhi, Mumbai and Kolkata count around 15 to 20 million inhabitants each. However, the coexistence of very gigantic megalopolises and a rural environment does not appear like an Indian specificity, but mostly as a characteristic of Asian urbanization, that “continues to be a minority urban society in a predominantly rural sub-continent and which will remain so in the medium term, but which produces giant cities at the rank of global mega-cities” (Dupont, 2008). The limits and definition of the urban are questioned by this type of configuration.
The second paradox is that the Indian urbanisation rate is low even though it is a world region which has been among the first in the human history to be structured by a network of cities, since 2500 years BC. From this ancient history has emerged a tradition of urban administration and an urban culture rather than a city site continuity; many ancient urbanized locations are not the current foundation of existing cities, while many, like Patna, near ancient Pataliputra remain so. Of this long urban history results also a complex and diverse urban architecture, inherited of the succession of kingdoms and urban civilizations, followed during the 18th to 20th century by political and territorial restructuring associated with British colonialism, which also created major cities of today like Kolkata, Mumbai, Chennai Bengaluru and Delhi, of which only the site of Delhi had a substantial prior history. Since the partition and reunification of India starting from Independence in 1947, there have been some major re-organisation of State
boundaries, leading to the current political arrangement into 29 States and 7 union territories of modern India, relatively autonomous in political and cultural terms. Structurally, since 1971, the residential migrations from rural areas to urban localities, as measured in the census have moderate - they have never contributed more than one-fourth of the urban growth. India today shares characteristics of very recently urbanized regions with new towns burgeoning and fast expanding metropolis. A large share of the urban growth is due to population growth in the cities and the formation of new urban areas, usually by reclassification and/or merger of existing villages.
Table 1 : Population Growth by Size Class of Urban Areas
Gross Increase Adjusted for Reclassification 1971-81 1981-91 1991-2001 2001-11 1971-81 1981-91 1991-2001 Cities 4.4 3.7 3.5 2.7 3.7 3.2 2.9 Metropolitan Cities 4.2 4.9 4.2 3.5 2.8 3.8 2.9 Class IA 5.5 4.3 4.8 3.3 2.7 3.4 2.8 Class IB 2.7 5.7 3.5 3.8 3.4 4 3.1 Class IC 4.5 2.6 2.6 1.7 4.2 3.1 3.3 Towns 2.7 2.4 1.5 1.6 3.4 3.2 2.3 Class II 4.1 2.8 1.6 1.6 4.8 3.7 2.5 Class III 2.4 3 1.9 1.6 2.7 3.4 2.3 Others 1.9 1.3 1 1.6 2.3 2.4 2.2 Memo: Urban Population 3.9 3.2 2.8 2.4 Rural Population 1.8 1.8 1.7 1.2 Total Population 2.2 2.1 2 1.5
Note: Class IA is more than 5 million, IB between 1 and 5 million, IC is between 100,000 and 1 million, Class II towns are between 50,000 to 100,000, Class III, 20,000 to 50,000 In this context, the Indian system of cities questions the trends currently associated to the urban transition, in particular in term of hierarchical and spatial repartition of population and economic growth among the urban localities. The goal of this chapter is to assess how the urban transition impact the demographic and economic evolution of the Indian urban System.
In order to be able to describe the Indian system of cities and analysis its expansion, the first part discusses the methodology we used to harmonize our diachronic city series whatever have been the changes in definition, recognition and delineation of localities or group of localities as urban since 50 years. Then, in a second part, we characterise the trends. We bring out the change in the distribution of the urban population regarding the size of the cities and their
location. The third part aims at linking the demographic growth of the system of cities with the economic transition that occurred during this period, including the economic liberalisation, the opening to the global flow of capital and production and the boom of the services’ sector. The final section discusses some of the recent policy interventions of the Government of India that have implications for urban growth.
1. The Indian urbanisation: cities and system of cities
1.1 The Indian cities’ diversity of categories, rules and governance, and its impact on the measurement of urbanization
In India, the way the urban sector is defined has a deep impact on cities economic, social and demographic development; it determines the way a locality is governed. There are two categories of urban area: the Statutory Towns and Census Towns1.
Statutory towns are cities administratively designated as such by the State (provincial government) based on rules and thresholds, which differ from one State to another and which can sometimes be quite flexible and non-transparent (Table 2). The point to be noted is that these statutory criteria are all relatively more stringent than the definition of urban used for the Census of India, conducted by the Registrar General, discussed below.
Table 2: The various rules and thresholds by State for a locality to be recognised as Statutory Towns
1 The Indian cities’ population has been counted since 1881. Between 1881 and 1961, cities have first been defined
as localities of at least 5,000 inhabitants, with urban characteristics, which are defined as a juxtaposition of houses that must be separated only by streets, even if these localities were not managed by a municipal government (Bose, 1964 and 1970; Véron, 1987; Bhagat, 2002). But such a definition of the “urban localities” generated difficulties, mainly because it left too much latitude for interpretation to State Census superintendents regarding the designation of the urban entities (Bhagat, 2005). As a consequence, the cities’ definition criteria were standardized for whole India in 1961 with the establishment of the Statutory Town and Census Town categories (Sivaramakrishnan et al., 2007).
There are different types of statutory towns; mainly the Municipal Corporations, the Municipalities and the Town Panchayats, but these categories, which differ in their functions and budgets, regarding their size in particular, are dependent on State level decisions and definitions. Then, town Panchayats which are considered a local unit of transition between the Rural and Urban Local Bodies (ULB) (Shaw, 2005) are not always managed by the same administrative department in the State as the Statutory Towns. In the case Tamil Nadu, they are under the Directorate of Town Panchayats when the rest of the ULB are under the Commissionerate of Municipal Administration. Moreover, in some States, like West Bengal, the Town Panchayat category does not exist (Samanta, 2014).
There are different types of Statutory Towns; mainly the Municipal Corporations, the Municipalities and the Town Panchayats, but these categories, which differ in their functions and budgets, regarding their size in particular, are dependent on State level decisions and definitions. Then, town Panchayats which are considered a local unit of transition between the Rural and Urban Local Bodies (ULB) (Shaw, 2005) are not always managed by the same administrative department in the State as the Statutory Towns. In the case Tamil Nadu, they are under the Directorate of Town Panchayats when the rest of the ULB are under the Commissionerate of Municipal Administration. Moreover, in some States, like West Bengal, the Town Panchayat category does not exist (Samanta, 2014).
The second type of urban area is a Census Town, whose recognition is based on statistical specifications identical for all India. A locality is classified as a Census town when it crosses three criteria: a) a threshold population of 5,000 inhabitants; b) a density higher than 400 inhabitants per square kilometre and c) a proportion of more than 75% male workforce engaged
in non-agricultural activities2 (Census of India, Administrative Division, 2011). Statutory Towns have an urban status, whereas Census Towns are ““urban” by definition, but “rural”
in governance” (Census 2011). Census Towns remain administered and managed by rural
governments, despite their “urban” economic and demographic characteristics (Census 2011). In the ongoing urban and economic transition context, these complex modalities of the city governance have a deep impact on the sustainability of the Indian cities’ growth, and accentuate the regional disparities. It leads to a diversity of urban status. It leaves also apart an important share of “denied urbanization” (Denis and al., 2012; Samanta, 2014; p. 1), -- i.e. the Census Towns plus large villages not recognised as urban -- leading to an accentuated lack of infrastructure, basic services, and more generally of financial resources. This deficient frame calls for a more inclusive urban framework and more distributed skills and means devoted to the urban management (Kuruvilla, 2014; Samanta, 2014).
From a statistical point of view, the designation of Statutory Towns and Census Towns poses several problems of harmonisation. For Statutory towns the interState variability is accentuated by the regional political interests and relations between local and regional powers that determine the urban classification. The ULB list is strongly influenced by the State government's decisions, local requests and oppositions to reclassification. This is particularly the case for the entry of the rural localities in transition into the administrative urban frame, but also to expand the boundaries of the large urban areas, either through their recognition as urban local bodies belonging to census defined Urban Agglomeration or through their inclusion partly or totally as Urban Outgrowth of existing Statutory or Census towns (Sivaramakrishnan et al., 2007; Ramachandran, 2010; Denis et al., 2012; Pradhan, 2012).
More specifically, for Census Towns, the designation criteria are based on the data collected during the previous census, which was held ten years prior to their designation (Denis et al., 2012; Chandramouli, 2013). This led to a decadal underestimation of small towns, which can be locally accentuated by the downgrade back to the rank of villages of a substantial number of small towns from one census to the next (Denis et al., 2012).
We try to analyse Indian urbanization by avoiding all these inter-State and temporal comparative bias. In that perspective, our work is based on a harmonized database called IndiaCities.
1.2 IndiaCities: a harmonized database to analyze the Indian urbanization
The IndiaCities database is derived from the Indiapolis3 which has been build upon a definition of cities as morphological agglomerations larger than 10,000 inhabitants (Moriconi-Ebrard, 1993; Denis and Marius-Gnanou, 2011). The construction of Indiapolis is based on the following methodology (Figure 1; Swerts 2016):
1) In a first step, the contiguous urban built up area separated by less than 200 meters is delineated using Google Earth images from the year 2000 with a resolution of 7.000
2 The classification is done prior to the Census since the urban and rural schedules are different. This is done on
the basis of information in the prior Census. For details, see L http://censusindia.gov.in/2011-Circulars/Circulars/11-31-10-Circular-02.doc (Accessed on 10 January 2016).
feet (corresponding to 2.134 m). This perimeter is georeferenced and integrated into a Geographic Information System (GIS);
2) then, in second step, the population data of the Indian localities (all towns and villages), from the official censuses of 1961, 1981, 1991, 2001 and 2011 are geo-referenced and integrated into the same GIS, and associated with the perimeter of the contiguous urban built up area.
3) Finally, in a third step, retropolation is applied to the population figures back to 1961, within a constant area based on the morphological agglomerate delineated in 2000; To construct the IndiaCities database from Indiapolis, two other steps have been added:
4) To calculate the population data according to an expanding area of the agglomerate from 1961 to 1991, the towns and villages within the perimeter of the 2000 morphological agglomeration are excluded at the dates of one or more of the 4 censuses between 1961 and 1991, if their growth rate is lower than the State average, and if they are located beyond a radius of 20 km from the centre of the agglomeration for the smaller towns (below 50,000 inhabitants), 40 km for towns with a population of 50,000 to 500,000, 60 km for the towns with a population of 500,000 to 3 mn. and 100 km for the largest.
5) At the fifth and final step, the morphological agglomerations where male4 workers are mostly engaged in agricultural activities in 2011 have been removed. For that step, the statistics about the distribution of male and female employees in the three sectors of activities given by the Census - agricultural labourers and cultivators, household industry and a category “other” that includes secondary and tertiary activities - have been linked to each morphological agglomeration. To avoid determining a priori a threshold of the proportion of men engaged in agricultural activities, in the process of identifying the “agricultural morphological agglomerations”, a Hierarchical Clustering method is applied to the entire male workforce. It provides a typology of the morphological agglomerations according to their socio-economic profiles. Four classes have been revealed according to the grouping of the male workers over the different sectors of activities. Among these classes, a group composed of 1,244 agglomerations specialized in agricultural activities (80% of male workers are engaged in agricultural activities) have been excluded.
According to the IndiaCities database, India counts 5,857 cities larger than 10,000 inhabitants in 2011. Fifty of them count over one million people - and among them three cities larger than 10 million inhabitants, whereas 90% count between 10,000 and 100,000 inhabitants (Table 3).
Table 3 : Number of Indian urban agglomerations by size class in 1961 and 2011
4 Only the male workers have been considered in order to avoid the significant undercounting of women and their
irregular counting from State to State (Jose, 1989; Mazumdar and Neetha 2011; Thomas, 2012; Ghani et al., 2013). It tends to reinforce the imbalances already observed between States (Vaidyanathan, 1986; Duvvury, 1989; Bhagat, 2005; Behera and Behera, 2013).
1961 2011
Greater than 10 million 0 3
1 - 10 million 14 47
100,000 - 1 million 155 469
10,000 - 100,000 1,918 5,338
All cities > 10,000 2,087 5,857
Source : IndiaCities
1.3. Structure and Dynamic of the Indian system
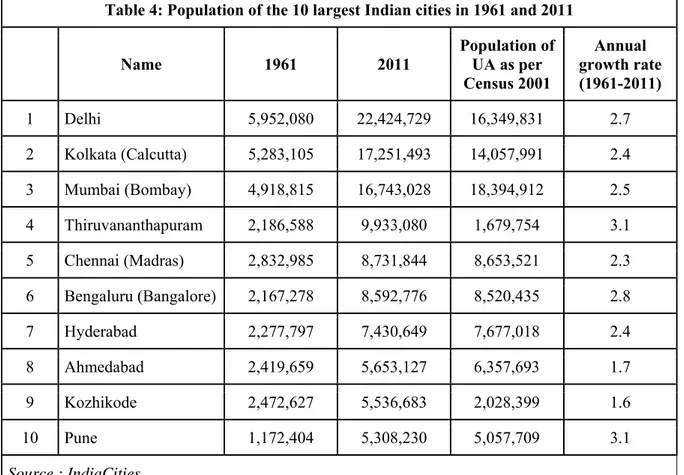
As in other Asian countries like China, India is characterized by the coexistence of very large cities and a dense net of small towns. Indeed, India hosts three cities that are among the biggest in the world in 2010: Delhi was ranking 6th, when Kolkata and Mumbai were respectively 12th and 13th, then came Chennai 38th and Bengaluru 39th (Swerts and Denis, 2015). These three giant cities greatly exceeded 15 million inhabitants in 2011: Delhi (22.4 million), Kolkata (17.2 millions) and Mumbai (16.7 millions). Following at the top of the Indian urban hierarchy, with some 8 million inhabitants each, were are the capitals of the most urbanised and rich States: Chennai, Bangalore, Hyderabad, Ahmedabad and Thiruvananthapuram. Following them are Kozhikode, Pune and Surat, with around 5 million people (table 4). Note that the official census figures differ significantly in Kerala’s cities (Thiruvananthapuram and Kozhikode) because of the connected nature of Kerala’s settlements, which includes many more settlements in the IndiaCities agglomeration than in the Census definition. The size of these cities is commensurate with the overall size of the country. It is also related to the long urban Indian history. These large capitals and the secondary metropolitan cities are often medieval cities, such as Hyderabad, Delhi or Ahmedabad. Kolkata was conceived as the capital of the Eastern Company and was among the largest global cities till mid-20th century, followed by Mumbai and Chennai two other main entry points for the colonial power and their extraction interests (Durand-Dastès, 2003). During the colonial era, with the rapid progress of the railway grid (15,500 km in 1880), the network of cities consolidated inland as well, including new centres such as Bangaluru. Since its designation as the political capital of the Indian Empire in 1911 and the Indian Union in 1947, Delhi has progressively overtaken Kolkata and Mumbai to become the largest metropolis in 1981.
Overall, 40% of the urban population live in the largest cities, with more than one million people. One the other hand, 34% live in the 5,338 towns that count between 100,000 and 10,000 people - and 26% in medium size cities, between 1 mn. and 100,000 inhabitants.
The disproportionate size of the three major Indian cities, Delhi, Kolkata and Mumbai, confers a characteristic shape to the rank size curve, with a break appearing in the upper portion (Figure 1). On the other hand, the significant weight of small towns, which is constant from 1961 to
2011, is evident the slope of the curve (0.94 in 2011). It underlines the weak differentiation between cities of different sizes. This less strong hierarchical differentiation is a characteristic shared by other world regions where a very long urban history occured, like China (rank size slope of 0.90) and Europe (0.96).
Table 4: Population of the 10 largest Indian cities in 1961 and 2011
Name 1961 2011 Population of UA as per Census 2001 Annual growth rate (1961-2011) 1 Delhi 5,952,080 22,424,729 16,349,831 2.7 2 Kolkata (Calcutta) 5,283,105 17,251,493 14,057,991 2.4 3 Mumbai (Bombay) 4,918,815 16,743,028 18,394,912 2.5 4 Thiruvananthapuram 2,186,588 9,933,080 1,679,754 3.1 5 Chennai (Madras) 2,832,985 8,731,844 8,653,521 2.3 6 Bengaluru (Bangalore) 2,167,278 8,592,776 8,520,435 2.8 7 Hyderabad 2,277,797 7,430,649 7,677,018 2.4 8 Ahmedabad 2,419,659 5,653,127 6,357,693 1.7 9 Kozhikode 2,472,627 5,536,683 2,028,399 1.6 10 Pune 1,172,404 5,308,230 5,057,709 3.1 Source : IndiaCities
The long urban history contributes to explain the narrow spacing of small towns: the time period of emergence of urbanization strongly influences the spatial and hierarchical distribution of cities, because of the dependency between the spacing of cities and the development of transportation speeds. As Indian cities have emerged before the railways and transport revolution, Indian small towns are historically numerous (Moriconi-Ebrard, 1993; Bretagnolle et al, 2007). The important number of small towns in India is the result of the historical urban path, as well as of the current balance of the urban population growth between Indian cities and the huge rural population and hinterland (Durand-Dastès, 1995; Denis, Marius-Gnanou, 2011; Swerts and Pumain, 2013). As almost 70% of the Indian population remain rural, small towns constitute the unavoidable central places that provide goods and services to the rural population. They expand along with the rural economic transition.
2. Cities demographic evolution and migrations
The degree of inequality between city sizes in the Indian system of cities is quite stable from 1961 (slope of the rank-size curve = 0.92) to 2011 (0.94), highlighting that the hierarchization
process has been weak since fifty years. This is explained by a stationary annual growth rate of the Indian cities according to their size from 1961 to 2011.
The shape of the rank-size curve is very regular and did not change during this period. This high stability of the rank-size curve is explained by the distributed growth among the Indian cities: in accordance with the model of Gibrat, the city growth rate is not correlated to their size and their former growth rate (Gibrat, 1931; Pumain, 1982).
Figure 1: Rank Size curve of Indian cities, 1961-2011
2. 1 Metropolis and small towns: similar trends of growth
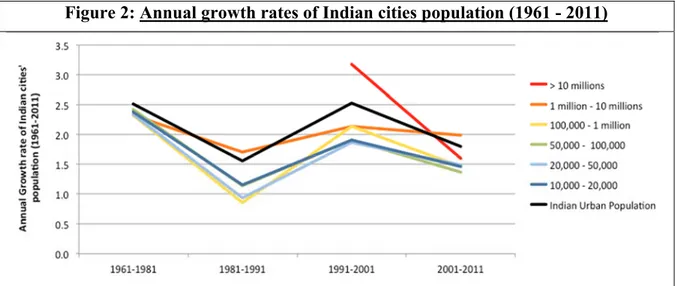
When Indian cities are grouped in size classes, the differences regarding the average annual growth rate are not significant, underlying that the cities growth is independent of their size. However, since 1981, the million plus cities grew slightly faster than the others, in particular during the period 1981-1991 and 2001-2011 for the cities that count between 1 million and 10 millions of inhabitants and for the 3 cities of more than 10 millions of inhabitants, during the 1991-2001 decade only (Figure 2).
The average annual growth rate by cities size class has been calculated using mobile classes, with changes in the number of units at each census. Tests based on several thresholds of categories of size have highlighted very similar results5, and we retain class limits that are the closest to the official ones in the census.
5 When fixed city group based on cities’ initial size are used, trends observed with mobile classes are the same,
Figure 2: Annual growth rates of Indian cities population (1961 - 2011)
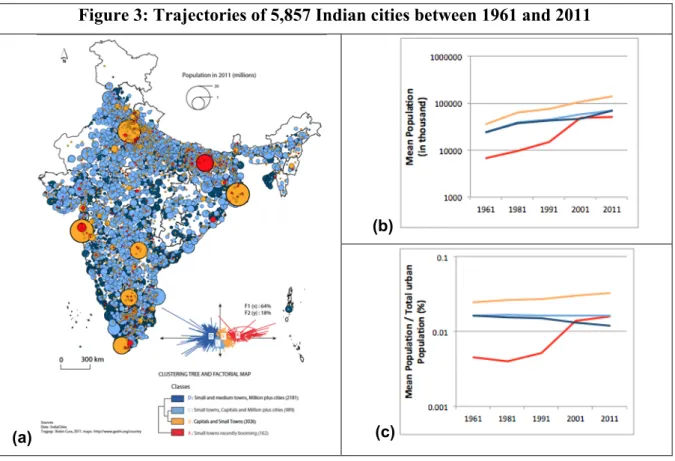
Comparing the demographic trajectories of Indian cities from 1961 to 2011 thus exhibits only slight differences between the growth rates of small and large towns (figure 3). It confirms that the size of cities is not related to their demographic evolution.
Using an Ascending Hierarchical Clustering method, the cities with a similar evolution profile have been classified according to the population growth trajectories of the 5,857 cities larger than 10,000 in 2011 from 1961 to 2011. Indian cities demographic courses are not that much differentiated, since 80% of the cities are grouped into two classes: 38% have a relative weight declining compared to the other Indian cities (class D in dark blue), and 42% maintain their population share in the system (class C in light blue).
The weight of the other 20% of cities has increased in the system: the weight of 17% of the cities have relatively increased regularly all along the period (Class B in Yellow) while the weight of 3% of booming cities has strongly surged, particularly between 1991 and 2001 (Class A in red). These booming cities have a demographic annual growth rate of 4.9% between 1961 and 2011, whereas the Indian average is of 2.1% on the same period.
The mapping of the Indian cities trajectories reveals that there are no clear trends of regionalization of the city trajectories. All types of trajectories are dispersed all over the subcontinent. However, cities with the slowest demographic ascending evolution are mostly located in States that have achieved their demographic transition, like Kerala. On the other hand, even if the most dynamic towns are well distributed all around India6, they are overrepresented in the Indo-Gangetic valley and the Tamil Nadu State (South India). This last point underlines that in India, the cities’ growth is not mechanically related to the demographic growth of the region in which they are located. Thus, the demographic growth rate is very high in the Indo-Gangetic valley, that has a low level of urbanisation, but very slow in the Tamil-Nadu, which has achieved its demographic transition. Classes of cities whose share in urban population is maintaining or declining include cities of all size, small towns and million plus
6 Pradhan (2013) calculated for the 2,489 new Census towns recognised in 2011, that 37% only were located near
cities with more than 100,000 inhabitants (10 km maximum of cities between 100,000 and 500,000 inhabitants, 15 km for cities between 500,000 and 1 million, 20 km for cities between 1 to 4 million and 25 km for cities over 4 million).
cities: 46% of the million plus cities has maintained their weight in the system and the weight of 20% of the million plus cities has declined.
Figure 3: Trajectories of 5,857 Indian cities between 1961 and 2011
(a)
(b)
(c)
The most dynamic cities are predominantly the largest States capitals (Kolkata, Mumbai, Bangalore, Hyderabad, Thiruvananthapuram, Patna, and the Federal capital Delhi), but also small towns that count less than 100,000 inhabitants. In particular, the booming cities’ profile (Class A) is almost entirely composed of small towns. Indeed, 98% of the booming cities counted less than 100,000 inhabitants in 1961. Six percent of these small towns became in 2011 medium size cities (between 100,000 and 1 million inhabitants). This last point underlines that small towns are actively involved in the urban transition: overall, 20% of the small towns experiment an ascending trajectory between 1961 and 2011, of which 3% are booming towns. The fact that most of the cities maintain their size in the system or are slightly declining is indicates that rural-urban migration and natural growth do not differ systematically by size class and region, though specific cities would have different patterns.
2.2 The migrations and the components of urban growth
Residential migrations within rural environment continue, by far, to be the most important migration flow. Consistently since 1981, internal migrants have mostly moved on very short distance, within their own district (62.6% in 2001), from village to village, then between districts of the same State for 24.1% and 13.3% only have experimented long distance migration to another State. Short distance migrations are rural to rural at 75%, mainly for marriage reasons among women.
Rural to urban residential migrations are also extremely stable since 1981, at 17% of the total annual flow and also dominated by short distance changes of residence; at 82.5% within the State in 2007 (National Sample Survey 2010). Nevertheless, in absolute terms, net rural to urban migrations are increasing and contribute to put pressure on the city infrastructures: they have hiked from 5.6 million newcomers during the 1981 to 1991 decade to about 20 million in the following decade - an equivalent of Delhi every ten year.
Figure 4: Sources of Increase in Urban Population (% share)
Sources: Census of India series (1961 to 2001) and Pradhan estimation (2013) for 2001-2011 * Figures in the bars are in million (increase per decade).
The inter-State flow is from the poorest States and the less urbanised, like Bihar and Uttar Pradesh, toward the richest and the most urbanised States, like Maharashtra and Delhi (Chandrasekhar, et. al., 2014). The growth rate of the largest cities where the fertility rate has tremendously fallen and population is ageing is compensated by the flow of migrants and their perimeter expansions also. If in 2001, 35% of the urban citizens were time-life migrants (32% in 1981), they were 43% in Mumbai and Delhi, but only 28% in Kolkata which has also an extremely low Total Fertility Rate, at 1.2. It explains that the core of Kolkata metropolis is losing population since two decades. Chennai and Mumbai come close second with flat TFRs at 1.4, followed by Hyderabad (1.6), Bengaluru (1.7) and Delhi (2.2).
Hence, the urban increase is dominated by the natural growth. It contributed for almost 65% during the 1961 to 1971 decade and 44% during the 2001 to 2011 one (Figure 4). The decline is explained by a fastest demographic transition in urban environment: the urban TFR has fallen to 1.8; below the national average (2.5). Rural to urban residential migrations are not
64,6 51,7 62,7 59,2 44,0 18,7 19,9 22,6 21,1 22,2 2,9 11,9 2,1 9,9 4,3 13,8 16,6 12,6 9,7 29,5 0 10 20 30 40 50 60 70 80 90 100 1961-71 1971-1981 1981-91 1991-2001 2001-11
Natural Increase Net Rural Urban Migration
compensating this fall. All over the period, they remained in the same range: contributing to 18.7% of the urban growth during the 1970’ decade and 22.2% in 2011, stable since 1991. The expansion of the urban units adds its share, as well the recognition of emerging towns (registering the transition of villages in towns). In other words, during the last census decade, 87.8% of the urban growth has been in situ (natural growth plus urban conversion and extension: without involving residential mobility). It was counting for 81.3% in the 1970’. In average, migrations towards cities have not accelerated with the economic liberalization or the booming GDP growth driven mainly by the service sector expansion.
Circular migrations articulate also the rural and urban environments. It has been estimated using National Sample Survey datasets that a bulk of 32 million of rural residents is working in town or 4.3% of the rural population. They compose 13% of the rural non-agricultural workforce (Chandrasekhar, 2011). If we add the 15.4 million of urban residents (5.5%) commuting daily to work in rural localities the dimension of the rural peripheries or peri-urban context of cities is approximated.
Beside the permanent and circular migrations, seasonal migrations are also contributing to interconnect village inhabitants with the system of cities. Those workers of the primary sector are coming temporarily to work in towns, notably in the construction sector (35.9%). In 2010, they were 12.5 million to move from their villages to towns for less than 6 months in a year and one million from cities to cities. They are not accounted among the residents of the urban place they come to work.
The structurally low level of rural to urban residential migration explains that the urban rate of India is still the lowest among the ten largest world’s economy. Migration flows are not supporting any large metropolis bias or primacy within the system of cities but only partly compensating their negative differential in natural growth. The most urbanised State are also those who have the lowest natural growth. Pull factors seem not in place to attract massively the rural population toward cities. It is rather, for a large part, the villages that becomes towns through their economic transformation and administrative reclassification that contribute to the diffused urbanisation process which characterises India. Such pattern invites to inquiry more precisely the link between economy and urbanization, notably in term of wealth generation and job creation.
3. Cities, Economic Changes and Employment: Engines of growth and places coping with an uncertain transition
In order to make sense of the specificities of the Indian trajectory of urbanization, they have to be linked to the economic transition the country has experienced since the 1960s. The Indian transition is specific and is led by the tertiary sectors, when the industry share remained relatively constant and the agricultural sector fell: agriculture generated 52% of the GDP in 1950 and 18.1% of net value added in 2013-14, secondary sector is stable during the period at around 30% and services surged to 53.2% in 2013-14. The place of manufacturing is radically different from China where it stands àt 44% giving a radically different dynamic of
urbanization and residential migration contribution to the urban growth. However, in China too, there has been rapid growth of services, which has grown from a much smaller share. The local distribution of the fast growing Indian GDP (9% per year between 2003 and 2007, 6% in average since then), the way it is polarised by cities over time, globally and by sectors, clarifies the nature of metropolitanization that the Indian system cities is experiencing. The dynamic of employment helps to understand the function of the numerous small towns in the economic transition.
3.1 Which urban polarization of the GDP?
We do not observe a strong trend of metropolitanization of the Indian growth machine: in 2000, 113 districts7 against 91 in 2005 generated 50% of the total GDP (at constant price 2000) . For the non-farm GDP, the number of districts remained identical at 77. They were mainly metropolitan and adjacent districts but not only; we must also take into account the mining centred districts and those boosted by their successful cluster economy. The average rate of urbanization for these 77 districts is 55.1%, very close to the 91 districts cited above, where the urbanization rate is established at 54.9%. Transition and economic growth are not polarised in a simple manner by the most urbanised districts: very rich agricultural districts are still prominent, notably those of the Krishnagiri/Godavari or the Kaveri deltas, or like the district of Burdwan (Samanta, 2014). Many other predominantly rural districts in Punjab, Maharashtra or Kerala are among the richest. In these districts, agricultural capital drives a rapid transformation of the economy toward services and industries, where small towns are playing a major role in, often, extremely dense context like deltas and other irrigated agricultural environments.
The share of the GDP generated by the biggest cities can be approximated considering the weight of the districts where the 50 largest metropolitan areas having more than one million inhabitants are located. In 2005, those districts concentrate 35.7% of the total value added in India and 41% of non-agricultural value. The share of those metropolitan areas increased by 27.6% between 2000 and 2005 when, for the whole India, the growth was of 25.6%. The metropolitanization, again, appears as a slow process: 1 point more in 5 years only. The 3 giant metropolitan regions, Delhi, Kolkata and Mumbai, are also not polarizing faster the Indian productive capacities; rising only from 17.7 to 18.2% of the non-agricultural GDP in five years. With 8.1% of the whole population of India in 2005, it gives a Mega Urban Region over-productivity index of 2.3. For the Million-plus cities, this index stands at 2.1.
Noticeable sectorial differences have to be highlighted. The banking sector registers the highest level of concentration; 54,6% in Million-plus cities and 34.1% within the three largest metropolis, but it is also marginally declining (0.5 in 5 years), sign of a possible diffusion of the banking services and of an extended financialization of the Indian economy. Real eState experiments the largest sectorial growth (+32.5% in 5 years). It coincides with the highest process of concentration: from 38.4% to 46.8% in Million-plus cities, and 14.6 to 20.2 in the Big Three, where the realty sector has become an essential driver of growth, morphological expansion and transformation. This configuration is naturally linked with the fast growing
sector of the construction (+33.3% in 5 years) which exposes a sensitive bias in favour of the million-plus cities. In contrary, the transport sector is expanding outside of the big fifty; its share dropped from 44.3 to 41.7%.
In 2005, the value added by the industries was still highly concentrated by the Million-plus top of the urban hierarchy without any tangible sign of dispersion: 30.9 in 2000 and 32.8 in 2005 (11.9 and 12.8 in the Big Three). As the industrial employment tends in the same time to disperse (Ghani et al., 2012), it shows that the industry within the metropolitan areas are moving up the chain of value and continue to gain in productivity and value added.
Subnational configurations matter in the way regional capitals are dominating the economy of the State they belong to. For instance, Chennai with the same level of population than Bangalore is concentrating less regional value than Bangalore: 19.0% vs. 38.6% in 2005. The differential in concentration level is coupled with an unequal process of metropolitanization: in Tamil Nadu, the capital have the very same share of GDP since 2000, when in Karnataka, Bangalore gained 5.2 points in 5 years. Since then, some regional redistribution has occurred (minus 3 points for Bangalore in 2011). Hence, while there is no significant index of regional over-productivity for Chennai (1.06), for Bangalore vis-à-vis Karnataka, it reaches 2.2. Only in 2011, Chennai could have eventually polarized 1 point more than in 20058. Greater Mumbai was polarizing 34.6% of Maharashtra’s GDP in 2011 and Greater Kolkata 30.6% of West Bengal in 2005.
Interestingly, in Tamil Nadu, the extended urban form stretching from Bangalore to Salem and integrating Tirupur and Erode highly productive environments along the National Highway 45 is concentrating a share of regional GDP equivalent to Chennai metropolitan region (3 districts) and host a comparable concentration of population. Tirupur is today the pre-eminent textile cluster for India's cotton knitwear export (44% of the total in 2015), when Coimbatore is home to an extremely dense tissue of intermediary, automotive and IT industries. Within this emerging pluricentric desakota, leading innovative industrial clusters are also located in smaller towns, like Tiruchengode (100,000 people). This combination of small towns and urban agglomerations on the edge of 1 million citizens, in functional extended urban regions connected to the world economy is reconfiguring the Indian system of cities. These new configurations have started to blur the urban units we delineated and use in order to qualify the urban hierarchy. The emergence of such extended pluricentric urban regions indicates that the urban will increasingly have a unique and complex face combining the intra and the interurban configurations, notably in the context of the densest regions of Asia. Several Mega Urban Regions (MUR) are materializing; notably, all along the coast of Kerala combining some 18 million people and on both sides of the Ganga river banks through Uttar Pradesh and Bihar. These regional assemblages of villages, towns and cities shouldn’t be seen as a unique and coordinated urban environment; they are depending of multiple forms of governments and their components have their own economic agencies, capital, skills and capabilities to join global chains of values. While federal schemes aim to promote urban and industrial corridors, but they are not necessarily merging the most obvious MUR. They rather open up new land
opportunities for industries, real eState and FDI such as between Bangalore and Chennai or Delhi and Mumbai.
3.2 The employment differentiations within the urban landscape
Despite the rapid fall of the farm sector in the GDP, the destruction of jobs in agriculture has only recently begun to fall and now it count for lesser than half of the workforce (48.9% in 2011-129). This disjunction of trends is congruent with the low contribution of residential migration toward cities and with the fact that nearly 70% of the Indian population lives in rural areas. In fact, the acceleration of the economic growth after the liberalisation is far from having led to a boom in job creations outside of agriculture: when, between 2001 to 2011, the GDP surged from 494 billion USD to 1.88 trillion, less than 80 million jobs have been added (+380% Vs. +18.7%). The 2000s has been termed jobless growth decade as most of the job creations, mainly in construction and services are just compensating the loss of employment in agriculture and industry. According to the Census figures, the number of people seeking jobs grew annually at 2.23% between 2001 and 2011, but the job creations during this decade was only 1.4%, leaving a huge gap in the form of unemployment and underemployment. In the Indian services driven economy, where contributed more than 60% of the GDP in 2013, the sector was employing only 27% of the workforce. The most productive sector and the utmost metropolitan too, the IT sector who rose from 0.9% of the GDP in 1999-2000 to 3.3% in 2013-14 (an overwhelming share generated through BPO and exportation) is employing only 3 million people (0.6% of the total workforce) and is generating indirectly some 8 to 9 million jobs. These figures help to make sense of the limited attraction of large cities in a context where a large majority of the new job seekers have limited skills and introduce the notion of “exclusionary urbanism” (Kundu et al, 2012).
If we add that the job contractualisation in India is characterised by the domination of precarious conditions, we understand that the challenge to include the workforce in a context of rapid economic transition is tremendous adding stress to the urban environments. In 2010, 15.5% of the total workforce only was composed of regular wage earners, 33.3% were casual labourers and 48.8% self-employed; for the urban sector figures were respectively 41.8%, 16.6% and 41.5% in average (Chandrasekhar, 2016). The proportion of marginal workers10 is lower in the cities, as they count for 11% of the total male workers in average.
However, deep variations are observed among cities, the standard deviation reaching 7.5, and the proportion of marginal workers varying from 0.5% to 58% of the total of male workers. The small towns appear on the frontline of the transition process as places which accommodate a higher share of non-regular workers than larger cities: the share of regular wage earners was standing at 51.6% in Million plus cities and 31% only in towns with less than 50,000 inhabitants (Chandrasekhar 2016). They constitute commonly localities were people are accessing or create their non-farm activity and access to resources, notably through commuting and temporary migrations.
9 Based on National Sample Survey data usual status (principal status and subsidiary status). Adding 2011
census data for cultivators and agricultural labourers, the share reaches 54.6% of the total workforce.
10 The Census of India defines marginal workers as people which have work less than 6 months during the year
The relation of cities to employment is not only depending of their size but is also variating from region to region, notably builds upon the ranking of the State in the non-farm sector transition. The weight of marginal workers in the workforce of cities located in the Indo-Gangetic valley is significantly higher than in the other Indian cities (Figure 5). This sharp contrast underline the underemployment trends observed in this very agricultural region, which can be partly explained by the fact that the job destruction in the farming sector is partially compensated by the job creations in the other sectors.
The differences between city size and Indian region are very less pronounced when considering the job intensity; i.e. the share of inhabitants supported by the male workers. In average, the male workers constitute 27% of the total population of the Indian cities, with a standard deviation of 2.3% (Figure 5).
However, slight regional contrasts appear (Figure 6): the cities with the highest job intensity are located around Kolkata, in the North-West of Tamil-Nadu and around Bangalore, in the South of Mumbai and in Gujarat, and finally in Punjab. These regions have in common an important industrial base well established, notably in small towns, and connected to several global chains of value. At the opposite, the cities where the job intensity is the lowest are located in the dense and agricultural Indo-Gangetic valley, especially in the State of Bihar.
Public Policy, Agglomeration and Urbanization
India had a long tradition of municipal governance before Independence in 1947. Indeed, many of its most prominent political leaders were city leaders (in part because the municipal space was among the few relatively free democratic spaces available under colonial rule). However, this tradition did not continue in independent India. The Constitution did not provide for local government till 1992, and it thus remained a creature of State legislatures. This meant that they had very few powers and more importantly, for our purposes, the thresholds (e.g., in terms of population and economic activity) for becoming a statutory urban area, with an urban local government varies widely across States. This has led to a situation where currently about 15% of the population classified as urban by the Census of India is not classified as living in a statutory urban area by their respective State governments.
At the national level too, industrial policies and urban policies were not synchronized. Until the second half of the 1980s, private industrial investment was under a strict licensing system, which had explicit preferences for backward (non-urbanized) areas and public investment too was directed away from major urban centres in order to make regional development more equitable (Chakravorty and Lall 2007). While in certain places, this did create new urban centres like the iconic city of Chandigarh and the steel cities of Bhilai, Bokaro and Rourkela, it also meant that the natural tendencies of economic agglomeration, even for more labour intensive industries even in the private sector like textiles and garments and light manufacturing were counteracted by the regional investment policies of government.
Figure 5: Proportion of Male Marginal Workers in the Indian cities in 2011
The proportion of marginal workers is the ratio between the marginal male workers and the total of the male worker in a city
Furthermore, even when the constitution did include local governments in 1992, it distinguished between urban and rural local governments and the nature of public services and economic powers available to the local government differed by whether it was classified as urban or rural. In most States today, land use planning, major infrastructure service provision (even for basic urban services like water and sanitation) and economic interventions are not decisions of the local government, but of the State government. Since State governments are still elected by largely rural electorates, investment in urban areas and attention to urban issues are not among the most politically important issues. This underinvestment in cities is one of the reasons for their relatively limited attractiveness.
Figure 6: Share of male workers in the Indian cities in 2011
The job intensity represents the share of inhabitants (in %) supported by the male workers.
Since the mid-1980s and even more since the 1990s, this industrial licensing system has been dismantled and private investment is now allowed in almost all sectors (recently, it was allowed in defence industries also). Many State governments now have pro-active investment promotion policies and industrially developed States are now attracting private investment – making it more likely that economic agglomeration tendencies will be synchronized with public policy. However, the concomitant almost bubble-like rise in real eState values around large cities, referred to earlier, acts against this trend as it makes it more difficult for both the private sector and the State government to assemble land for other economic activities.
Since the mid-2000s, the national government has also started to provide financial assistance for urban infrastructure development in a substantial manner. The Jawaharlal Nehru National Urban Renewal Mission (JNNURM) focused on sixty five identified cities (including all the large cities), but it also provided limited financial assistance to all statutory urban areas, through the States. As Khan (2016) documents, while smaller towns did receive proportionately less allocations of funds, about 46% of funds were allocated to cities other than the 65 cities. Since then, the national government has become even more involved in supporting urban areas. The current government’s urban policies focus on supporting one hundred “smart
cities”, and five hundred large towns of more than one hundred thousand people, under the Atal Mission for Rejuvenation and Urban Transformation (AMRUT), each of which has a budget allocation of around USD 7.5 billion over five years, as well as an aggressive housing scheme, called the Prime Minister’s Awas Yojana (Housing Scheme). While the smart cities mission has an economic component, other schemes focus on basic infrastructure such as water and sewerage and housing. In addition, there are a number of industrial corridor schemes, but these are not focused on existing urban areas. Thus, there does not appear to be a focused national effort to coordinate investment in economic centres of existing large cities, which would also contribute to the dispersed pattern of urbanization that is evident in the data.
Conclusion
Despite a huge urban population of 380 million inhabitants, the Indian system of cities is rooted in a dominantly rural environment, with nearly 70% of the population living in rural area. The urban transition is currently ongoing, with urban population annual growth rate fluctuating between 1.5% and 2.5% since 1961.
The urban growth is globally distributed among the cities whatever their size or location; the cities’ annual growth rate and trajectories are not so much differentiated. It is interesting to point out that while the fast growing cities are mostly the largest States capitals, one third of them are small towns (below 100,000 inhabitants), underlying that the Indian urbanisation is not only driven by the million plus cities. Despite a very slightly higher growth rate of million plus cities since the eighties, no trend of concentration of urban population in the largest cities is noticeable. It has to be associated to a very slow process of economic metropolitanization. The urban growth is mostly due to the natural growth of cities, which is decelerating because of the demographic transition ongoing faster within the urban environment. On the other hand, in a context of slow urban transition, the rural to urban migrations contribute, in a stable manner, for around 20% only of the city growth since the 1970’s. However, residential migrations contribute to the growth of the cities of the richest States as Maharashtra (Mumbai, Pune) or Delhi supplied by flows of migrants from the poorest States such as Bihar or Uttar Pradesh. To these regular migrations are added seasonal migrations and daily commuting that connect the rural world to the urban system and blur the limits of the urban localities.
The urban transition is accompanied by the rapid fall of the farm sector in the GDP, which accounts for 18.1% of net value added in 2013-14. The Indian economy is becoming more and more a services led economy. The secondary sector (including construction, which alone constituted 8.8% and mining) comprised 28.7%, while the tertiary sector comprised the remaining 53.2%. An interesting aspect of the economic structure is the more skewed nature of the tertiary sector: its share of urban NVA is 70.3%, while its share of rural NVA is only 28.3%. Unexpectedly, the share of the secondary sector (including construction) in rural areas is actually higher, at 32.5% compared to 27.9% in urban areas!
There is no sign of a rapid process of metropolitanization of the economy and, with important regional differences, the growth contribution remains distributed among all the system of cities expanding even outside of the urban boundaries in distant peripheries in order to reduce costs
of production. Notably, very specialized clusters gathering skills and a myriad of small scale enterprises remain an important feature of the economic landscape and of its insertion within the global economy. They are often combining a net of small towns and participate actively of emerging multipolarised extended urban regions that combine cities of different size and villages. This functional intricating of urban expansions is making more and more indistinct several limits between intra-urban and interurban realms, will are materializing hybrid urban objects reworking the system of cities through merging and expansion. It is accentuated by a classic centrifugal process where the centres of the largest metropolis are stagnant and even losing population in favour of their peripheries.
Beside a tiny layer of highly skilled professional in IT sector and not more than half of the active population being regular earners making of a positive difference in favour of the largest cities, precarious conditions, self-employed plus casual labourers, are dominant; a situation notably accentuated in the smaller towns. The proportion of marginal workers tends also to be higher in the small towns and in the cities of the Indo-Gangetic valley. The cities of this major river basin are also those where the job intensity is the lowest, highlighting the challenge of the economic transition outside of agriculture in term of employment and the role of the smaller towns in that respect.
Those trends are not leading clearly toward a simple convergence and hierarchisation of the urban system. India development path and the articulation between its economic transition and urbanisation is in many respects specific, but it is an specificity that matters since the subcontinent has 17% of the world’s population and is the 4th largest economy in PPP terms.
0 References
Bhagat, R. (2002). "Challenges of rural-urban classification for decentralised governance." Economic and Political Weekly: pp 2413-2416.
Bhagat R. (2005). « Urban growth by city and town-size in India ». Annual meeting of Population Association of America, Philadelphia, USA, 31 Mars – 2 Avril 2005.
Behera, B.S. and Behera, A.C. (2013). Gender Issues: the Role of Women in Agriculture Sector in India. International Journal of Marketing, Financial Services & Management Research, 2(9), 134-145.
Bose, A. (1964). "Six Decades of Urbanization in India 1901-1961." Indian Economic & Social History Review.
Bose, A. (1970). Urbanization in India, An Inventory of Source Materials.
Bretagnolle A., Pumain D., Vacchiani-Marcuzzo C. (2007). “Les formes de systèmes de villes dans le monde”. In MATTEI Census of India, 2001b; Census of India, 2001a) Census of India, Administrative Division, 2011
Chakravorty, Sanjoy and Samik Lall (2007). Made in India, Oxford University Press
Chandramouli, C. (2013). Trends In Growth of Urban Population, PPT Presentation Registrar General & Census Commissioner, India 15th March 2013
Chandrasekhar, S. (2011): Workers Commuting between the Rural and Urban: Estimates from NSSO Data. Economic and Political Weekly, 46(46), 22-25.
Chandrasekhar, S. (2016) “Urbanisation in a decade of near jobless growth”, In Reclaiming small
towns. Subaltern urbanisation in India (Denis E. & Zérah M.H. éds.), Springer.
Chandrasekhar, S., & Sharma, A. (2014). Urbanization and spatial patterns of internal migration in India. Spatial Demography, 1-27.
Duvvury (1989) Work participation of women in India: a study with special reference to female agricultural labourers, 1961 to 1981 in Jose, A. V. (Ed.). (1989). Limited options: women workers in rural India. International Labour Organization
Denis E. et Marius-Gnanou K. (2011). « Toward a better appraisal of Urbanization in India: a fresh look at the landscape of morphological agglomerates ». Cybergeo, revue Européenne de Géographie, article 569.
Denis, E., Mukhopadhyay P., Zérarh, M.H. (2012). « Subaltern urbanisation in India ». Economic and Political Weekly, Vol. 47, n°. 30, p 52-62.
Durand-Dastès, F. (1995). Le Monde Indien. Géographie Universelle: Afrique du Nord, Moyen-Orient, Monde Indien Belin-Reclus. Paris Durand-Dastès, F. Mutin, G. 8: pp 322-329.
Durand-Dastès F. (2003). “Modèle des comptoirs. Les comptoirs dans leur environnement”. Mappemonde, no. 69, p. 10-12.
Dupont V. (2008). “L’urbanisation en Inde : révision de quelques mythes et vrais défis”. Rayonnement du Cnrs, no. 47, p. 7-14.
Ghani, E., Goswami, A. G., Kerr W. R. (2012). Is India's Manufacturing Sector Moving Away From Cities?, NBER Working Paper No.17992
Ghani E., Kerr W.R. and O'Connell S.D. (2013). Female Business Ownership and Informal Sector Persistence. World Bank, Washington, DC, World Bank: https://openknowledge.worldbank.org /handle/10986/16836 License: CC BY 3.0 IGO
1
Gibrat, R. (1931). Les inégalités économiques. Paris, Librairie du Recueil Sirey.
Jose, A. V. (Ed.). (1989). Limited options: women workers in rural India. International Labour Organization
Khan, S. (2016), “The Other JNNURM: What does it mean for Small Towns in India?” In
Reclaiming small towns. Subaltern urbanisation in India (Denis E. & Zérah M.H. éds.), Springer.
Kundu, A. and Saraswati, L.R., 2012. Migration and exclusionary urbanisation in India. Economic
and Political Weekly, 47(26-27), pp.219-227.
Kuruvilla, (2014) Census Towns in Kerala: Challenges of Urban Transformation, Research notebooks, School of Habitat Studies
Mazumdar, I. and Neetha N. (2011). Gender dimensions: Employment trends in India, 1993-94 to 2009-10 (No. id: 4502).
Moriconi-Ebrard F. (1993). L’Urbanisation du Monde depuis 1950. Paris: Economica, Anthropos, coll. “Villes”, 372 p.
National Sample Survey 2010
Pradhan K.C. (2012). Unacknowledged urbanisation: The new census towns of India. New Delhi: Centre for Policy Research, Working paper, 24 p.
Pradhan, K. C. (2013). Unacknowledged urbanisation: New census towns of India, Economic and Political Weekly, xlviii(36), 43–51
Pumain, D. (1982). La Dynamique des villes. Anthropos, Economica, Paris.
Ramachandran R. (2010). Urbanization and Urban Systems in India. Delhi: Oxford University Press, coll. “Oxford India Paperbacks”, 364 p.
Samanta G, (2014), The Politics of Classification and the Complexity of Governance in Census Towns, Review of Urban Affairs, Economic & Political Weekly, Vol – XLIX No. 22
Shaw, A. (2005). Peri-urban interface of Indian cities: growth, governance and local initiatives. Economic and Political Weekly, 129-136.
Sivaramakrishnan K.C., kundu A., singh B.N. (2007). Handbook of Urbanization in India. New-Delhi: Oxford University Press, 177 p.
Swerts E. (2016, à paraître) The substantial share of small towns in India's system of cities, in The Subaltern Urbanization in India, Denis E., Mukhopadhyay P. et Zerah M-H (Eds.), Springer. Swerts E. et Denis E. (2015). “Megacities: the Asian Era” in R.B. Singh (ed) Urban Development Challenges, Risks and Resilience in Asian Mega Cities, Springer, 2015.
Swerts, E. and Pumain, D. (2013). A statistical approach to territorial cohesion: the indian city system. L’Espace géographique, (1), 77-92.
Thomas, J. J. (2012). India’s Labour Market during the 2000s. Economic & Political Weekly, 47(51), 39.
Vaidyanathan, A. (1986). Labour use in rural India: a study of spatial and temporal variations. Economic and Political Weekly, A130-A146.