HAL Id: hal-02633978
https://hal.inrae.fr/hal-02633978
Submitted on 27 May 2020
HAL is a multi-disciplinary open access
archive for the deposit and dissemination of
sci-entific research documents, whether they are
pub-lished or not. The documents may come from
teaching and research institutions in France or
abroad, or from public or private research centers.
L’archive ouverte pluridisciplinaire HAL, est
destinée au dépôt et à la diffusion de documents
scientifiques de niveau recherche, publiés ou non,
émanant des établissements d’enseignement et de
recherche français ou étrangers, des laboratoires
publics ou privés.
Distributed under a Creative Commons Attribution| 4.0 International License
From dusk till dawn: the Arabidopsis thaliana sugar
starving responsive network
Maria C. Arias, Sandra Pelletier, Frédérique Hilliou, Fabrice Wattebled,
Jean-Pierre Renou, Christophe d’Hulst
To cite this version:
Maria C. Arias, Sandra Pelletier, Frédérique Hilliou, Fabrice Wattebled, Jean-Pierre Renou, et al..
From dusk till dawn: the Arabidopsis thaliana sugar starving responsive network. Frontiers in Plant
Science, Frontiers, 2014, 5, �10.3389/fpls.2014.00482�. �hal-02633978�
From dusk till dawn: the Arabidopsis thaliana sugar
starving responsive network
Maria C. Arias1*, Sandra Pelletier2†, Frédérique Hilliou3, Fabrice Wattebled1, Jean-Pierre Renou2†and Christophe D’Hulst1
1
Unité Glycobiologie Structurale et Fonctionnelle, UMR 8576-CNRS, Université de Lille 1, Villeneuve d’Ascq, France
2
URGV, UMR INRA 1165-CNRS 8114-UEVE, Évry, France
3
Institut Sophia Agrobiotech, UMR 1355, Institut National de la Recherche Agronomique, Sophia-Antipolis, France
Edited by:
Susan Gibson, University of Minnesota, USA
Reviewed by:
Pierdomenico Perata, Scuola Superiore Sant’Anna, Italy
Chen Hongzhang, Chinese Academy of Sciences, China
*Correspondence:
Maria C. Arias, Unité Glycobiologie Structurale et Fonctionnelle, UMR 8576 CNRS – Université Lille 1, Bâtiment C9 - Cité Scientifique, 59655 Villeneuve d’Ascq, France e-mail: maria-cecilia.arias@ univ-lille1.fr
†Present address:
Sandra Pelletier and Jean-Pierre Renou, IRHS, UMR 1345, Institut National de la Recherche Agronomique, Beaucouze, France
Plant growth and development are tightly controlled by photosynthetic carbon availability. The understanding of mechanisms governing carbon partitioning in plants will be a valuable tool in order to satisfy the rising global demand for food and biofuel. The goal of this study was to determine if sugar starvation responses were transcriptionally coordinated in Arabidopsis thaliana. A set of sugar-starvation responsive (SSR) genes was selected to perform a co-expression network analysis. Posteriorly, a guided-gene approach was used to identify the SSR-network from public data and to discover candidate regulators of this network. In order to validate the SSR network, a global transcriptome analysis was realized on three A. thaliana starch-deficient mutants. The starch-deficient phenotype in leaves induces sugar starvation syndrome at the end of the night due to the absence of photosynthesis. Promoter sequences of genes belonging to the SSR-network were analyzed in silico reveling over-represented motifs implicated in light, abscisic acid, and sugar responses. A small cluster of protein encoding genes belonging to different metabolic pathways, including three regulatory proteins, a protein kinase, a transcription factor, and a blue light receptor, were identified as the cornerstones of the SSR co-expression network. In summary, a large transcriptionally coordinated SSR network was identified and was validated with transcriptional data from three starch-deficient mutant lines. Candidate master regulators of this network were point out.
Keywords: co-expression network analysis, starch, sugar starvation, microarrays, metabolism integration
INTRODUCTION
The photosynthetic carbon fixation and the subsequent synthe-sis of polysaccharides such a starch and cellulose are necessary to plant development and growth, but they also play a vital role for life on earth. Biosynthesis, transport, and storage of carbo-hydrates depend on plant physiology but also on environmental conditions, and the capacity of plants to sense and respond to sugars is a pivotal element between internal and external signals (Koch, 2004; Rolland et al., 2006; Loreti et al., 2008; Lastdrager et al., 2014). It is expected that plant growth is driven by carbohy-drates availability, but the existence of more complex regulatory mechanisms coordinating carbon supply and use have been pro-posed (Smith and Stitt, 2007). It has been suggested that starch synthesis and degradation is a crucial element in the balance between resource availability and development in leaves (Sulpice et al., 2009). Starch is a primary product of photosynthesis, and the most important storage-carbohydrate in plants (Buleon et al., 1998); its metabolism is complex and involves several enzymes encoded by genetically independent nuclear-genes (Ball and Morell, 2003). Although the understanding of the molecu-lar mechanisms that lead to starch metabolism in leaves has been strongly improved in the last decade, the integration of the starch biosynthetic pathway with the whole plant carbon metabolism
has not been fully clarified (Kotting et al., 2010). However, evi-dence showing the articulation of starch metabolism with other primary pathways has been shown (Mentzen et al., 2008).
During the last few years, the study of plant gene networks has become possible thanks to the huge available amount of data generated by Arabidopsis thaliana knock-out mutants and from plants undergoing multiple physiological conditions (e.g., hormonal and chemical treatments; biotic or abiotic stresses). Network representation of transcriptomic data can provide evidence of gene-to-gene relationships. Network analysis may uncover groups (modules) of functionally related genes and thus, can yield a systematic understanding of plant responses. The classic clustering analysis is a useful approach to identify genes that may participate in the same biological process (D’Haeseleer, 2005), but is not efficient for the identification of regulatory genes. By revealing biological relationships that are not appar-ent from single gene co-expression approaches, co-expression network analysis is a powerful integrative approach for the con-struction of new data-driven models (Barabasi and Oltvai, 2004). In the present work a guided-gene approach was chosen to study the sugar starvation syndrome at transcriptional level (Lisso et al., 2005; Aoki et al., 2007). A small group of sugar starving responsive genes (SSR) were selected, to perform a
Arias et al. Arabidopsis sugar starving responsive network
co-expression network analysis. This gene subset was loaded into the CressExpress pipeline, a co-expression analysis tool for
A. thaliana microarray expression data (Srinivasasainagendra et al., 2008), and Cytoscape software package (Cline et al., 2007) was posteriorly used to build a graphical representation of the network.
The SSR network was validated with transcriptional data from starch-impaired mutants. In order to mimic sugar star-vation in leaves, microarray analysis was performed on three
A. thaliana starch-deficient mutants obtained in our lab (Dumez et al., 2006). The starchless mutant be2 be3, knock-out of two genetically independent isoforms of starch branching enzyme (Dumez et al., 2006), was compared with an adg1 insertion mutant line, with the leaves starch content reduced by 80% at the end of the day. The ADG1 gene encodes the small catalytic subunit of ADPG-pyrophosphorylase. This enzyme is responsi-ble for the synthesis of ADP-glucose, the unique precursor of starch synthesis. In the double mutant be2 be3 starch synthesis was abolish, substituted by abnormally high levels of maltose in the cytosol, likely due to the incapacity of cells to integrate it into the cellular metabolism. However, maltose accumulation disap-peared when the adg1 mutant allele was combined with both be2 and be3 mutations to generate the triple mutant adg1 be2 be3 (Dumez et al., 2006). This triple mutant was also included in our analysis.
MATERIALS AND METHODS
SSR GENES SELECTION AND CO-EXPRESSION NETWORK ANALYSIS
According to the hypothesis that genes involved in coordi-nated biological processes share similar transcription profiles (Eisen et al., 1998), 13 sugar-starvation responsive genes were selected to perform a co-expression network analysis (Kolbe et al., 2005; Gonzali et al., 2006; Binder et al., 2007; Lee et al., 2007; Hanson et al., 2008; Miyashita and Good, 2008). Genes of this
subset belong to few metabolic pathways (Table 1). In order to enlarge this first network, two more correlation coefficient anal-ysis were performed in a recursive way, including significantly co-expressed genes with at least 5 neighbors from each previ-ous analysis. CressExpress pipeline (http://www.cressexpress.org/ index.jsp) was used for the construction of the co-expression network. CressExpress computes patterns of correlated expres-sion between query genes and the rest of the genes in the genome (Srinivasasainagendra et al., 2008). The co-variation analysis was carried out on the data release 3.0 with all avail-able samples, and with CressExpress default settings. Finally, Cytoscape software package (http://www.cytoscape.org/) was used to perform a graphical representation of the network (Cline et al., 2007). Highly interconnected modules were identified by AllegroMCODE (http://allegroviva.com/allegromcode/), a high-performance MCODE cluster finder for Cytoscape (Saito et al., 2012). All genes with at least two neighbors were represented in the final SSR network.
IN SILICO ANALYSIS OF CIS-REGULATORY ELEMENTS
ATHENA (http://www.bioinformatics2.wsu.edu/Athena) pro-moter sequence analysis tool (O’Connor et al., 2005) was used to identify statistically over-represented (p< 10−3) transcrip-tion factor binding sites occurring in the selected set of pro-moters (1000 bp upstream of the transcriptional start site). The PROMOMER tool (http://bar.utoronto.ca/ntools/cgi-bin/ BAR_Promomer.cgi) was also used to identify statistically over-represented cis-elements in the promoters of the SSR genes (Toufighi et al., 2005). PROMOMER is a word-counting program that allows the identification of significantly over-represented motifs in a particular set of promoters compared with randomly generated promoter sets from the genome (Toufighi et al., 2005). This tool uses the Boyer–Moore algorithm for matching and counting n-mers in a set of sequences (Boyer and Moore, 1977).
Table 1 | SSR gene subset used as seeds for the recursive expression network analysis.
Pathway AGI code Gene name TAIR annotation References
Proline catabolism At3g30775 ERD5 Proline dehydrogenase Hanson et al., 2008
Asparagine metabolism At3g47340 ASN1 Asparagine synthetase Hanson et al., 2008
At3g45300 IVD Isovaleryl-CoA-dehydrogenase Binder et al., 2007
BCAA degradation At3g13450 BCKDH E1β BCα-keto acid dehydrogenase Binder et al., 2007
At3g06850 BCKDH E2 BCα-keto acid dehydrogenase Binder et al., 2007
At1g03090 MCCA sub1 3-methylcrotonyl-CoA carboxylase Binder et al., 2007 At4g34030 MCCB sub2 3-methylcrotonyl-CoA carboxylase Binder et al., 2007
Glutamate metabolism At5g07440 GDH2 Glutamate dehydrogenase 2 Miyashita and Good,
2008
Cell wall turnover At5g56870 BGAL4 β-galactosidase Lee et al., 2007
At5g49360 BXL1 Glycosyl hydrolase family 3 Lee et al., 2007
Trehalose biosynthesis At2g18700 TPS11 Trehalose-6-phosphate synthase Kolbe et al., 2005
At1g70290 TPS8 Trehalose-6-phosphate synthase Kolbe et al., 2005
ARABIDOPSIS THALIANA LINES AND GROWTH CONDITIONS
Three A. thaliana mutant lines ecotype Wassilewskija were used in this study: the single mutant adg1, the double mutant be2 be3 and the triple mutant adg1 be2 be3. The double and triple mutant were generated in our lab (Dumez et al., 2006). In adg1 the T-DNA was inserted in the promoter region, leading to a non-null phe-notype. This mutant line presents a reduction of 80% of the leaf starch content at the end of the day. The conditions in the envi-ronmental chamber were as follows: 100μE.m−2.s−1irradiance, 16/8 light/dark cycle, 23/20◦C. Leaf samples were harvested on 6-week-old plants.
TRANSCRIPTOMIC STUDIES
Microarray analysis was carried out using the CATMA arrays con-taining 24,576 gene-specific tags corresponding to 22,089 genes from Arabidopsis (Crowe et al., 2003; Hilson et al., 2004). Each mutant line was compared with control plants. Three indepen-dent biological replicates were produced. For each biological repetition, leaves of three plants were randomly selected and immediately frozen in liquid nitrogen. Leaves were collected at two time points: at the end of the light phase (qualified hereafter as “dusk”) and at the end of the dark phase (qualified hereafter as “dawn”). Samples were collected on plants at 5.10 developmental growth stage (Boyes et al., 2001). Total RNA was extracted using the Plant RNeasy kit (QIAGEN, Courtaboeuf, France) according to the supplier’s instructions. For each comparison, one tech-nical replication with fluorochrome dye swap was performed for each biological replicate (i.e., four hybridizations per com-parison). The labeling of cRNAs with Cy3-dUTP or Cy5-dUTP (Perkin-Elmer-NEN Life Science Products), the hybridization to the slides, and the scanning were performed as described inLurin et al. (2004).
STATISTICAL ANALYSIS OF MICROARRAY DATA
Normalization and statistical analysis was based on three dye swaps (i.e., six arrays, each containing 24,576 GSTs and 384 controls) as described inGagnot et al. (2008). To determine dif-ferentially expressed genes, we performed a paired t-test on the log ratios, assuming that the variance of the log ratios was the same for all genes. Spots displaying extreme variance (too small or too large) were excluded. The raw p-values were adjusted by the Bonferroni method (Ge et al., 2003). We considered as being differentially expressed the genes with a Bonferroni p≤ 0.05, as described inGagnot et al. (2008). Microarray data were deposited at Gene Expression Omnibus (http://www.ncbi.nlm.nih.gov/ geo/), accession number GSE20964, and at CATdb (http://urgv. evry.inra.fr/CATdb), project: GnP06-02_Starch; according to the “Minimum Information about a Microarray Experiment” standards.
RESULTS
CO-EXPRESSION NETWORK ANALYSIS
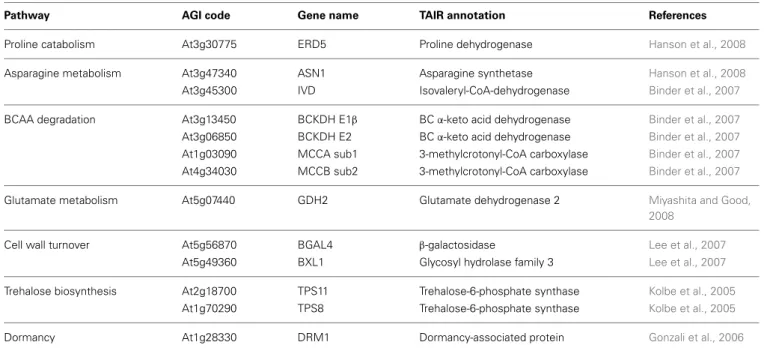
A SSR network constituted by 820 nodes (genes) and 3880 edges was obtained (Figure 1) using the selected 13 genes as seeds (Table 1). The SSR network have the classical scale-free topology of biological networks, showing few highly connected nodes interacting with many poorly connected nodes (Barabasi
FIGURE 1 | SSR network. Co-expression network analysis performed with
CressExpress using public transcriptome datasets. Cytoscape was used for the graphical representation of the network. Pink circles, red circles and purple circles indicate respectively genes induced at dawn in three, two or only one of the starch-deficient mutant lines. Green circles indicate genes repressed at the end of the night. Black dots indicate genes with stable expression in the three mutant lines under the conditions of the present study. The yellow circles correspond to the 15 genes highly connected (more than 100 neighbors). These candidate regulatory genes belong to several metabolic pathways: lipid catabolism (At3g51840, At5g04040), cell redox homeostasis regulation (At2g37130, At5g10860), amino acid metabolism (At2g39570, At2g40420, At3g45300), protein transport (At1g80920), trehalose biosynthesis (At1g23870), three uncharacterized proteins (At4g28300, At4g28040, At2g32150), a protein kinase (STY46), a transcription factor (UPBEAT1) and a blue light receptor (PLPB). The central bigger yellow circle correspond to the protein kinase STY46.
and Oltvai, 2004). The large majority of genes in the network (717) have less than 10 neighbors, 11% of the genes (89) have between 10 and 99 neighbors; only 2% of the genes (15) have more than 100 neighbors, and could be considered as potential master regulators. These 15 candidate master regulators belong to several metabolic pathways: lipid catabolism (At3g51840,
At5g04040), cell redox homeostasis regulation (At2g37130, At5g10860), amino acid metabolism (At2g39570, At2g40420, At3g45300), protein transport (At1g80920), trehalose
biosynthe-sis (At1g23870), and three uncharacterized proteins (At4g28300,
At4g28040, At2g32150). Interestingly, three of the highly
con-nected genes encode for plant-specific regulatory proteins with unknown metabolic function: a protein kinase (STY46), a tran-scription factor (UPBEAT1) and a blue light receptor (PLPB). All these regulator genes were overexpressed in the starch-deficient mutant lines (Supplemental Data Sheet 1). The gene encoding for the isovaleryl-CoA-dehydrogenase (IVD, At3g45300) is the only candidate regulatory gene that belongs to the starting SSR gene set. The SSR network was searched for modules, defined as a group of densely connected nodes (genes) that have a sparsely connected periphery. Two highly interconnected modules were
Arias et al. Arabidopsis sugar starving responsive network
clearly identified by AllegroMCODE (Supplemental Image 1). Remarkably, the protein kinase STY46 tightly connects these two modules (Supplemental Data Sheet 1). Several of STY46 neigh-bors are in turn densely connected, suggesting a central role of this gene in the SSR network (Figure 1).
STARCH-DEFICIENT MUTANTS
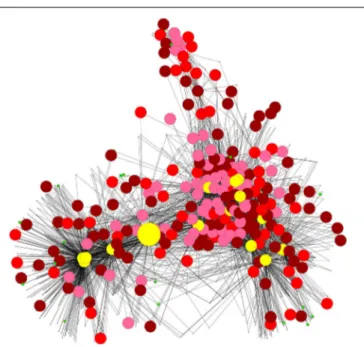
The diurnal cycle provides a defined experimental system to investigate how the supply and utilization of carbon is coordi-nated within the plant tissues. In wild-type plants leaves, starch is synthesized during the day, while photosynthesis is active, and degraded during the night providing a continuous supply of car-bon and energy to sustain plant metabolism and growth. 3332 genes displayed a significantly altered expression pattern in at least one of the mutants (Bonferroni p< 0.05) and 545 of them were modulated simultaneously in the three mutant lines (Figure 2A). Samples were taken at two time points between light and dark phase: “dusk” and “dawn.” The global response during the diur-nal cycle showed a large reprogramming of the cell transcriptome in the three starch-deficient mutants at the end of the dark phase (“dawn”). Only 23% of genes (783) showed an altered expression pattern at both times of sampling, but the majority, 77% (2549), were modulated either at dawn or at dusk, strongly suggesting a circadian-regulated expression (Figure 2B).
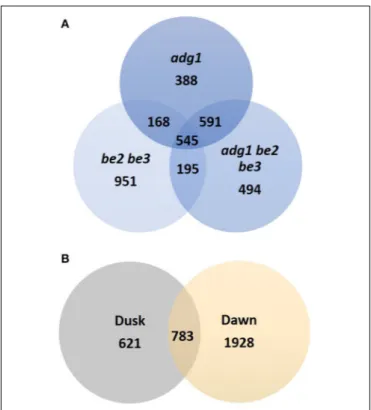
Microarrays data from the three starch-deficient mutant lines were cross-examined with the SSR gene network. Two hun-dred and twenty genes of the network (27%) (Figure 3A)
FIGURE 2 | Venn diagrams of genes identified as differentially expressed. (A) Genes identified as differentially expressed in adg1, adg1
be2 be3, and be2 be3 mutants. (B) Venn diagram showing the circadian
regulation of differentially expressed genes in the three mutant lines.
were overexpressed at dawn in at least one of the mutants (Supplemental Data Sheet 1), and 74 of these genes were over-expressed in the three mutant lines (Figure 3B). At this time point, starch-deficient plants suffer from sugar starvation as a consequence of the absence of photosynthesis during the dark phase. Interestingly, the expression of SSR genes were nearly not modified at dusk, when plants are not under starvation. Only 27 genes of the network were underexpressed at dawn, but none of them was repressed simultaneously in the three mutant lines. Remarkably, all the genes of the SSR network having more than 25 neighbors were overexpressed at dawn in adg1, be2 be3, and/or adg1 be2 be3 (Supplemental Data Sheet 1). On the con-trary, starchless non-responsive genes were located mostly in the periphery of the network (Figure 1). None of these genes inter-acted with more than 25 neighbors, indicating that they were not implicated in the structure and coordination of the SSR network.
PROMOTER ANALYSIS
An in-silico analysis was performed on the promoter sequences of the SSR genes in order to identify cis-elements possibly impli-cated in the regulation of the transcriptional network. ATHENA pipeline was used to search known transcription factor binding sites in the 220 genes overexpressed in the starch-deficient mutant lines (O’Connor et al., 2005). Two cis-elements were significantly over-represented (Table 2): Ibox promoter motif, a conserved motif upstream of light regulated genes (Giuliano et al., 1988), and ABRE-like binding site, a family of abscisic acid responsive elements (Abe et al., 2003; O’Connor et al., 2005). Posteriorly, a non-targeted approach was performed using PROMOMER (Toufighi et al., 2005). TTATC, a fragment of the sugar repres-sive element TTATCC (Tatematsu et al., 2005), was found in 85% of promoters (Supplemental Data Sheet 2). Remarkably, GATAA, an Ibox associated motif (Giuliano et al., 1988), was also signifi-cantly over-represented in the SSR genes (86%), in coherence with the results obtained with ATHENA (Supplemental Data Sheet 3).
SSR METABOLIC PATHWAYS
The subset of SSR genes selected for the co-expression net-work analysis was involved in amino acid metabolism, cell wall turnover, trehalose biosynthesis, and dormancy (Table 1). Remarkably, the resulting SSR network included also pathways that were not present in the starting gene set. Genes with the high-est number of neighbors were involved in amino acid metabolism, cell wall metabolism, lipid catabolism, sugar signaling, tran-scription regulation, and cell redox homeostasis. Genes related with metabolites transport, proteolysis, detoxification and stress response, signal transduction, and several genes with unknown function were also part of the network (Supplemental Data Sheet 1).
Cell wall metabolism
A small cluster of genes involved in cell wall metabolism includ-ing the sugar starvinclud-ing responsive BGAL4 and BXL1 (Lee et al., 2007), were part of the SSR network and were also overexpressed at the end of the dark phase in the starch-deficient mutant lines (Supplemental Data Sheet 4). Cell wall metabolism is connected with the central plant metabolism through the nucleotide sugar
FIGURE 3 | Genes belonging to the SSR network showing different pattern of expression in the starch-deficient mutant lines. (A) The
ripped zone represents the percentage of genes repressed or overexpressed at dawn in at least one of the mutants; the violet zone represents genes up- or down-regulated at dusk in at least one of the mutants and the gray zone represents genes showing a stable level of
expression at the two times of sampling. (B) Percentage of genes that repressed or overexpressed in adg1, adg1 be2 be3, and be2 be3 microarray experiments at dawn (ripped zone of A). Red color represents genes overexpressed in the three mutants; dark red represents genes overexpressed in one or two mutant lines and green represents genes repressed in the starch-deficient mutant lines.
Table 2 | Transcription factor-binding sites.
Transcription factor Cis-elements in Cis-elements p-value
motif name subset (220 genes) in genome
ABRE-like binding site 39% 89 20% 6258 <10e−5
Ibox 62% 140 40% 12259 <10e−4
Most common cis-acting promoter elements within the 200 SSR genes overex-pressed in the starch deficient mutant lines identified by ATHENA pipeline.
interconversion pathway (Seifert, 2004). UGE1, coding for an enzyme that interconverts UDP-galactose to UDP-glucose, was part of the SSR network and was activated at dawn in the triple mutant adg1 be2 be3. UDP-glucose, through the generation of glucose-6-P, is a precursor for both fatty acid and trehalose syn-thesis (Avonce et al., 2006; Barber et al., 2006). Interestingly, three trehalose-phosphate synthases (Supplemental Data Sheet 4), and several genes involved in lipid degradation were part of the SSR network and were also activated at dawn in the mutant lines (Supplemental Data Sheet 5).
The three starch-deficient mutants showed an altered expres-sion pattern of cell wall metabolic genes. A large cluster of genes implicated in the biosynthesis of cell wall polysaccharides, but also in cell wall construction and modification were repressed in adg1,
adg1 be2 be3, and be2 be3 mutant lines at the end of the dark phase
(Supplemental Data Sheet 4).
Sugar signaling
SnRK1-like proteins (Sucrose non-Fermenting Related Kinase 1) have been implicated in the regulation of energy and stress signal transduction pathways in eukaryotes (Hey et al., 2010). Trehalose-6-phosphate (T6P) is a plant signaling sugar that inhibits SnRK1 and is synthesized by the trehalose biosynthetic pathway. Several genes related with the T6P/SnRK1 signaling
pathway were part of the SSR network. In particular KINβ1 (At5g21170), KING1 (At3g48530), and ATHSPRO2 (At2g40000), but also five trehalose-phosphate synthases, TPS6, TPS8, TPS9,
TPS10, TPS11. All of these genes with the exception of TPS6 and TPS10 were overexpressed at dawn in the starch-deficient mutant
lines (Supplemental Data Sheet 4).
Lipid metabolism
Interestingly, despite being absent of the starting SSR gene sub-set, genes involved in lipid catabolism were central elements of the SSR network, and they were also overexpressed at the end of the dark phase in the mutants (Supplemental Data Sheet 5). In particular two candidate master regulators: ACX4, a short-chain acyl-CoA oxidase involved in fatty acidβ-oxidation, and
SDP, an oil body triacylglycerol lipase (Figure 1, Supplemental
Data Sheet 1). An oleosin (At5g56100) encoding for a pro-tein present in oil bodies, a peroxin (At3g61070) member of a gene family that controls peroxisome proliferation, an acyl-CoA oxidase (ACX1) involved in fatty acid degradation, and two lipases (At1g02660, At3g62860) were also overexpressed in the starch-deficient mutant lines, but were not part of the SSR tran-scriptional network. On the contrary, cuticle biosynthesis-related genes, a secondary pathway associated with lipid metabolism, were largely repressed at dawn in the starch-deficient mutant lines (Supplemental Data Sheet 5).
Amino acid metabolism
Several genes involved in the amino acids metabolism and turnover were part of the SSR network, and were also over-expressed at the end of the dark phase in the three mutant lines (Supplemental Data Sheet 1). In particular, BCKDH
E1β, BCKDH E2, IVD, MCCA, MCCB, and DIN4 involved
in the degradation of branched chain amino acids (BCAA) (Supplemental Data Sheet 7). Acetolactate synthase the first committed step of BCAA biosynthesis in plants and bacteria
Arias et al. Arabidopsis sugar starving responsive network
(Duggleby et al., 2008). The acetolactate synthase small subunit coding gene (AHASS1), was also overexpressed in the starch-deficient mutant lines (Supplemental Data Sheet 6). AHASS1 was not part of the SSR transcriptional network indicating a differen-tial regulation of this gene (Gao et al., 2014). BCAA catabolism is induced in A. thaliana under sugar starvation (Binder et al., 2007); however, IMS2 and IMS3, were repressed in the mutant lines (Supplemental Data Sheet 7). These two genes encode enzymes shared by the methionine and the BCAA biosynthetic pathway, and are involved in the synthesis of glucosinolate pre-cursors (Binder et al., 2007). We observed several secondary metabolic pathways displaying an altered expression pattern on the three starch-deficient mutants. Genes involved in the syn-thesis of glucosinolates (Supplemental Data Sheet 6), lignin, polyamines, phenylpropanoids and flavonoids were repressed at the end of the dark phase (Supplemental Data Sheet 7) suggesting a large-scale negative regulation of the secondary metabolism in the starch-deficient mutant lines.
DISCUSSION
Carbon availability and light are two important cross-talking signals regulating plant growth and development (Fankhauser and Chory, 1997; Moore et al., 2003; Casal and Yanovsky, 2005; Franklin et al., 2005; Rolland et al., 2006). They modulate gene expression through signal transduction cascades affecting down-stream cellular responses (Gibson, 2005; Osuna et al., 2007; Thum et al., 2008). The goal of the present study was to analyze the sugar starvation syndrome at transcriptional level. Although some data suggest the articulation of lipid, amino acid and starch path-ways (Mentzen et al., 2008), evidences of a large-scale coordinated plant response to sugar starving are still lacking. A subset of 13 SSR genes (Table 1) were used as seeds for the co-expression analysis. The resulting SSR network was composed by 820 genes involved in amino acid metabolism, cell wall biosynthesis, and sugar signaling, but also by pathways not present in the starting gene set such as lipid metabolism and transcription regulation. A small cluster of 15 genes were identified as the cornerstones of the SSR network, in particular STY46, a protein kinase encoding gene. STY46 is co-expressed with most of the genes responsi-ble of the network structure. The protein kinase STY46 has been implicated in the phosphorylation of proteins targeted to chloro-plast (Martin et al., 2006), but its metabolic function is still unknown.
The SSR network was validated with transcriptional data from three starch-deficient mutant lines obtained in our lab (Dumez et al., 2006). Two hundred and twenty genes of the SSR network were overexpressed in our mutant lines at dawn. The presence of a residual amount of starch in adg1 at the end of the night was not enough to prevent the activation of SSR genes, in coher-ence with previous data (Graf et al., 2010; Scialdone et al., 2013). This result also confirms that maltose accumulation in be2 be3 cannot overcome the starch depletion (Dumez et al., 2006). Cis-elements responsive to light, abscisic acid, and sugars were over-represented in the promoter regions of the SSR genes, strongly suggesting that their expression is transcriptionally coordinated.
The diurnal cycle controls gene expression and plant metabolism (Blasing et al., 2005). In coherence with previous studies, 75% of responsive genes display a circadian expression
pattern in adg1, be2 be3, and adg1 be2 be3. Our data showed that sugar starvation caused by starch deficiency induce a generalized transcriptional reprogramming in the three mutants at the end of the night. Plant nitrogen-nutrition is tightly linked to the cir-cadian rhythm (Gutierez et al., 2008). It is known that sugars can regulate amino acid metabolic genes in plants (Silvente et al., 2008), and that sugar starvation induces amino acid biosynthesis (Mentzen et al., 2008; Miyashita and Good, 2008). Remarkably, amino acid metabolic genes were central elements in the orga-nization of the SSR network and were also overexpressed in the starch-deficient mutant lines (Supplemental Data Sheet 1). Amino acids are indispensable for protein synthesis, but also for other metabolic pathways because they are precursors of a large number of primary and secondary metabolites (D’Auria and Gershenzon, 2005). In particular, they are indispensable for the lignin biosynthesis, an essential constituent of the cell walls,
via the flavonoid and phenylpropanoid biosynthetic pathway
(Besseau et al., 2007).
Plant cell wall is a complex and composite material com-posed predominantly of polysaccharide networks consisting of cellulose, hemicelluloses and pectin, with an external hydropho-bic cover, the cuticle (Lerouxel et al., 2006; Pollard et al., 2008). A small cluster of genes involved in cell wall metabolism was part of the SSR network, and was also activated in the starch-deficient mutant lines. It has been shown that the inhibition of photosynthesis induce the expression of BGAL4 and BXL1 genes and the corresponding protein accumulation (Lee et al., 2007). These data suggest that cell wall may function as a reserve of car-bon under severe sugar starving conditions, such as those found in starch-deficient mutants. In agreement with this hypothesis, cell wall metabolic genes were largely repressed at the end of the night in the mutants used in this work (Supplemental Data Sheet 4), when plants suffer sugar starvation due to the absence of photosynthesis.
Sugars are important signaling molecules for the coordination of plant metabolism (Rolland and Sheen, 2005). Five trehalose-phosphate synthases coding genes were part of the SSR network. Trehalose biosynthetic pathways are implicated in the crosstalk between central metabolism and development in several species (Paul et al., 2008). T6P, the trehalose precursor, is mandatory for the coordination of carbon utilization and plant growth, regulat-ing starch synthesis in plastids of higher plants (Eastmond and Graham, 2003). T6P is synthesized in the cytosol and acts on plastidial metabolism by promoting thioredoxin-mediated redox transfer to AGPase in response to cytosolic sugar levels, thereby allowing starch synthesis to be regulated independently of light. It has been shown that over-expression of T6P synthase increase T6P levels (Kolbe et al., 2005). We speculate that this type of mechanism could be induced in the starch-deficient mutant lines. T6P is also implicated in sugar signaling, altering downstream gene expression through the inhibition of SnRK1 (SNF1-related protein kinase). It has been proposed that the T6P/SnRK1 sig-naling pathway responds to sugar starvation enabling growth recovery under sink restriction (Nunes et al., 2013). Remarkably, three genes involved in SnRK1 signaling pathway were also part of the SSR network.
Genes involved on secondary pathways dependent of amino acids and lipids, such us cuticle glucosinolate, flavonoids, and
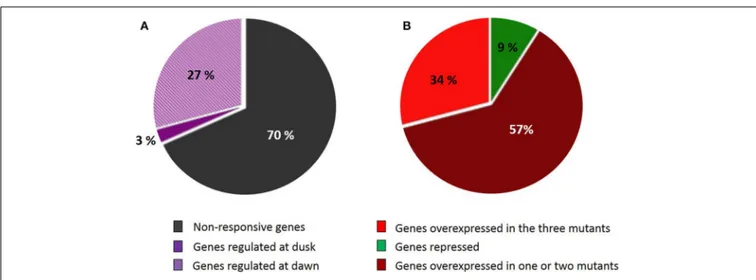
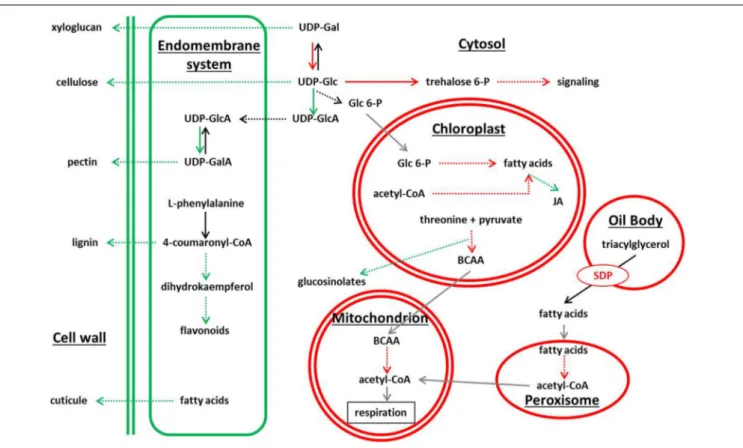
FIGURE 4 | Schematic view of metabolic pathways showing differential gene expression in adg1, adg1 be2 be3, and be2 be3 mutants. Green color
and red color correspond to pathways showing repressed genes and overexpressed genes, respectively.
phenylpropanoids metabolism (Baker et al., 2006; Pollard et al., 2008), were largely repressed in the starch-deficient mutants. Intriguingly, the chalcone-flavanone isomerase-like coding gene (At5g05270) was strongly repressed in the three mutant lines (Supplemental Data Sheet 7). This enzyme with unknown func-tion is the evolufunc-tionary connecfunc-tion between fatty acid and flavonoid metabolism (Ngaki et al., 2012), and our results suggest its implication in the sugar starvation syndrome. On the other hand, genes related with lipid metabolism were overexpressed in adg1, adg1 be2 be3, and be2 be3, and were highly connected in the SSR network. Surprisingly, SD1 a triacylglycerol hydrolase normally expressed in seed oil bodies, and ACX4 a short-chain acyl-CoA oxidase involved in fatty acid β-oxidation that takes place mostly during seed germination (Graham, 2008), were iden-tified as possible master regulators of the network. Other genes normally expressed in seeds and seedlings were also highly over-expressed in the three mutant lines: an oleosin present in oil bodies (At5g56100), a peroxin (At3g61070) member of a gene family that controls peroxisome proliferation, where occurs fatty acid degradation (Poirier et al., 2006), and also several genes involved in fatty acid β-oxidation. Interestingly, triacylglycerol hydrolysis plays a pivotal role in life cycle by providing the car-bon skeletons and energy that drive post-germination growth in several plants species (Eastmond, 2006). At seedling stage, lipid resources are mobilized to provide carbon and energy to sustain plants growth. The over-expression of these genes in the starch-deficient mutants is puzzling, suggesting that a metabolic switch
from starch metabolism to lipid metabolism take place in these plants (Figure 4).
CONCLUSIONS
It is generally accepted that plant growth is dependent on car-bohydrates availability. Plants are capable to adjust the rate of starch degradation during the night in order to avoid car-bon starvation, but in starch-deficient mutants this mechanism is not possible. Our data strongly suggest that under sugar starving conditions, plants can reallocate their metabolism to limit carbon starvation in a response transcriptionally coordi-nated. Less mandatory pathways such as cell wall biosynthesis and secondary metabolites biosynthesis are neglected as far as they don’t compromise plant survival and growth. Our data-driven co-expression network analysis has enlightened candidate regulators of the SSR network, in particular embryo-induced genes, usually not expressed in leaves. The overexpression of lipid metabolism embryo-induced genes at the end of the night in starch-deficient mutant lines strongly suggest a metabolic shift from autotrophy to heterotrophy in response to sugar starvation.
ACKNOWLEDGMENTS
This work was financially supported by ANR Génoplante (pro-gram ISD Starch 2006–2009), the Region Nord Pas de Calais and the FEDER (CPER; ARCir Plant TEQ5).
Arias et al. Arabidopsis sugar starving responsive network
SUPPLEMENTARY MATERIAL
The Supplementary Material for this article can be found online at: http://www.frontiersin.org/journal/10.3389/fpls.2014. 00482/abstract
REFERENCES
Abe, H., Urao, T., Ito, T., Seki, M., Shinozaki, K., and Yamaguchi-Shinozaki, K. (2003). Arabidopsis AtMYC2 (bHLH) and AtMYB2 (MYB) function as transcriptional activators in abscisic acid signaling. Plant Cell 15, 63–78. doi: 10.1105/tpc.006130
Aoki, K., Ogata, Y., and Shibata, D. (2007). Approaches for extracting practi-cal information from gene co-expression networks in plant biology. Plant Cell
Physiol. 48, 381–390. doi: 10.1093/pcp/pcm013
Avonce, N., Mendoza-Vargas, A., Morett, E., and Iturriaga, G. (2006). Insights on the evolution of trehalose biosynthesis. BMC Evol. Biol. 6:15. doi: 10.1186/1471-2148-6-109
Baker, A., Graham, I. A., Holdsworth, M., Smith, S. M., and Theodoulou, F. L. (2006). Chewing the fat: [beta]-oxidation in signalling and development. Trends
Plant Sci. 11, 124–132. doi: 10.1016/j.tplants.2005.01.005
Ball, S. G., and Morell, M. K. (2003). From bacterial glycogen to starch: under-standing the biogenesis of the plant starch granule. Annu. Rev. Plant Biol. 54, 207–233. doi: 10.1146/annurev.arplant.54.031902.134927
Barabasi, A. L., and Oltvai, Z. N. (2004). Network biology: understanding the cell’s functional organization. Nat. Rev. Genet. 5, 101–113. doi: 10.1038/nrg1272 Barber, C., Rosti, J., Rawat, A., Findlay, K., Roberts, K., and Seifert, G. J.
(2006). Distinct properties of the five UDP-D-glucose/UDP-D-galactose 4-epimerase isoforms of Arabidopsis thaliana. J. Biol. Chem. 281, 17276–17285. doi: 10.1074/jbc.M512727200
Besseau, S., Hoffmann, L., Geoffroy, P., Lapierre, C., Pollet, B., and Legrand, M. (2007). Flavonoid accumulation in Arabidopsis repressed in lignin syn-thesis affects auxin transport and plant growth. Plant Cell 19, 148–162. doi: 10.1105/tpc.106.044495
Binder, S., Knill, T., and Schuster, J. (2007). Branched-chain amino acid metabolism in higher plants. Physiol. Plant. 129, 68–78. doi: 10.1111/j.1399-3054.2006.00800.x
Blasing, O. E., Gibon, Y., Gunther, M., Hohne, M., Morcuende, R., Osuna, D., et al. (2005). Sugars and circadian regulation make major contributions to the global regulation of diurnal gene expression in Arabidopsis. Plant Cell 17, 3257–3281. doi: 10.1105/tpc.105.035261
Boyer, R. S., and Moore, J. S. (1977). A fast string searching algorithm. Commun.
ACM 20, 762–772. doi: 10.1145/359842.359859
Boyes, D. C., Zayed, A. M., Ascenzi, R., McCaskill, A. J., Hoffman, N. E., Davis, K. R., et al. (2001). Growth stage-based phenotypic analysis of arabidopsis: a model for high throughput functional genomics in plants. Plant Cell 13, 1499–1510. doi: 10.1105/tpc.13.7.1499
Buleon, A., Colonna, P., Planchot, V., and Ball, S. (1998). Starch granules: struc-ture and biosynthesis. Int. J. Biol. Macromol. 23, 85–112. doi: 10.1016/S0141-8130(98)00040-3
Casal, J., and Yanovsky, M. (2005). Regulation of gene expression by light. Int. J.
Dev. Biol. 49, 501–511. doi: 10.1387/ijdb.051973jc
Cline, M. S., Smoot, M., Cerami, E., Kuchinsky, A., Landys, N., Workman, C., et al. (2007). Integration of biological networks and gene expression data using Cytoscape. Nat. Protoc. 2, 2366–2382. doi: 10.1038/nprot.2007.324
Crowe, M. L., Serizet, C., Thareau, V., Aubourg, B., Rouze, P., Hilson, P., et al. (2003). CATMA: a complete Arabidopsis GST database. Nucleic Acids Res. 31, 156–158. doi: 10.1093/nar/gkg071
D’Auria, J. C., and Gershenzon, J. (2005). The secondary metabolism of Arabidopsis
thaliana: growing like a weed. Curr. Opin. Plant Biol. 8, 308–316. doi:
10.1016/j.pbi.2005.03.012
D’Haeseleer, P. (2005). How does gene expression clustering work? Nat. Biotechnol. 23, 1499–1501. doi: 10.1038/nbt1205-1499
Duggleby, R. G., McCourt, J. A., and Guddat, L. W. (2008). Structure and mecha-nism of inhibition of plant acetohydroxyacid synthase. Plant Physiol. Biochem. 46, 309–324. doi: 10.1016/j.plaphy.2007.12.004
Dumez, S., Wattebled, F., Dauvillee, D., Delvalle, D., Planchot, V., Ball, S. G., et al. (2006). Mutants of Arabidopsis lacking starch branching enzyme II substitute plastidial starch synthesis by cytoplasmic maltose accumulation. Plant Cell 18, 2694–2709. doi: 10.1105/tpc.105.037671
Eastmond, P. J. (2006). SUGAR-DEPENDENT1 encodes a patatin domain triacyl-glycerol lipase that initiates storage oil breakdown in germinating Arabidopsis seeds. Plant Cell 18, 665–675. doi: 10.1105/tpc.105.040543
Eastmond, P. J., and Graham, I. A. (2003). Trehalose metabolism: a regula-tory role for trehalose-6-phosphate? Curr. Opin. Plant Biol. 6, 231–235. doi: 10.1016/S1369-5266(03)00037-2
Eisen, M. B., Spellman, P. T., Brown, P. O., and Botstein, D. (1998). Cluster analysis and display of genome-wide expression patterns. Proc. Natl. Acad. Sci. U.S.A. 95, 14863–14868. doi: 10.1073/pnas.95.25.14863
Fankhauser, C., and Chory, J. (1997). Light control of plant develop-ment. Annu. Rev. Plant Physiol. Plant Mol. Biol. 13, 203–229. doi: 10.1146/annurev.cellbio.13.1.203
Franklin, K., Larner, V., and Whitelam, G. (2005). The signal transducing photore-ceptors of plants. Int. J. Dev. Biol. 49, 501–511. doi: 10.1387/ijdb.051989kf Gagnot, S., Tamby, J. P., Martin-Magniette, M. L., Bitton, F., Taconnat, L.,
Balzergue, S., et al. (2008). CATdb: a public access to Arabidopsis transcriptome data from the URGV-CATMA platform. Nucleic Acids Res. 36, D986–D990. doi: 10.1093/nar/gkm757
Gao, D., Huibers, R., Loonen, A., Visser, R., Wolters, A.-M., and Bai, Y. (2014). Down-regulation of acetolactate synthase compromises Ol-1- mediated resis-tance to powdery mildew in tomato. BMC Plant Biol. 14:32. doi: 10.1186/1471-2229-14-32
Ge, Y. C., Dudoit, S., and Speed, T. P. (2003). Resampling-based multiple testing for microarray data analysis. Test 12, 1–77. doi: 10.1007/BF02595811
Gibson, S. (2005). Control of plant development and gene expression by sugar signaling. Curr. Opin. Plant Biol. 8, 93–102. doi: 10.1016/j.pbi.2004.11.003 Giuliano, G., Pichersky, E., Malik, V. S., Timko, M. P., Scolnik, P. A., and Cashmore,
A. R. (1988). An evolutionarily conserved protein-binding sequence upstream of a plant light-regulated gene. Proc. Natl. Acad. Sci. U.S.A. 85, 7089–7093. doi: 10.1073/pnas.85.19.7089
Gonzali, S., Loreti, E., Solfanelli, C., Novi, G., Alpi, A., and Perata, P. (2006). Identification of sugar-modulated genes and evidence for in vivo sugar sensing in Arabidopsis. J. Plant Res. 119, 115–123. doi: 10.1007/s10265-005-0251-1 Graf, A., Schlereth, A., Stitt, M., and Smith, A. M. (2010). Circadian control of
carbohydrate availability for growth in Arabidopsis plants at night. Proc. Natl.
Acad. Sci. U.S.A. 107, 9458–9463. doi: 10.1073/pnas.0914299107
Graham, I. A. (2008). Seed storage oil mobilization. Annu. Rev. Plant Biol. 59, 115–142. doi: 10.1146/annurev.arplant.59.032607.092938
Gutierez, R. A., Stokes, T. L., Thum, K., Xu, X., Obertello, M., Katari, M. S., et al. (2008). Systems approach identifies an organic nitrogen-responsive gene net-work that is regulated by the master clock control gene CCA1. Proc. Natl. Acad.
Sci. U.S.A. 105, 4939–4944. doi: 10.1073/pnas.0800211105
Hanson, J., Hanssen, M., Wiese, A., Hendriks, M., and Smeekens, S. (2008). The sucrose regulated transcription factor bZIP11 affects amino acid metabolism by regulating the expression of ASPARAGINE SYNTHETASE1 and PROLINE DEHYDROGENASE2. Plant J. 53, 935–949. doi: 10.1111/j.1365-313X.2007.03385.x
Hey, S. J., Byrne, E., and Halford, N. G. (2010). The interface between metabolic and stress signalling. Ann. Bot. 105, 197–203. doi: 10.1093/aob/mcp285 Hilson, P., Allemeersch, J., Altmann, T., Aubourg, S., Avon, A., Beynon, J.,
et al. (2004). Versatile gene-specific sequence tags for Arabidopsis functional genomics: trancript profiling and reverse genetics applications. Genome Res. 14, 2176–2189. doi: 10.1101/gr.2544504
Koch, K. (2004). Sucrose metabolism: regulatory mechanisms and pivotal roles in sugar sensing and plant development. Curr. Opin. Plant Biol. 7, 235–246. doi: 10.1016/j.pbi.2004.03.014
Kolbe, A., Tiessen, A., Schluepmann, H., Paul, M., Ulrich, S., and Geigenberger, P. (2005). Trehalose 6-phosphate regulates starch synthesis via posttransla-tional redox activation of ADP-glucose pyrophosphorylase. Proc. Natl. Acad. Sci.
U.S.A. 102, 11118–11123. doi: 10.1073/pnas.0503410102
Kotting, O., Kossmann, J., Zeeman, S. C., and Lloyd, J. R. (2010). Regulation of starch metabolism: the age of enlightenment? Curr. Opin. Plant Biol. 13, 321–329. doi: 10.1016/j.pbi.2010.01.003
Lastdrager, J., Hanson, J., and Smeekens, S. (2014). Sugar signals and the control of plant growth and development. J. Exp. Bot. 65, 799–807. doi: 10.1093/jxb/ ert474
Lee, E. J., Matsumura, Y., Soga, K., Hoson, T., and Koizumi, N. (2007). Glycosyl hydrolases of cell wall are induced by sugar starvation in Arabidopsis. Plant Cell
Lerouxel, O., Cavalier, D. M., Liepman, A. H., and Keegstra, K. (2006). Biosynthesis of plant cell wall polysaccharides—a complex process. Curr. Opin. Plant Biol. 9, 621–630. doi: 10.1016/j.pbi.2006.09.009
Lisso, J., Steinhauser, D., Altmann, T., Kopka, J., and Mussig, C. (2005). Identification of brassinosteroid-related genes by means of transcript co-response analyses. Nucleic Acids Res. 33, 2685–2696. doi: 10.1093/nar/ gki566
Loreti, E., Povero, G., Novi, G., Solfanelli, C., Alpi, A., and Perata, P. (2008). Gibberellins, jasmonate and abscisic acid modulate the sucrose-induced expres-sion of anthocyanin biosynthetic genes in Arabidopsis. New Phytol. 179, 1004–1016. doi: 10.1111/j.1469-8137.2008.02511.x
Lurin, C., Andres, C., Aubourg, S., Bellaoui, M., Bitton, F., Bruyere, C., et al. (2004). Genome-wide analysis of Arabidopsis pentatricopeptide repeat proteins reveals their essential role in organelle biogenesis. Plant Cell 16, 2089–2103. doi: 10.1105/tpc.104.022236
Martin, T., Sharma, R., Sippel, C., Waegemann, K., Soll, J., and Vothknecht, U. C. (2006). A protein kinase family in Arabidopsis phosphorylates chloroplast pre-cursor proteins. J. Biol. Chem. 281, 40216–40223. doi: 10.1074/jbc.M606580200 Mentzen, W. I., Peng, J. L., Ransom, N., Nikolau, B. J., and Wurtele, E. S. (2008). Articulation of three core metabolic processes in Arabidopsis: fatty acid biosyn-thesis, leucine catabolism and starch metabolism. BMC Plant Biol. 8:76. doi: 10.1186/1471-2229-8-76
Miyashita, Y., and Good, A. G. (2008). NAD(H)-dependent glutamate dehy-drogenase is essential for the survival of Arabidopsis thaliana during dark-induced carbon starvation. J. Exp. Bot. 59, 667–680. doi: 10.1093/jxb/ erm340
Moore, B., Zhou, L., Rolland, F., Hall, Q., Cheng, W.-H., Liu, Y.-X., et al. (2003). Role of the Arabidopsis glucose sensor HXK1 in nutrient, light and hormonal signaling. Science 300, 332–336. doi: 10.1126/science.1080585
Ngaki, M. N., Louie, G. V., Philippe, R. N., Manning, G., Pojer, F., Bowman, M. E., et al. (2012). Evolution of the chalcone-isomerase fold from fatty-acid binding to stereospecific catalysis. Nature 485, 530–533. doi: 10.1038/nature11009 Nunes, C., O’Hara, L. E., Primavesi, L. F., Delatte, T. L., Schluepmann, H., Somsen,
G. W., et al. (2013). The trehalose 6-phosphate/SnRK1 signaling pathway primes growth recovery following relief of sink limitation. Plant Physiol. 162, 1720–1732. doi: 10.1104/pp.113.220657
O’Connor, T. R., Dyreson, C., and Wyrick, J. J. (2005). Athena: a resource for rapid visualization and systematic analysis of Arabidopsis promoter sequences.
Bioinformatics 21, 4411–4413. doi: 10.1093/bioinformatics/bti714
Osuna, D., Usadel, B., Morcuende, R., Gibon, Y., Blasing, O. E., Hohne, M., et al. (2007). Temporal responses of transcripts, enzyme activities and metabolites after adding sucrose to carbon-deprived Arabidopsis seedlings. Plant J. 49, 463–491. doi: 10.1111/j.1365-313X.2006.02979.x
Paul, M. J., Primavesi, L. F., Jhurreea, D., and Zhang, Y. H. (2008). Trehalose metabolism and signaling. Annu. Rev. Plant Biol. 59, 417–441. doi: 10.1146/annurev.arplant.59.032607.092945
Poirier, Y., Antonenkov, V. D., Glumoff, T., and Hiltunen, J. K. (2006). Peroxisomal beta-oxidation—a metabolic pathway with multiple func-tions. Biochim. Biophys. Acta. 1763, 1413–1426. doi: 10.1016/j.bbamcr.2006. 08.034
Pollard, M., Beisson, F., Li, Y. H., and Ohlrogge, J. B. (2008). Building lipid bar-riers: biosynthesis of cutin and suberin. Trends Plant Sci. 13, 236–246. doi: 10.1016/j.tplants.2008.03.003
Rolland, F., Baena-Gonzalez, E., and Sheen, J. (2006). Sugar sensing and signaling in plants: conserved and novel mechanisms. Annu. Rev. Plant Biol. 57, 675–709. doi: 10.1146/annurev.arplant.57.032905.105441
Rolland, F., and Sheen, J. (2005). Sugar sensing and signaling networks in plants.
Biochem. Soc. Trans. 33, 269–271. doi: 10.1042/BST0330269
Saito, R., Smoot, M. E., Ono, K., Ruscheinski, J., Wang, P. L., Lotia, S., et al. (2012). A travel guide to Cytoscape plugins. Nat. Methods 9, 1069–1076. doi: 10.1038/nmeth.2212
Scialdone, A., Mugford, S. T., Feike, D., Skeffington, A., Borrill, P., Graf, A., et al. (2013). Arabidopsis plants perform arithmetic division to prevent starvation at night. Elife 2:e00669. doi: 10.7554/eLife.00669
Seifert, G. J. (2004). Nucleotide sugar interconversions and cell wall biosynthesis: how to bring the inside to the outside. Curr. Opin. Plant Biol. 7, 277–284. doi: 10.1016/j.pbi.2004.03.004
Silvente, S., Reddy, P. M., Khandual, S., Blanco, L., Alvarado-Affantranger, X., Sanchez, F., et al. (2008). Evidence for sugar signalling in the regulation of asparagine synthetase gene expressed in Phaseolus vulgaris roots and nodules.
J. Exp. Bot. 59, 1279–1294. doi: 10.1093/jxb/ern034
Smith, A. M., and Stitt, M. (2007). Coordination of carbon supply and plant growth. Plant Cell Environ. 30, 1126–1149. doi: 10.1111/j.1365-3040.2007.01708.x
Srinivasasainagendra, V., Page, G. P., Mehta, T., Coulibaly, I., and Loraine, A. E. (2008). CressExpress: a tool for large-scale mining of expression data from Arabidopsis. Plant Physiol. 147, 1004–1016. doi: 10.1104/pp.107. 115535
Sulpice, R., Pyl, E. T., Ishihara, H., Trenkamp, S., Steinfath, M., Witucka-Wall, H., et al. (2009). Starch as a major integrator in the regulation of plant growth. Proc. Natl. Acad. Sci. U.S.A. 106, 10348–10353. doi: 10.1073/pnas. 0903478106
Tatematsu, K., Ward, S., Leyser, O., Kamiya, Y., and Nambara, E. (2005). Identification of cis-elements that regulate gene expression during initiation of axillary bud outgrowth in Arabidopsis. Plant Physiol. 138, 757–766. doi: 10.1104/pp.104.057984
Thum, K., Shin, M., Gutierrez, R., Mukherjee, I., Katari, M., Nero, D., et al. (2008). An integrated genetic, genomic and systems approach defines gene net-works regulated by the interaction of light and carbon signaling pathways in Arabidopsis. BMC Syst. Biol. 2:31. doi: 10.1186/1752-0509-2-31
Toufighi, K., Brady, S. M., Austin, R., Ly, E., and Provart, N. J. (2005). The botany array resource: e-Northerns, expression angling, and promoter analyses. Plant
J. 43, 153–163. doi: 10.1111/j.1365-313X.2005.02437.x
Conflict of Interest Statement: The authors declare that the research was
con-ducted in the absence of any commercial or financial relationships that could be construed as a potential conflict of interest.
Received: 13 August 2014; accepted: 31 August 2014; published online: 22 September 2014.
Citation: Arias MC, Pelletier S, Hilliou F, Wattebled F, Renou J-P and D’Hulst C (2014) From dusk till dawn: the Arabidopsis thaliana sugar starving responsive network. Front. Plant Sci. 5:482. doi: 10.3389/fpls.2014.00482
This article was submitted to Plant Biotechnology, a section of the journal Frontiers in Plant Science.
Copyright © 2014 Arias, Pelletier, Hilliou, Wattebled, Renou and D’Hulst. This is an open-access article distributed under the terms of the Creative Commons Attribution License (CC BY). The use, distribution or reproduction in other forums is permit-ted, provided the original author(s) or licensor are credited and that the original publication in this journal is cited, in accordance with accepted academic practice. No use, distribution or reproduction is permitted which does not comply with these terms.