HAL Id: hal-01264242
https://hal.archives-ouvertes.fr/hal-01264242
Submitted on 29 Jan 2016
HAL is a multi-disciplinary open access
archive for the deposit and dissemination of
sci-entific research documents, whether they are
pub-lished or not. The documents may come from
teaching and research institutions in France or
abroad, or from public or private research centers.
L’archive ouverte pluridisciplinaire HAL, est
destinée au dépôt et à la diffusion de documents
scientifiques de niveau recherche, publiés ou non,
émanant des établissements d’enseignement et de
recherche français ou étrangers, des laboratoires
publics ou privés.
Nuclear power fleet replacement: an opportunity for the
French energy mix?
Camille Cany, Christine Mansilla, Pascal da Costa, Gilles Mathonnière,
Thierry Duquesnoy, Anne Baschwitz
To cite this version:
Camille Cany, Christine Mansilla, Pascal da Costa, Gilles Mathonnière, Thierry Duquesnoy, et al..
Nuclear power fleet replacement: an opportunity for the French energy mix?. GLOBAL 2015. Nuclear
Fuel Cycle for a low-carbon future, Sep 2015, Paris, France. �hal-01264242�
Nuclear power fleet replacement:
an opportunity for the French energy mix?
Camille Cany1, 2, Christine Mansilla1, Pascal da Costa2, Gilles Mathonnière1, Thierry Duquesnoy1, Anne Baschwitz1
1 CEA, DEN, I-tésé, F-91191 Gif-sur-Yvette, France, christine.mansilla@cea.fr 2 Laboratoire de Génie Industriel / Epocc, Ecole Centrale Paris, Châtenay-Malabry, France
Abstract – In France, 27% of the electricity is to be produced by renewable resources by 2020.
This share is intended to grow continuously up to 2050. The recent European agreement and the French “energy transition law” will promote such a development. The French power system is characterized by high nuclear penetration and nuclear power is meant to remain a significant contributor in the medium and long term, as a low-carbon power source. More than half the French nuclear power fleet was installed in the late seventies / early eighties. Thus, the issue of its replacement is at the core of the French power mix issue. The objective of this paper is to provide some insights about the opportunity it enables for the energy mix. Two plausible replacement scenarios are developed and analyzed as regards the energy cost provided by nuclear power. For a given target level of nuclear installed capacities, the penetration of non-dispatchable renewables with dispatch priority will increase the need for nuclear power modulation at reduced average load factor. The impact of modulation on the nuclear levelized cost of electricity is assessed, according to the considered replacement scenario and for different renewable and nuclear energy penetration scenarios. Results show that, according to the selected assumptions, implementing a progressive shut-down (based on an increased operation lifetime of Nuclear Power Plants) appears a relevant choice since it both provides a lowest power production cost even at reduced average load factor to participate to load following and allows the possibility of “waiting” for choosing most sustainable technologies.
I. INTRODUCTION
The general 3X20 European directive proposes renewable penetration goals1. In France, 27% of the electricity is to be produced by renewable resources by 20202 and this share is intended to continuously grow up to 2050. In 2013, the share of renewable power already reached 18% of the domestic production, namely approximately 100 TWh3.
Among these resources, some are not dispatchable (i.e. they cannot be started (or stopped) at the Transmission System Operator request), which triggers challenges to maintain the reliability target level of the power system, both in the short and long term4,5. Wind and solar are expected to contribute to about 10% of the French electricity production in 20203,6, and according to voluntaristic scenarios they could contribute to over 50% of the total electricity production by 20507. The recent European agreement appears voluntaristic; by announcing a binding target of at least 27% of renewable energy used at the European level by 2030, and will promote such a development8.
The French power system is currently characterized by a high nuclear penetration: it supplied 82% of the French domestic consumption and 73% of the total demand (including exportations) in 20133. As a matter of fact, nuclear power is meant to remain a significant contributor to the French power system in the medium term, as a low-carbon power source.
More than half the French nuclear power fleet was installed in the late seventies / early eighties9. Thus, the issue of its replacement is at the core of the French power mix issue: the objective of this paper is to provide some insights about the opportunity it enables for the energy mix.
In an academic approach, first two plausible replacement scenarios are developed and analyzed as regards the energy cost provided by nuclear power, according to the composition of the nuclear mix. Then, different scenarios in terms of non-dispatchable renewable
Proceedings of Global 2015 September 20-24, 2015 - Paris (France) Paper 5044
and nuclear energy penetration are confronted in order to identify the availability for a “nuclear back-up”, in a low-carbon power mix perspective. Finally, the impact of modulation (loss of load factor) on the nuclear levelized cost of electricity is assessed, according to the considered replacement scenario.
II. NUCLEAR FLEET REPLACEMENT SCENARIOS II.A. Scenario Design
In order to investigate the issue of the nuclear fleet replacement with an academic viewpoint, two plausible scenarios have been designed as regards the French operational nuclear fleet. The first one is driven by the power plants’ age while the second one is designed to be progressive, in order to smooth the investment requirements:
- Current reactors are operated 40 years and then shut down (“40 yrs” scenario);
- The current fleet is progressively replaced to avoid massive investment in a short period of time: 2 GWe are shut down each year starting from 2017 (“prog.” scenario).
Other more progressive scenarios could also have been considered.
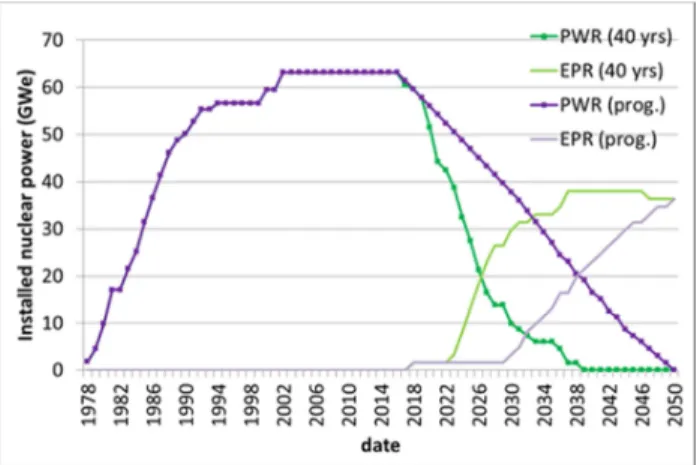
In each case, the current fleet made of Pressurized Water Reactors (PWR) is completed by Evolutionary Power Reactors (EPR™) in order to achieve the target nuclear penetration level of the selected scenario (an example is provided in Fig. 1 for a 50% nuclear penetration in terms of produced energy; the total energy production is assumed to be 543TWh (2012-2013 level)10, load factors are assumed to be 0.75 for PWRs and 0.8 for EPRs™). As a result, the installed capacity for each nuclear technology can be assessed according to the selected replacement scenario, as displayed in Fig. 1.
Fig. 1. PWR & EPR™ capacity evolution scenarios (for 50% nuclear penetration), own calculus
In both scenarios, the nuclear contribution to the total energy production of the power mix declines from 73% in 2015 to 50% in 2030, when it stabilizes at this level (for a 50% nuclear penetration case, as illustrated in Fig. 1. Other assumptions will be examined in sections III and IV).
In the “prog.” scenario, the PWRs shut down is slower than in the “40 yrs” scenario: for a given year, more PWRs are in operation for the same level of nuclear production capacity.
II.B. Impact on the Nuclear Fleet Production Cost The scenarios presented in the previous section have been established based on realistic expectations. They will result in different annual levelized production costs according to the composition of the nuclear mix:
- the Capex of the nuclear mix is computed from the share between amortized power plants (PWR) and recently installed ones (EPR ™);
- Opex and life extension costs (up to 2025) have also been included;
- Increased load factor is assumed for EPR™;
- A learning rate is assumed for the EPR™, investment cost is decreased from the first-of-a-kind to the tenth power plant, and then considered constant.
Recent cost assumptions are issued from the French Court of Auditors in-depth study of the nuclear costs in the French context11.
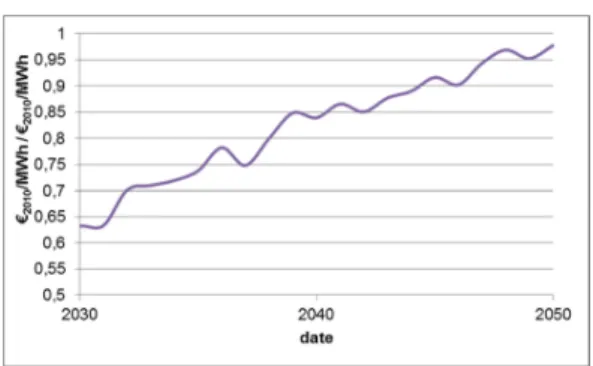
The nuclear annual levelized production cost of electricity is computed according to the retained assumptions and the nuclear fleet replacement scenario. To this end, the “Economic Current Cost” methodology has been retained for a discount rate of 7.8% (i.e. annual levelized production cost is assessed by annualizing the investment including interests over the selected amortization period. After this date, the investment burden is zero: this is the characteristic of this method). The results are presented on Fig. 2 for a 50% nuclear penetration in terms of produced energy, between 2030 and 2050: the two deadlines that will be considered in next sections. The ratio between the nuclear annual levelized cost of electricity for the “prog.” scenario and the “40 yrs” scenario is displayed in the figure.
In 2030, life extension costs are already taken into account. As a result, they do not appear on the Fig. 2 results.
Fig. 2. Ratio of the nuclear annual levelized cost of electricity between the “prog.” scenario and the “40 yrs” scenario (50% nuclear penetration), €2010/MWh / €2010/MWh, own calculus
In 2030, there are almost no more PWRs in the fleet for the “40 yrs” scenario (approx. 10 GW), whereas the PWR power is still significant in the “prog.” scenario (approx. 40 GW). As a result, from 2030 to 2050, the “prog.” nuclear generation cost appears less expensive, first because EPRs™ are introduced at a slower pace than in the “40 yrs” scenario, second because it takes advantage of amortized PWRs. The scenarios converge by 2050, since the nuclear fleet is only composed by EPRs™ by then, for both scenarios.
Thus, results highlight the interest of taking advantage of amortized power plants, as long as additional costs due to extended operating life are not too high.
III. TOWARDS A LOW-CARBON POWER MIX: RENEWABLE AND NUCLEAR PENETRATION
PROSPECTIVE SCENARIOS III.A. Scenario Design
The aim is to achieve a low-carbon power mix in the medium to long term, the so-called energy transition that needs to take into account the national specificities (power mix history and inertia, regional resources etc.).
In this respect, the French Government launched a broad national consultation on the energy transition in 201312. In this framework, several institutions designed energy prospective scenarios for France. They propose scenarios in terms of renewable and nuclear energy penetration.
The Institute for techno-economics of energy systems of the Commissariat à l’Energie Atomique et aux Energies Alternatives (CEA/I-tésé) was involved in the contribution of the ANCRE (Alliance Nationale de Coordination de la Recherche pour l’Energie, the French National Alliance for Energy Research Coordination), that proposed three contrasted scenarios that all satisfy the factor 4, i.e. a reduction by four of the greenhouse gas emissions in 2050, compared to the 1990 level6. The specificity of these scenarios is a voluntaristic approach in terms of scientific
and technological innovation. All these scenarios propose a similar non-dispatchable renewable penetration for a given time horizon, leading to a maximum energy penetration of 30% by 2050 (wind and solar). As regards nuclear power, two cases are considered: a 50% value (of the annual electricity production), in line with present status of the “energy transition law”, and a “high nuclear” case with a 65% value.
In order to consider an “extreme” scenario in terms of non-dispatchable renewable penetration, we also considered the scenario proposed by the ADEME (Agence de l’Environnement et de la Maîtrise de l’Energie, the French Environment and Energy Management Agency), which examines the case of 50% non-dispatchable renewable penetration by 20507. The ADEME also considered lower nuclear penetration (down to 20%).
At the opposite, as regards nuclear power contribution to the French electricity mix, we also considered a “business-as-usual” value of 75%, which corresponds to the nuclear current contribution to the French annual electricity production3.
Table I and Table II gather the assumptions selected for non-dispatchable renewable resources and nuclear share in the total French power production according to the ANCRE and ADEME scenarios.
TABLE I
Renewable energy penetration scenarios (% of produced energy) Time horizon Wind penetration (%) Solar penetration (%) Total (%) Reference 2015 5 % 1 % 6 % ANCRE6 2020 8 % 2 % 10 % ANCRE6 2025 10 % 3 % 13 % ANCRE6 2030 12 % 4.5 % 16.5 % ANCRE6 2040 16 % 7 % 23 % ANCRE6 2050 20 % 10 % 30 % ANCRE6 2050 30 % 15 % 45 % ADEME7 2050 35 % 15 % 50 % ADEME7 TABLE II
Nuclear energy penetration scenarios (% of produced energy)
Nuclear penetration Reference scenario
75 % Business-as-usual
65 % High nuclear in ANCRE6
50 % Low nuclear in ANCRE
6
or High nuclear in ADEME7
Proceedings of Global 2015 September 20-24, 2015 - Paris (France) Paper 5044
From them, we established generic scenarios by crossing the renewable and nuclear penetration assumptions, and studied each of them. For readability issues, only three contrasted cases will be presented in the results. They provide conceivable target capacities in line with the current energy policy as regards renewable energy development and the specific French context characterized by the significant place of nuclear power in the power mix:
1. “median scenario” (med): 16.5% wind and solar in 2030, 30% in 2050, 50% nuclear in both cases;
2. “high nuclear scenario” (high nuc): 65% nuclear, wind and solar shares as in the median case;
3. “high non-dispatchable renewable scenario” (high ren): 30% wind and solar in 2030, 50% in 2050, 50% nuclear in both cases.
In each scenario, we deliberately focus on nuclear and non-dispatchable renewable resources without clarifying the remaining part of the energy production which is off topic here.
III.B. Impact on the Nuclear Fleet Load Factor Renewable resources have today a dispatch priority: they have a priority access to the grid and the rest of the power system should adapt to renewable energy production. To assess the impacts of non-dispatchable renewable resources on other power plants capacity requirements and annual productions in a power system, two major types of approaches can be distinguished.
First, the construction of load duration curves net of wind and solar (called “residual” in what follows) for different wind and solar penetration levels allows determining the optimal mix of other generation resources in the long term14,15,16.
Secondly, a minimum cost economic dispatch model can serve refining the general trends obtained from the first approach 14,15,17,18. The use of such a time step model allows short term supply and demand balancing in response to technical, economic and political constraints.
We focus here on the first approach to put a light on general trends in the long term.
The developed methodology proceeds in several steps. On the one hand, the construction of annual residual load duration curves allows assessing the annual energy production to be fulfilled by dispatchable power plants. The need for nuclear energy production is then deduced knowing its contribution to the system as a “baseload” power. On the other hand, nuclear load following dedicated energy is evaluated based on the realistic French nuclear fleet scenarios that were presented in the previous section. Thanks to the annual residual load duration curves, we evaluate and compare nuclear fleet effective full power hours.
III.B.1. Construction of Annual Residual Load Duration Curves
A load duration curve represents the sorted hourly load of one year, starting with the highest load hour. The residual load curve is obtained by withdrawing the wind and solar production to the total annual production (considered constant on an annual cumulated basis in this study, hourly variations have been computed into the residual load duration curve based on the historical data from the French Transmission System Operator (RTE)). Wind and solar production was estimated by calculating mean hourly power values of historical data (between 2010 and 2013) also from RTE10, and by calibrating their hourly power to fit their assumed energy penetration level to satisfy a given demand (cf. Table I). The resulting curves are displayed on Fig. 3.
Even if wind and solar penetrations are aggregated in the displayed rates, separate assumptions were considered and the corresponding production profiles were treated separately in the calculations.
It should also be noted that the considered demand, to which wind and solar production are withdrawn, actually includes the exportations. Thus, exportations are assumed exogenous. Additional exportations in case of excess capacities for certain hours may be of interest, if the interconnection capacities allow it.
Fig. 3. Residual load duration curves according to the renewable penetration, own calculus
III.B.2. Assessment of Nuclear Modulation Availability As regards the use of nuclear power, we retained an empirical approach based on the historical availability factor of nuclear in France (return on operating experience)9. The selected value is 7000 hours. This value is used to assess the “baseload” nuclear power (called Pbaseload in what follows), according to the residual load to
supply. The “baseload” nuclear production (corresponding to an installed capacity of Pbaseload) will then be compared
to the nuclear production corresponding to the installed nuclear power provided by the selected scenario, to assess the available load following available energy (cf. Fig. 4).
Fig. 4. Example of assessment of the nuclear power modulation capacity (“high nuc” 2030), own calculus
Firstly, scenarios are compared through the corresponding “baseload” nuclear production. We adapted Fig. 4 to each renewable penetration scenario and calculated the share of the total annual electricity production (i.e. 543TWh) that would be provided by nuclear, according to the renewable penetration, when nuclear is operated at least 7000 hours per year. Results are displayed in Table III.
TABLE III
“Baseload” nuclear contribution to satisfy the total power production according to the renewable penetration
(% of produced energy), own calculus
Renewable penetration (%) Baseload Nuclear penetration (%) 16.5 57 30 41 50 17
From this table, we can point out that, for 16.5% renewable penetration, 57% of the electricity should be supplied by nuclear as “baseload”, according to the retained assumptions. Hence, 50% nuclear penetration (corresponding to the “med” scenario in 2030), would be underestimated compared to the “baseload” reference and thus no nuclear load following capacity would be available.
III.B.3. Assessment of Nuclear Load Factor according to Renewable Penetration
When the nuclear share is higher than what was identified in Table III as the “baseload” power, some load following capacity is available. In other words, the average nuclear load factor is decreased for the total fleet. Table IV presents the results according to the scenarios, as the load factor reduction compared to the “med 2030” case for which there is no modulation (“Ref” case).
TABLE IV
Nuclear average load factor reduction for the total fleet, own calculus
Scenario 2030 2050
med Ref -9%
high nuc -5% -19%
high ren -9% -32%
Nuclear power would then contribute to a higher extent to balancing services. Further R&D works are still needed though, to verify if implementing higher modulation needs appears feasible from both technical and economic viewpoints. The relevance of operating nuclear power plants with low load factors would be indeed highly linked with payments for grid services (i.e. reduction of system costs). Other tracks should also be explored, such as taking advantage from the available energy to produce valuable services and products. Detailed business models are still to be developed in this field.
IV. CONFRONTING THE NUCLEAR FLEET REPLACEMENT SCENARIOS
Considering the nuclear and renewable penetration scenarios that have been defined in section III (med, high nuc, high ren), and the nuclear fleet replacement scenarios that have been presented in section II, we are now confronting the nuclear fleet cost resulting from both the renewable and nuclear energy penetration (impact of load
Proceedings of Global 2015 September 20-24, 2015 - Paris (France) Paper 5044
factor reduction), and selected fleet replacement (impact of the nuclear fleet composition). For each nuclear penetration scenario and nuclear fleet replacement policy, the nuclear annual production costs are calculated based on the total nuclear annual production (i.e. the load factor assessment depending on the wind and solar penetration scenario, cf. Fig.4).
By 2050, both nuclear replacement scenarios lead to a fleet made of EPR™ exclusively, hence costs converge. In what follows, we focus on 2030 to point out differences between scenarios.
In section II, it was shown that in 2030, the “prog.” scenario leads to lower nuclear production costs than the “40 yrs” scenario. In section III, it was highlighted that nuclear load following (particularly resulting from renewable dispatch priority) induced reduced average load factors, hence higher production costs.
Therefore, the question arises: is the nuclear “prog.” replacement scenario still cheaper than the “40 yrs” scenario, even when operating the nuclear fleet in a load following mode? To answer this question, the comparison is carried out against the “40 yrs” replacement scenario with nuclear operating as “baseload” (cf. section III).
We compare annual levelized production costs in the two following cases:
Case 1: for 16.5% renewable penetration in 2030, “high nuc” scenario (65% nuclear), with a nuclear fleet composition derived from the “prog.” scenario, costs are compared to the “baseload” nuclear penetration with a nuclear fleet composition derived from the “40 yrs” scenario.
Case 2: for 30% renewable penetration in 2030, “high ren” scenario (50% nuclear), with a nuclear fleet composition derived from the “prog.” Scenario, costs are compared to the “baseload” nuclear penetration with a nuclear fleet composition derived from the “40 yrs” scenario.
Relative differences of nuclear annual levelized costs for case 1 and 2 are displayed in Table V.
TABLE V
Relative difference between the annual nuclear levelized production cost for case 1 and case 2 in 2030, own calculus
Case 1 (“high nuc” /
“baseload”) - 25 %
Case 2 (“high ren” /
“baseload”) - 33 %
For 16.5% and 30% non-dispatchable renewable penetration in 2030, the “prog” scenario nuclear replacement policy allows to consider the possibility for nuclear to operate at reduced load factors in order to participate in load following. Indeed, in such case, the annual nuclear levelized production cost still remains lower than the case with nuclear operating as “baseload” with a “40 yrs” replacement policy. It makes it possible to take advantage of the amortized power plants, the history of the French power mix.
Besides enabling a lower production cost for the nuclear fleet, smoothing the replacement of the nuclear capacities would be also beneficial for the whole power mix. Indeed, in the case of which nuclear power would be partly replaced by renewables, delaying somewhat the capacity replacement makes it possible to “wait” for cheaper technologies and possibly reduce the overall production cost. In such a case, effective capacity credits should be taken into account according to the nature of the renewable resource and the level of penetration into the power mix. As a matter of fact, to replace a given capacity of dispatchable power, higher amounts of non-dispatchable resources are needed due to intermittency issues. Renewable capacity credits tend to decrease with higher penetration levels15.
V. CONCLUSIONS
In the French current electricity mix which is characterized by a high share of nuclear power, and in the context of current design of energy transition policies, the nuclear fleet replacement is a central issue.
To examine it with an academic viewpoint, we designed and proposed prospective scenarios in terms of renewable and nuclear power, together with nuclear fleet replacement scenarios.
Results showed that, according to the retained assumptions of the present study, implementing a progressive shut-down (i.e. with a longer lifetime of PWRs) appears a relevant choice since it both provides a lowest nuclear power production cost even at reduced load factors to participate in load following, and allows “waiting” for choosing most sustainable technologies.
In other words, even if the political guidelines are in favour of a reduction of electricity produced by nuclear plants, if nuclear power capacities are maintained so that it opens room for participation in load following, there is a strong interest in opting for a progressive replacement of PWRs by EPRs™ in order to cope with the intermittence of variable renewable resources.
First studies demonstrated that, to reach a low-carbon power mix, both nuclear and renewables are needed, in a strongly-interconnected energy system perspective19. In such a synergistic power system, both nuclear power plant flexibility and nuclear plant operation time extension should be examined, also by considering novel uses. New economic tools have to be built to address these important questions.
ACKNOWLEDGMENTS
This work was carried out in the framework of a PhD thesis. The authors want to thank J. C. Bocquet, Head of the Laboratoire de Génie Industriel, and J. G. Devezeaux de Lavergne, Head of the Institute for techno-economics of energy systems (I-tésé) for the fruitful discussions.
REFERENCES
1. EUROPEAN DIRECTIVE 2009/28/CE (23 Apr. 2009).
2. MINISTERE DE L’ECOLOGIE, DE L’ENERGIE, DU DEVELOPPEMENT DURABLE ET DE LA MER, Plan d’action national en faveur des énergies
renouvelables. Période 2009-2020. En application de l’article 4 de la Directive 2009/28/CE de l’Union Européenne (2009).
3. RTE, Bilan prévisionnel de l’équilibre offre-demande
d’électricité en France – édition 2014 (2014).
Available:
http://www.rte-france.com/sites/default/files/bilan_complet_2014.pdf 4. R. GROSS, P. Heptonstall, D. Anderson, T. Green, M.
Leach et al., The costs and impacts of intermittency:
an assessment of the evidence on the costs and impacts of intermittent generation on the British electricity network, UK Energy Research Centre, London, UK
(Mar. 2006).
5. E. HART, E. D. Stoutenburg, and M. Z. Jacobson, “The potential of intermittent renewables to meet electric power demand: current methods and emerging analytical techniques”, Proc. of the IEEE, Vol. 100(2), p. 322-334 (Feb. 2012).
6. ANCRE, Scénarios de l’ANCRE pour la transition
énergétique (2013).
7. ADEME, L’exercice de prospective de l’ADEME :
Vision 2030-2050 (Jun. 2013).
8. EUROPEAN COMMISSION, Energy and climate
goals for 2030 (2014). Available: http://ec.europa.eu/energy/2030_en.htm
9. IAEA, Power Reactor Information System (PRIS) database. Available: http://www.iaea.org/pris/
10. RTE database. Available:
http://www.rte-france.com/fr/developpement-durable/eco2mix/telechargement-de-donnees 11. COUR DES COMPTES, Les coûts de la filière
électronucléaire, Rapport public thématique, Paris,
France (Jan. 2012).
12. MINISTERE DE L’ECOLOGIE, DU
DEVELOPPEMENT DURABLE ET DE
L’ENERGIE, Synthèse des travaux du débat national
sur la transition énergétique de la France, Conseil
National du Déba (Jul. 2013). 13. RTE, Bilan électrique 2013 (2013).
14. C. D. DAVIS, D. J. Gotham, P. V. Preckel, and A. L. Liu, “Determining the impact of wind on system costs via the temporal patterns of load and wind generation”, Energy Policy, 60, 122-131 ( Sept. 2013). 15. J. H. KEPPLER and M. Cometto, Nuclear energy and
renewables: system effects in low-carbon electricity systems, Nuclear Energy Agency, OECD, Paris, France
(2012).
16. F. UECKERDT, L. Hirth, G. Luderer, and O. Edenhofer, “System LCOE: What are the costs of variable renewables?”, Energy, 63, 61-75 (Dec. 2013). 17. D. CONNOLLY, H. Lund, B. V. Mathiesen, and M.
Leahy, “Modelling the existing Irish energy-system to identify future energy costs and the maximum wind penetration feasible”, Energy, 35, 2164-2173 (Mar. 2010).
18. M. BARNACLE, E. Robertson, S. Galloway, J. Barton, and G. Ault, “Modelling generation and infrastructure requirements for transition pathways”,
Energy Policy, 52, 60-75 (May 2012).
19. P. CAUMON, M. Lopez-Botet Zulueta, J. Louyrette, S. Albou, C. Bourasseau, C. Mansilla, “Flexible hydrogen production implementation in the French power system: expected impacts at the French and European levels”, Energy, 81, 556-562 (March 2015).