HAL Id: hal-02330748
https://hal.archives-ouvertes.fr/hal-02330748
Submitted on 18 Nov 2019
HAL is a multi-disciplinary open access
archive for the deposit and dissemination of
sci-entific research documents, whether they are
pub-lished or not. The documents may come from
teaching and research institutions in France or
abroad, or from public or private research centers.
L’archive ouverte pluridisciplinaire HAL, est
destinée au dépôt et à la diffusion de documents
scientifiques de niveau recherche, publiés ou non,
émanant des établissements d’enseignement et de
recherche français ou étrangers, des laboratoires
publics ou privés.
An analysis of large-scale transmission power blackouts
from 2005 to 2016
Maxime Velay, Meritxell Vinyals, Yvon Besanger, Nicolas Retière
To cite this version:
Maxime Velay, Meritxell Vinyals, Yvon Besanger, Nicolas Retière. An analysis of large-scale
transmis-sion power blackouts from 2005 to 2016. 2018 53rd International Universities Power Engineering
Con-ference (UPEC), Sep 2018, Glasgow, United Kingdom. pp.8541901, �10.1109/UPEC.2018.8541901�.
�hal-02330748�
An analysis of large-scale transmission power blackouts from 2005 to 2016
M. Velaya,b, M. Vinyalsa, Y. Besangerb, N. Retiereb
aCEA, LIST, Laboratoire d’Analyse des Donn´ees et d’Intelligence des Syst`emes, Gif-sur-Yvette, 91191 France bUniv. Grenoble Alpes, CNRS, Grenoble INP0, G2Elab, 38000 Grenoble, France
Abstract
Major power failures, i.e. power transmission blackouts, have large technical, economic, and social consequences in the affected areas. As power systems evolve with new customs, technologies and regulations, continuous analysis of recent blackouts is crucial for identifying new trends and for updating prevention measures.
In this paper, we analyze 9 major blackouts that happened between 2005 and 2016, among them some of the largest blackouts of all times, to complete previous blackout studies. We classify these blackouts depending on the conditions and events before and during the cascades and identify their main characteristics. Our analysis reveals that blackouts from the last decade tend to exhibit different features than precedents; in particular they happened in periods of normal loading with some important equipment out of service and with highly dependent transmission systems regions. Moreover, recent blackouts show a greater tendency to enter directly into the fast cascade, leaving system operators with hardly any time to take any countermeasure.
Keywords: Large scale blackout, cascading failure, cascade analysis, power system stability, cascade prevention
0
1. Introduction
Our societies are more dependent on electricity than ever, thus any power outage, i.e. blackout, has a major economic and social impact. For example, in 2011, the blackout of southern California, Arizona and Baja California regions [1] cost around 100 million dollars [2].
The actual path to a blackout involves a complex, interde-pendent sequence of events. As depicted in Fig. 1, following [3, 4, 5], the progression of the cascade of events can be di-vided into 4 phases. The first phase is called (I) preconditions and it includes the period before any major disturbance, when the power system is in a stable state (i.e. all technical and op-erational constraints are respected). The blackout in itself starts by a set of initiating events that disturbs the power system and makes it unstable. This initial disturbance propagates in the form of a cascade of events that can last from a few seconds to several hours. The cascade can usually be separated into two phases: (II) steady state (also known as slow) and (III) fast (also known as high-speed). When the blackout reaches its final state (i.e. when the cascade ends), unserved loads, power genera-tion shed and the number of people impacted can be evaluated (i.e. to be considered a blackout either part or the entire sys-tem should have collapsed). The (IV) restoration of the syssys-tem
Email addresses: maxime.velay@cea.fr /
maxime.velay@g2elab.grenoble-inp.fr(M. Velay),
meritxell.vinyals@cea.fr(M. Vinyals),
yvon.besanger@g2elab.grenoble-inp.fr(Y. Besanger),
nicolas.retiere@univ-grenoble-alpes.fr(N. Retiere)
0Institute of Engineering Univ. Grenoble Alpes
starts from this point and takes from tens of minutes to several days to achieve full recovery.
Figure 1: Division of the progression of a blackout into phases as proposed in [5].
Continuous data analysis of previous blackouts is crucial for controlling their perpetual evolution as well as for drawing effective recommendations for their prevention [6, 7, 8]. Con-sequently, the vulnerability of power systems and, in particular, previous blackouts have been widely studied to improve power systems reliability [9, 10, 11, 12]. Despite this activity in the field, none of the existing studies cover the last decade period (i.e. from 2005 to 2016). This period during which the power electricity grid experienced significant evolutions (e.g., ener-getic transition, instrumentation and control automation and de-mand increase, among others [11]) includes some of the largest blackouts in history.
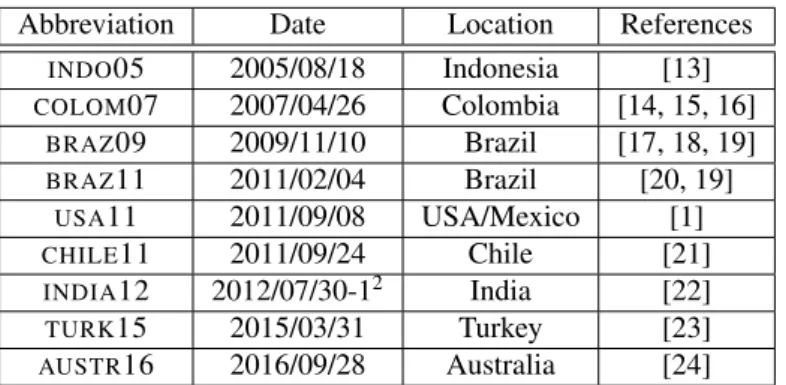
Against this background, this paper analyzes 9 recent major power blackouts that occurred between 2005 and 20161to com-plete previous studies. Table 1 provides details for each of these blackouts: the abbreviation used in the rest of the paper, the date, the location and the main references on which we based our analysis. Note that the development of these power systems was not done at the same time nor with the same technologies
in all countries; in particular, the analysis contains only two long-time developed power system, i.e. USA11 and AUSTR16.
Table 1: Details of the 8 blackout analyzed.
Abbreviation Date Location References
INDO05 2005/08/18 Indonesia [13] COLOM07 2007/04/26 Colombia [14, 15, 16] BRAZ09 2009/11/10 Brazil [17, 18, 19] BRAZ11 2011/02/04 Brazil [20, 19] USA11 2011/09/08 USA/Mexico [1] CHILE11 2011/09/24 Chile [21] INDIA12 2012/07/30-12 India [22] TURK15 2015/03/31 Turkey [23] AUSTR16 2016/09/28 Australia [24]
Our objective with this analysis is to identify the more fre-quent characteristics of these recent blackouts to update and contribute to the understanding of cascading events, which in its turn will allow reliability standards and defense plans to evolve in consequence. To that end, we describe, classify and make a careful comparison of these blackouts with the findings and conclusions of previous studies, especially those that focus on different time periods. In addition, as highlighted in [6], a ma-jor issue while simulating blackouts is to choose the cases to be studied, we thus provide a sketch of a representative scenario built on our analysis.
This paper is organized as follows. First, we review the related literature in Section 2. Afterward, the rest of the paper is organized following the different blackout phases: Section 3 analyzes the most relevant preconditions that enabled these blackouts to happen, Section 4 describes the initiating events and Section 5 analyzes the cascades of events that followed. The paper concludes in Section 6 with the main findings from this analysis and discussion of future work.
2. Related Work
Given the large economic and social impact of blackouts, a variety of methods have been proposed in the power system literature to study this challenging topic. Baldick et al. [6] and Vaiman et al. [7] provide comprehensive reviews on this area and discuss the main methods for cascading failure anal-ysis and simulations. Of particular interest here, both works highlight the importance of previous blackout data analysis for the progress of the field towards effective methods for blackout risk assessment. Consequently, several studies have been pub-lished on the analysis of the cascading failures, each covering a
2Two blackouts happened on two consecutive days. Operators had time to restore the system before the second blackout happened. Since pre-conditions and initiating events are of same nature, we will only develop the differences in the description of the cascade.
specific time period. For instance, in [9], Atputharajah et al. de-scribe the causes and the development of 9 blackouts that hap-pened between 1965 and 2007, highlighting the role of reactive power reserves, which ensure voltage stability, and of the volt-age angle phases difference, which keep regions synchronized. In a similar line of work, Yamashita et al. [10] analyze the causes and the sequence of events that led to 4 blackouts within the period from 1996 to 2006 to find patterns of sequences. They discuss the control actions that could prevent cascade of events, either system operation or emergency control, and em-phasize the importance of overload cascades mitigation since it often leads to system splitting. Further, Andersson et al. sum-marizes in [11] three power blackouts that happened in 2003: in North America, in Sweden & Denmark and in Italy. The paper draws recommendations and details how new technologies, like flexible alternating current transmission system or high-voltage direct current, can improve power systems security and stabil-ity.
Blackouts have been the focus of discussion of two panel sessions [25, 26] and of a series of invited papers [27, 28, 29, 30, 31, 32] in the IEEE Power & Energy Magazine Septem-ber / OctoSeptem-ber 2006, both sponsored by the IEEE Power System Dynamic Performance Committee and Blackout task force. In its final report [4], the task force summarizes the causes and lessons learnt from documented blackouts in the period 1965-2006 as well as the best practices and tools that may be used to reduce the risk of future blackouts. The report also provided some high-level policy recommendations.
Finally, Lu et al. [5] study 37 blackouts that happened be-tween 1965 and 2005, and proposes a classification of black-outs, which we use here in our analysis. The main suggestion brought by this analysis is to develop actions that can avoid to enter the fast cascade that cannot be stopped by operators.
However, none of the aforementioned studies cover the last decade period (i.e. from 2005 to 2016). Therefore, our work analyzes the main characteristics of blackouts for that period, completing in this way previous studies.
More recently, Bo et al. [12] analyze 23 representative blackouts of the period 1965-2012 with the objective of pro-viding suggestions on the expansion and improvement of the Chinese power grid. The main recommendation resulting from this article is to manage the planning, construction, schedul-ing and emergency in a more unified way to prevent large-scale blackouts. However, given the focus of this work on the devel-opment of the Chinese grid, its analysis and recommendations are limited in extent to this particular case.
3. Pre-conditions
The pre-conditions are the set of state variables of the power system before the disturbance happens, when the system is in a stable state. In other words, pre-conditions define the context in which incidents happen. In our analysis, we used the main pre-conditions3 described in [5] and [10], namely: peak demand,
3The aging of equipment did not appear in the reports analyzed and hence it is not mentioned below.
important equipment out of service, inadequate reactive power reserves and natural reasons.
We extend this list to include three new pre-conditions iden-tified from our analysis, namely: dependency among regions, mismatch between scheduled and actual power flow and the N-k reliability operating criteria (i.e. a metric of the reliability of the system). Fig. 2 summarizes the pre-conditions that preceded each of the eight4,5 analyzed blackouts, where pre-conditions are depicted within the square boxes below the blackouts ab-breviations. We describe each of these pre-conditions in the following sections.
3.1. Peak demand
In previous periods, blackouts were usually happening dur-ing peak demand periods (usually winter and/or summer), when the system, being under stress due to the high loading, operates close to the operating and stability limits. However, as summa-rized in Fig. 2, 8 out of 9 blackouts of the period 2005-2016 happened under normal loading conditions. The only exception is the blackout inINDIA12 in which the loading of the system reached respectively 99.7GW and 100.5GW load served prior to disturbance whereas the peak demand met at the time was around 110GW.
Hence, the results of this analysis contrast with those of pre-vious blackouts (i.e. of the period 1965-2005) for which peak demand was identified as the main pre-condition (i.e. around 65% of the 37 blackouts analyzed in [5] happened during peak conditions).
3.2. Important equipment out of service
Equipment can be out of service due to unexpected techni-cal or supply problems (i.e. forced outage) or due to upgrading and maintenance works (i.e. planned outage). As highlighted in [6], one particularity of planned outages is that they are usually performed during normal or low loading periods (i.e. spring and autumn).
The absence of important equipment, as a result of (mainly planned) outages, played a key role in the development of many of the analyzed blackouts, as we discuss next. In TURK15, the backbone of 400kV transmission lines corridor between the Eastern and Western parts of the country was weakened due to planned outages of lines and series capacitors. InBRAZ11, a 500kV line was disconnected for maintenance purposes. In
USA11, 600MW generation in Baja California and two 230kV lines were under maintenance prior to the blackout. Five trans-mission lines were unavailable due to maintenance inCHILE11. InINDIA12, several generating units and transmission elements (between the Northern, Western and Eastern regions) were un-der maintenance or unun-der forced outage due to technical issues.
4ForCOLOM07 the list of pre-conditions is not exhaustive, given the lack of available information in the available reports.
5INDIA12 encountered two very similar blackouts on two consecutive days, we thus treat the pre-conditions and initiating events as one blackout.
3.3. Dependency among regions
Dependencies on supply between regions of an intercon-nected network can have a great impact on the size and the speed of the blackout. In more detail, when an important dis-turbance happens, regions are often disconnected to avoid its propagation. However, in presence of strong dependencies on power supply, the deficit or excess of power generation can pro-voke a rapid collapse, leaving regions in an irrecoverable situ-ation. We consider that one region is highly dependent, and consequently at risk, if the power imported is greater than 20% of its total consumption or close to the limit of import capabil-ity with power reserves issues.6Notice that although the depen-dency among regions was not explicitly listed as a pre-condition in previous reports, it was frequently mentioned in the descrip-tion of the blackouts contexts (e.g. [11] revealed that Southern Sweden/Eastern Denmark and Italy power systems were highly dependent on their neighbors previously to the two blackouts that followed). In this paper we decided to include it to high-light the risk of operating tie lines close to their limits especially when the loss of those could trigger very fast blackout.
As we can observe in Fig. 2, the dependency among re-gions turns out to be one of the main pre-conditions in our study since, as detailed next, 6 out of 9 blackouts faced this situation. In more detail, the Jakarta-Banten region of JAMALI system inINDO05 and the South Australia region inAUSTR16 were importing respectively 21% and 32% of its consumption from neighboring regions. InCHILE11, the North Central re-gion of the central interconnected system (SIC)7was importing power mainly from only two areas, the South/East Ancoa and the Southern SIC. These dependencies created a deficit/excess of power after SIC separation.
In some blackouts these high dependencies between regions can be explained by the heterogeneous distribution of resources, for example hydroelectricity is not available everywhere. For instance, inTURK15 the Eastern region was exporting a lot of
hydroelectricity (42% of its production), most of it to the West-ern region that, without this potential, was importing 21% of its load demand. Similarly, inBRAZ11 (a country in which 70% of its production is from hydroelectricity) the North Eastern re-gion was importing up to 36% of its load power demand, mostly from the hydroelectric resources in the South and Central re-gions of the country. Indeed theBRAZ11 blackout was initiated by a protection hidden failure at an hydro plant substation.
Finally, before both blackouts inINDIA12, the Northern re-gion was importing from the Western rere-gion between 12% and 15% from its load demand due to the unavailability of few ther-mal units that were under forced outage. Although this percent-age of import is lower than the one from the 2003 Italian black-out that we took as reference, the fact that the Northern region was short in power reserves and that the import created conges-tion on the interconnecconges-tion lines on the path across Western-Eastern-Northern regions justifies this classification.
6This metric is in line with previous blackouts; for example before 2003 Italian blackout, Italy was importing 25% of its consumption, of which 21% were from Switzerland and France.
7In Chile there are four electrical interconnected systems operating inde-pendently of each other.
Figure 2: Location, million people impacted, pre-conditions and initiating events that triggered each blackout.
3.4. Inadequate reactive power reserves
The lack of reactive power reserves prevents the system from stabilizing the voltage and thus could lead to voltage insta-bility or even collapse. Inadequate reactive power reserves are mentioned as pre-conditions in INDIA12 and TURK15
black-outs.
3.5. Natural reasons
Natural reasons can be an important factor in blackouts, especially extreme weather conditions like heavy rains, wind, or thunderstorms that can lead to short-circuits. For instance,
BRAZ09 blackout happened during heavy rain and wind due to a thunderstorm. BothINDIA12 blackouts happened during the monsoon in the south of the country and created forced out-ages of some transmission devices. The AUSTR16 blackout happened during a lightning storm.
Power system operators are aware of this risk and can take exceptional measures, like inBRAZ09 where the 765kV part of the system was operated to be N-2 secure (i.e. the loss of any pair of 765kV devices should not trigger a cascade). Never-theless, in South Australia region, even with the high lightning risk, the operator assessed that there were no transmission line classified as vulnerable to lightning and hence he did not take more preventive measures than usual.
3.6. Mismatch between scheduled and actual power flow
The mismatch between the scheduled and actual power flows along interconnection lines is very risky because operators might not take the most suitable counter-measures in such emergency cases (i.e. there may be no contingency plan to handle such un-expected situation). Thus, before bothINDIA12 blackouts, sig-nificant mismatch between scheduled and actual power flows
on interconnection lines were noticed. In USA11, the West-ern Electricity Coordination Council also observed unsched-uled flows on major paths.
3.7. N-k operating reliability criteria
Reliability of power systems has been traditionally deter-mined by the (deterministic) N-k security criteria.8 Fig. 2 de-picts the N-k criteria at which power networks were operated prior to the blackout, and so provides an idea of the reliabil-ity of the system at the time of the initiating event. Most of transmission system operators (TSOs) must operate at least in compliance with the N-1 criteria [33] so that the system can lose any of its devices and stay stable, i.e. with no propagation of the disturbance. However, because of unpredictable conditions or errors, the system sometimes cannot be kept within the N-1 limits. This was the case in theINDO05,USA11 andTURK15
blackouts, all triggered while the corresponding system was not N-1 secure. Interestingly, the Turkish transmission system was not N-1 compliant even though both TSO (Eastern and West-ern) regions were individually N-1 secure, which highlights the necessity of a close coordination between operators of intercon-nected networks.
Finally, it is worth to point out that inCOLOM07 andBRAZ09 blackouts the systems were respectively totally and partly N-2 before the incident, which was nevertheless not sufficient to deal with the disturbance that followed.
8A power system is N-k secure if the simultaneous loss of any set of k elements do not trigger a cascade.
3.8. Pre-conditions conclusion
The main pre-conditions identified in our analysis are, first, the high dependency among transmission regions and second, the equipment out of service. The combination of these two conditions is particularly dangerous when interconnection lines are missing. Then any disturbance can overload the remain-ing lines and trigger the separation of the system which is at risk when regions are dependent on neighbors supply. Our findings are however different from those reported in [5]: for the period pre-2005, most blackouts happened in peak period whereas we observed the opposite tendency. Nevertheless, all blackouts considered in [5] happened in USA, Europe or Aus-tralia, whereas blackouts analyzed here mainly took place in South America or Asia (i.e. all except USA11, TURK15 and
AUSTR16). Hence, these systems have been developed at
dif-ferent times and continents, using difdif-ferent constraints and tech-nologies, which makes the comparison difficult.
4. Initiating events
Initiating events are disturbances that trigger the cascade of events on the power systems, as illustrated in Fig. 1. The main initiating events9are short-circuits, overloads and protec-tion hidden failures. Fig. 2 shows the initiating events that trig-gered each of the nine blackouts, marked as the color of circle. We describe the occurrence of each of these events in the an-alyzed blackouts, according to available data, in the following sections.
4.1. Short-circuits
Short-circuits can happen due to natural reasons or errors, such as flash-overs caused by birds or wire insulation break downs. For instance, duringBRAZ09, as a prevention from an ongoing thunderstorm, the Brazilian TSO decided to operate its 765kV network as N-2 secure. Nevertheless three short-circuits happened (on two main 765kV lines and on a 765kV busbar) almost simultaneously (within an electrical period). Addition-ally, theAUSTR16 blackout was initiated by the combination of four single and one double phase-to-ground short-circuit faults that happened within 88 seconds and led to up to six voltage disturbances. Finally, the CHILE11 blackout was triggered by a single-phase short-circuit on a switch. The short-circuit that triggered theUSA11 blackout was due to a wrong maneuver of a technician while disconnecting a capacitor bank (i.e. it cre-ated an arc on a 500kV line that could not reconnect afterward because the phase angle difference was too large).
4.2. Overloads
When a power delivery device is loaded above its limits (i.e. overloaded), its protections can disconnect it to avoid the lag-ging of line or damalag-ging the device. TheINDIA12 andTURK15
9Although the loss of power plants is usually identified as a main initiating event in previous studies, here it is not included because it does not apply to any of the analyzed blackouts.
blackouts were triggered by overloads. InINDIA12, the short-circuits that happened due to the monsoon weakened the circuit; then the initiating events were overloads in the heavily loaded North region for both blackouts.
InTURK15, the disconnection of a line on the main corridor be-tween the Eastern and Western regions due to overloading trig-gered a very fast separation of the two transmission systems. TheCOLOM07 blackout was initially triggered by a human er-ror during a maintenance (i.e. an operator did not follow the sequence of maneuvers), which in turn led to the overload of a breaker that disconnected a substation that supplied the city of Bogota.
4.3. Protection hidden failures
Protection hidden failure is a malfunction of a protection device that trips whereas it should not have according to the set-tings of the system; or the opposite, that it does not trip whereas it should have.
TheBRAZ11 blackout was triggered by the accidental open-ing of circuit breakers and the malfunction of a breaker fail-ure protection, which in turn led to the disconnection of several 500kV lines. INDO05 blackout was triggered by the false sig-nals from a protection device sent to Suralaya Power Plant.
4.4. Initiating events conclusion
We did not notice any major difference with the findings from studies of previous blackouts periods (e.g. [5]), as short-circuits, overloads and protection hidden failures were also the main initiating events.
5. Cascades of events
In a blackout, the disturbance created by the initiating events propagates step by step and creates a sequence of events related to each other [3, 4]. In this section, first, we classify the studied blackouts according to their speed. Then, we provide a dis-cussion about the relationship between the presence of certain pre-conditions and the high speed of the blackout.
5.1. Speed of the cascade propagation
As shown in Fig.1, the cascade that follows the initiating events can often be divided into two successive phases, namely: (II) steady state progression and (III) fast cascades. Unlike the fast cascade, the time between two events in the steady-state progression typically ranges from several minutes to sev-eral hours, which allows system operators to take countermea-sures.
Clearly, the slower a cascade propagates, the more time oper-ators have to decide which the most suitable decisions to take are. When the cascade is too fast, the defense plan of the system (automatic actions) is the only barrier that can stop the propaga-tion. Since stability studies do not account for all interactions, even automatic secure protections cannot guarantee that the dis-turbance will not propagate beyond them.
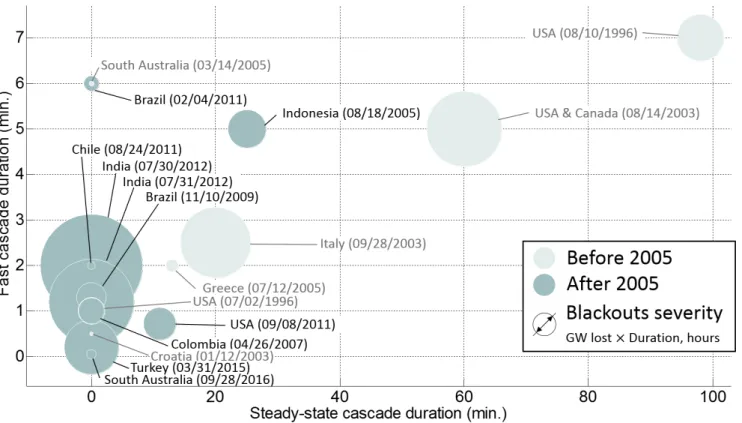
Figure 3: Steady-state progression duration vs fast cascade duration of blackouts prior to 2005 (pale circles) and blackouts after 2005 (dark circles). The diameter of the circles represents the severity of the blackout, computed as the maximum power lost times the duration of the total restoration.
Fig. 3 depicts the duration of each cascade phase and the severity of the blackouts. The horizontal axis shows the du-ration of the steady-state progression whereas the vertical axis shows the duration of the fast cascade. The size of the circles represents the severity of the blackout computed as the maxi-mum loss of power consumption times the duration of the total restoration. The dark circles correspond to the nine blackouts whereas the pale circles correspond to seven blackouts that hap-pened before 2005.10 We can clearly see in Fig. 3 that most of the cascades of blackouts after 2005 (i.e. 7 out of 9) directly started with the fast cascade skipping the steady state propa-gation (i.e. most of the blackouts are concentrated on the left side of the graph). This high speed propagation can be caused by the large magnitude of the disturbance or by the proximity of the system state to the stability limits. The clearest case is
TURK15 where the point of no return was reached after only 1.6 seconds and thus operators could not do anything to stop the blackout. Nevertheless, inINDO05 and inUSA11 the steady state progression last 25 and 11 minutes respectively before the cascades accelerate by entering the fast cascade.
These findings contrast with those obtained for blackouts prior to 2005. For example, according to [7], more than half of the blackouts prior to 2012 in America and Europe were slow in progression. Likewise, the analysis in [4] concluded that most major blackouts from 1965 to 2006 were triggered by a single
10For blackouts prior to 2005 we use mainly data from [5] that selected those 7 blackouts for being the ones with better documented cascades.
initiating event and underwent a steady state progression before entering the fast cascade. Fig. 3 also supports this hypothesis by showing the presence of a steady state cascade in 4 out of 7 blackouts prior to 2005. In conclusion, our study shows that recent blackouts exhibit greater tendency to shorten or skip the steady-state progression than their precedents. The cause for this may be that these power systems were operating too close to the stability limits, which questions the trade-off between the economic dispatch and the network security. But as mentioned in Section 3.8, the differences in development and characteris-tics of the power systems are also other potential explanations for these observations.
5.2. Discussion on the causes of the high-speed cascades
In this section, we discuss the impact that some major pre-conditions (i.e. the cascade of overloads with large transfers of power, the separation of highly dependent regions and the malfunctioning of power monitoring equipment) have on the speed of the cascade that followed the initiating events.
5.2.1. Cascade of overloads with large transfers of power
A cascade of overloads starts with the loss of a power deliv-ery element, i.e. a line or a transformer, which recursively leads to new overloads and disconnections as a result of the transfer of power to the remaining lines. Cascades of overloads are typ-ically slow in progression, strongly depending on overload pro-tections settings, and usually belong to the steady-state progres-sion. In our analysis,INDO05 andUSA11 blackouts followed
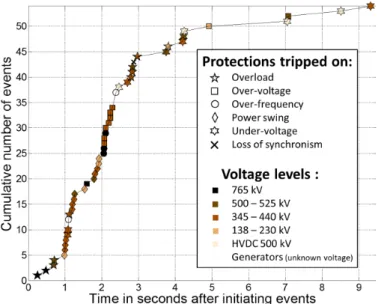
Figure 4: Cumulative number of elements disconnected during the first ten sec-onds (i.e. after the initiating event) of theBRAZ09 blackout. The plot symbols indicate the reason of the disconnection and the voltage level of the element.
this typical trend. In more detail, inINDO05, a cascade of over-loads started after the initiating event as part of the steady-state progression phase. Likewise, inUSA11, a cascade of overloads (i.e. of transformers mainly) progressively increased the load-ing of a major path, makload-ing the over-current protections trip and eventually triggering the separation scheme of San Diego Gas & Electricity and Southern California Edison networks.
Nevertheless, the speed at which the overloaded devices dis-connect depends on the magnitude of the overload. Thus, if the overload generates a large transfer of power, it can, in turn, trig-ger an extremely fast cascade of overloads.
Sometimes, the large transfers of power are generated by initiating events that affect key components of the system. This was the case in COLOM07 where the disturbance at the main Bogota substation triggered a quick disconnection of ten over-loaded lines and transformers. The resulting transfer of power initiated a fast cascade of overloads. In BRAZ09, during the first 5 seconds of the cascade, 50 elements (among which lines, transformers and generators) were disconnected from the grid. Fig. 4 shows graphically the evolution of the cascade of events of BRAZ09, plotting when the protections were triggered as well as the reasons for which they were triggered and their voltage level. We can observe in Fig. 4 how the disconnec-tion of 3 parallel 765kV loaded lines, which were hit by quasi-simultaneous short-circuits, started a very fast and violent cas-cade due to the large transfer of power that followed. The consequences of such large transfer of power made protections trip not only on overload but also on over-frequency, under and over-voltage.
At other times, large transfers of power are due to the con-tingencies on the transmission lines that connect highly depen-dent regions. For example in TURK15, the transmission line corridor between the Eastern and the Western regions had some
lines out of service, and the power flow between these two neighboring regions was important because of the dependen-cies on supply. These conditions increased the stress on the remaining interconnection lines and after the initiating event, a very fast cascade of overload started immediately.
Forced outages of generating units created a dependency be-tween the North and its neighboring regions prior toINDIA12 blackout. In addition, natural reasons created outages on inter-connection lines which increased the loading of the lines to the North region and contributed to a fast cascade.
5.2.2. Separation of highly dependent regions
Although separation schemes are meant to mitigate the prop-agation of the instability by islanding healthy regions, they can also end up provoking the fast collapse of the system when re-gions are highly dependent on each other on supply or demand. In other words, it is highly likely that unbalanced regions col-lapse quickly after the separation.
Thus, in TURK15, the deficit (21%) and excess (42%) of production made the Western and Eastern systems collapse af-ter their separation, which was a point of no return for the cas-cade. InAUSTR16, the South Australia region was importing 32% of its consumption and relied for almost half on wind farms. As a result of the voltage disturbances that followed the initiating events, the wind farms reduced by two their pro-duction and thus increased the imports of the regions by 23%. The main tie lines automatic protections of loss of synchronism tripped because of this disturbance, which quickly led to a fre-quency collapse of the region. InBRAZ11, the Northeast region was importing 36% of its power demand and after the island-ing of the region, the system ended up collapsisland-ing. InINDIA12, the fast cascade saturated the interconnection lines connected to the North region leading to under-frequency conditions. The other regions faced an over-frequency that disconnected the re-maining generators. The same situation happened inCHILE11 where the North Central region was facing under-frequency and the Southern region an over-frequency after separation. Even for the two only blackouts with a steady-state progression, i.e.
INDO05 andUSA11, the separation of the system indeed initi-ated the fast cascades.
We clearly highlight that reaching separation schemes of re-gions that are significantly dependent on each other often leads to a very fast and unstoppable collapse of the system. The sharp change in power production or consumption caused by the sep-aration is too fast and too large to be handled by the defense plans.
These conditions must then be identified depending on the im-portance of a connection for the stability of each region as well as the mechanisms that respond to the system disturbances. Criticality analysis of these power exchanges can be carried out to help designing countermeasures that should mitigate this risk. As an example, the primary reserves or even the defense plan could then be adapted to these special conditions.
5.2.3. Malfunctioning of power monitoring equipment
Monitoring systems providing wrong information (or even failing), either prior or during the cascade of events, can dramat-ically impact the management of the contingencies (i.e. power system operators are left unaware of the real loading situation and their actions or inaction can worsen the cascades).
InINDIA12, respectively 25% and 50% of the Supervisory Con-trol And Data Acquisition (SCADA) systems data was unavail-able prior and after the initiating events. In addition, a 400kV line monitored value was frozen 30% lower than reality dur-ing the event and the line ended up overloaded. InUSA11, the SCADA system of an important transformer suffered from ac-curacy issues which prevented operators to have a full aware-ness of the ongoing overload.
5.3. Cascade conclusion
The duration of the cascade of events, especially the steady-state progression, is a critical parameter as it is the time op-erators have to attempt to stop the cascade. As suggested in [5], mitigation actions should be taken before the fast cascade starts, i.e. before the system becomes uncontrollable with hu-man time-scale actions. However, among the blackouts ana-lyzed in this paper, only two entered the steady-state phase and for a short period of time. The other blackouts directly started with the fast cascade, just after the initiating event happened and thus they did not allow operators to take actions. The speed of the blackouts analyzed here differs from those of previous studies [5, 4, 7]. Nevertheless, the major cause of this speed was already mentioned in previous reports, e.g. [4]: power systems are operating closer to stability limits, under growing stress and power transfers over long distances are increasing.
The speed and the type of the cascades of events are highly related to the pre-conditions and the initiating events. We note that dependencies between regions that are likely to separate the system under emergency, may in turn trigger a very fast cas-cade due to the deficit/excess of power supply. We identified two main reasons for these transfers to be large (i.e. important enough to create a fast cascade of overloads), namely initiating events that affect key system components or transmission lines that connect regions highly dependent on supply.
6. Conclusions
We have analyzed 9 major blackouts that occurred between 2005 and 2016. The outcomes from our analysis revealed that blackouts from the last decade have a different anatomy than its precedents. In particular, peak demand, identified as a recurrent pre-condition in blackouts prior to 2005, is hardly ever found in our analysis. In contrast, nearly all the analyzed blackouts hap-pened in maintenance periods of normal (or even low) loading since one of the main pre-conditions was that some important transmission delivery elements were out of service. Another pre-condition that we explicitly introduced in our analysis is the dependency on supply between regions because it significantly contributed to the stress of the system.
Our study finally shows that recent blackouts exhibit greater tendency to enter directly the fast cascade (i.e. skipping the steady-state progression) than in previous periods. Some expla-nations are mentioned and discussed such as the system sepa-ration, the large power transfers and their causes. It reveals that most systems were operating too close to the stability limits to withstand the disturbances.
The drawing of these common characteristics can be help-ful for future work dealing with blackout analysis and mitiga-tion. First, we observed that interesting scenarios for studying future blackouts could be power systems with normal loading but with important transmission lines or transformers missing. A multi-area system would be more appropriate in order to add large flows between regions and test the impact of the separa-tion of the systems. Second, we also mensepara-tioned the possible risk brought by renewable energies (hydro power is highlighted in Section 3.3) whose potential is unevenly distributed [34, 35] and not necessarily geographically correlated with loads loca-tions. If long distance transmission is needed, a special care should be taken to these power delivery systems to ensure se-curity of supply. The planning should then take more into ac-count the importance of interconnection lines in the stability of the system as well as the neighboring systems through coor-dination of planning and potential risks. A sudden separation of transmission regions should be considered and studied when assessing the risk of large scale blackout as the response of the system may lead to a very fast collapse.
From our conclusions, future works should also focus on the mitigation of dangerous conditions and thus work on day ahead or real time coordinated planning. Large-scale distributed coor-dination and optimization techniques coupled with new flexibil-ities brought by smart devices are tracks exploited in [36, 37], for example. This raises the difficult question of the trade-off between economic efficiency and security of supply in a con-text of high reliability of our society on electricity, with a non-negligible risk of blackout and with growing integration of dis-tributed and intermittent renewable energies.
Acknowledgment
We would like to thank Joko Muslim and Kevin Banjar Na-hor for their help in finding and translating the Indonesian re-port [13].
References
[1] FERC and NERC staffs, Arizona-Southern California Outages on September 8, 2011: causes and recommendations, Tech. rep., Federal Energy Regulatory Commission (FERC) & North American Electric Re-liability Corporation (NERC) (2012). doi:10.1093/toxsci/kft047. [2] National University System Institute for Policy Research, Blackout losses
could top $100 million (2011).
URL
http://www.nusinstitute.org/press/in-the-news/Blackout-losses-could-top-100million.html [3] Y. V. Makarov, V. I. Reshetov, A. Stroev, I. Voropai, Blackout prevention
in the United States, Europe, and Russia, Proceedings of the IEEE 93 (11) (2005) 1942–1955.
[4] IEEE Task Force on Blackout Experience, Mitigation and Role of New Technologies, Blackout experiences and lessons, best practices for system dynamic performance, and the role of new technologies, Tech. rep., IEEE Task Force (2007).
[5] W. Lu, Y. Besanger, ´E. Zama¨ı, D. Radu, Blackouts: Description, Anal-ysis and Classification, in: WSEAS International Conference on Power Systems, Lisbonne, Portugal, 2006.
[6] R. Baldick, B. Chowdhury, I. Dobson, Z. Dong, B. Gou, D. Hawkins, H. Huang, M. Joung, D. Kirschen, F. Li, J. Li, Z. Li, C.-C. Liu, L. Mili, S. Miller, R. Podmore, K. Schneider, K. Sun, D. Wang, Z. Wu, P. Zhang, W. Zhang, X. Zhang, Initial review of methods for cascad-ing failure analysis in electric power transmission systems, in: IEEE Power and Energy Society General Meeting ’08, IEEE, 2008, pp. 1–8. doi:10.1109/pes.2008.4596430.
[7] M. Vaiman, K. Bell, Y. Chen, B. Chowdhury, I. Dobson, P. Hines, M. Pa-pic, S. Miller, P. Zhang, Risk assessment of cascading outages: Method-ologies and challenges, IEEE Transactions on Power Systems 27 (2) (2012) 631–641. doi:10.1109/TPWRS.2011.2177868.
[8] B. A. Carreras, D. E. Newman, I. Dobson, North American Blackout Time Series Statistics and Implications for Blackout Risk, IEEE Trans-actions on Power Systems 31 (6) (2016) 4406–4414.
[9] A. Atputharajah, T. K. Saha, Power system blackouts-literature review, in: International Conference on Industrial and Information Systems (ICIIS), IEEE, 2009, pp. 460–465.
[10] K. Yamashita, J. Li, P. Zhang, C. C. Liu, Analysis and control of major blackout events, 2009 IEEE/PES Power Systems Conference and Exposi-tion, PSCE 2009 (2009) 2–5doi:10.1109/PSCE.2009.4840091. [11] G. Andersson, P. Donalek, R. Farmer, N. Hatziargyriou, I. Kamwa,
P. Kundur, N. Martins, J. Paserba, P. Pourbeik, J. Sanchez-Gasca, R. Schulz, A. Stankovic, C. Taylor, V. Vittal, Causes of the 2003 ma-jor grid blackouts in North America Europe, and recommended means to improve system dynamic performance, IEEE Transactions on Power Systems 20 (4) (2005) 1922–1928. doi:10.1109/TPWRS.2005.857942. [12] Z. Bo, O. Shaojie, Z. Jianhua, S. Hui, W. Geng, Z. Ming, An analysis
of previous blackouts in the world: Lessons for china’s power industry, Renewable and Sustainable Energy Reviews 42 (2015) 1151–1163. [13] Investigation Report on the Java-Madura-Bali Power System Blackout on
18 August 2005, Tech. rep., Ministry of Energy and Mineral Resources of the Republic of Indonesia (December 2005).
[14] C. A. Ruiz, N. D. J. Orrego, J. F. Gutierrez, The Colombian 2007 black out, 2008 IEEE/PES Transmission and Distribution Confer-ence and Exposition: Latin America, T and D-LAdoi:10.1109/TDC-LA.2008.4641845.
[15] P. C. Avella, ´A. M. Cabra, N. D. Montoya, A. B. Barreto, L. S. Botero, J. Vargas, Evento del 26 de abril de 2007 en el sistema interconectado nacional sin colombiano, XM Compa˜n´ıa de expertos en mercados. [16] M. Gutierrez, Colombian Blackout 2007, PAC World Magazine Blackout
Watch (2009) 36–37.
[17] ONS, An´alise da perturbac¸˜ao do dia 10/11/2009 `as 22h13min, envolvendo o desligamento dos trˆes circuitos da LT 765 kV Itaber´a - Ivaipor˜a, Tech. rep., Operador Nacional do Sistema El´etrico (ONS) (2009).
[18] J. M. Ordacgi Filho, Brazilian Blackout 2009, PAC World Magazine Blackout Watch (2010) 36–37.
[19] C. B. Antonio, P. Gomes, A. Guarini, F. Alves, N. Martins, D. Falc˜ao, G. Taranto, C. Ribeiro, C2-214 CIGRE 2012 Lessons Learned in Restoration from Recent Blackout Incidents in Brazilian Power System TARANTO COPPE / UFRJ CEP : 22283-900, Tech. rep., CIGRE (2012). [20] ONS, An´alise da perturbac¸ˆao do dia 04/02/2011 `a 00h21min envolvendo os estados da regi˜ao nordeste, Tech. rep., Operador Nacional do Sistem El´etrico (2011).
[21] Power System Operator of Central Interconnected System Chile (CDEC-SIC), Estudio para an´alisis de falla EAF 300/2011: Apertura intempestiva de los interruptores 52K1 y 52K2 de S/E Ancoa, Tech. rep., Power Sys-tem Operator of Central Interconnected SysSys-tem Chile (CDEC-SIC) (2011).
URL http://www-old.cdec-sic.cl/admin/zip/c_1_s_
6_ss_196_id_012480.zip
[22] CERC, Report on the Grid Disturbance on 30th July and 31st July 2012, Tech. Rep. 167, CERC (2012).
URL http://www.cercind.gov.in/2012/orders/Final_ Report_Grid_Disturbance.pdf
[23] Project Group Turkey, Report on Blackout in Turkey on 31st March 2015, Tech. rep., ENTSO-E (2015).
[24] AEMO, Update report: black system event in South Australia on 28 September 2016, Tech. rep., Australian Energy Market Operator (AEMO) (2016).
[25] Major Grid Blackouts of 2003 in North America and Europe, Panel session conducted at the Power Engineering Society General Meeting (2004).
[26] Power System Blackouts, Panel session conducted at the Power Systems Conference and Exposition (2006).
[27] J. Paserba, P. Kundur, Guest editorial - power grid blackouts remembering and fighting grid failures, IEEE Power and Energy Magazine 4 (5) (2006) 16–21.
[28] P. Pourbeik, P. S. Kundur, C. W. Taylor, The anatomy of a power grid blackout - root causes and dynamics of recent major blackouts, IEEE Power and Energy Magazine 4 (5) (2006) 22–29.
[29] J. E. Dagle, Postmortem analysis of power grid blackouts - the role of measurement systems, IEEE Power and Energy Magazine 4 (5) (2006) 30–35. doi:10.1109/MPAE.2006.1687815.
[30] P. Pourbeik, M. Bahrman, E. John, W. Wong, Modern countermeasu-rus to blackouts, IEEE Power and Energy Magazine 4 (5) (2006) 36–45. doi:10.1109/MPAE.2006.1687816.
[31] L. Wang, K. Morison, Implementation of online security assess-ment, IEEE Power and Energy Magazine 4 (5) (2006) 46–59. doi:10.1109/MPAE.2006.1687817.
[32] S. H. Horowitz, A. G. Phadke, Blackouts and relaying considerations -relaying philosophies and the future of relay systems, IEEE Power and Energy Magazine 4 (5) (2006) 60–67. doi:10.1109/MPAE.2006.1687818. [33] A. Pinar, J. Meza, V. Donde, B. Lesieutre, Optimization strategies for the vulnerability analysis of the electric power grid, SIAM Journal on Optimization 20 (4) (2010) 1786–1810.
[34] C. L. Archer, M. Z. Jacobson, Evaluation of global wind power, Journal of Geophysical Research: Atmospheres 110 (D12).
[35] M. ˇS´uri, T. A. Huld, E. D. Dunlop, H. A. Ossenbrink, Potential of solar electricity generation in the european union member states and candidate countries, Solar energy 81 (10) (2007) 1295–1305.
[36] R. Faranda, A. Pievatolo, E. Tironi, Load shedding: a new proposal, IEEE Transactions on Power Systems 22 (4) (2007) 2086–2093.
[37] D. Andersson, P. Elmersson, A. Juntti, Z. Gajic, D. Karlsson, L. Fabi-ano, Intelligent load shedding to counteract power system instability, in: Transmission and Distribution Conference and Exposition: Latin Amer-ica, 2004 IEEE/PES, IEEE, 2004, pp. 570–574.
![Figure 1: Division of the progression of a blackout into phases as proposed in [5].](https://thumb-eu.123doks.com/thumbv2/123doknet/12983345.378498/2.892.464.827.618.682/figure-division-progression-blackout-phases-proposed.webp)