HAL Id: hal-00365058
https://hal.archives-ouvertes.fr/hal-00365058
Preprint submitted on 2 Mar 2009
HAL is a multi-disciplinary open access
archive for the deposit and dissemination of
sci-entific research documents, whether they are
pub-lished or not. The documents may come from
teaching and research institutions in France or
abroad, or from public or private research centers.
L’archive ouverte pluridisciplinaire HAL, est
destinée au dépôt et à la diffusion de documents
scientifiques de niveau recherche, publiés ou non,
émanant des établissements d’enseignement et de
recherche français ou étrangers, des laboratoires
publics ou privés.
Dark exciton optical spectroscopy of a semiconducting
quantum dot embedded in a nanowire
Gregory Sallen, Adrien Tribu, Thomas Aichele, Régis André, Lucien
Besombes, Catherine Bougerol, Serge Tatarenko, Kuntheak Kheng,
Jean-Philippe Poizat
To cite this version:
Gregory Sallen, Adrien Tribu, Thomas Aichele, Régis André, Lucien Besombes, et al.. Dark exciton
optical spectroscopy of a semiconducting quantum dot embedded in a nanowire. 2009. �hal-00365058�
of a semiconducting quantum dot embedded in a nanowire
G. Sallen1 , A. Tribu2 , T. Aichele1 , R. Andr´e1 , L. Besombes1 , C. Bougerol1 , S. Tatarenko1 , K. Kheng2 , and J. Ph. Poizat1CEA-CNRS-UJF group ’Nanophysique et Semiconducteurs’, 1
Institut N´eel, CNRS - Universit´e Joseph Fourier, 38042 Grenoble, France,
2
CEA/INAC/SP2M, 38054 Grenoble, France
Photoluminescence of a single CdSe quantum dot embedded in a ZnSe nanowire has been inves-tigated. It has been found that the dark exciton has a strong influence on the optical properties. The most visible influence is the strongly reduced excitonic emission compared to the biexcitonic one. Temperature dependent lifetime measurements have allowed us to measure a large splitting of ∆E = 6 meV between the dark and the bright exciton as well as the spin flip rates between these two states.
PACS numbers: 78.67.Lt, 78.55.Et
Specific growth techniques developped about a decade ago have led to semiconducting nanowires (NW) that have attracted a great deal of interest since then. Their potential applications includes nanoelectronics [1, 2, 3], optoelectronics (light emitting diodes [4, 5], nanolasers [6]), thermoelectrical energy conversion [7], and biologi-cal or chemibiologi-cal sensors [8].
By changing the material composition during the growth it is possible to change the chemical composition [9, 10] along the longitudinal or radial directions. This enables the fabrication of well controlled 1D nanoscale heterostructures [10]. For example, as shown in this work, it is possible to insert a slice of a low band gap semiconductor within a high band gap NW and realize a light emitting quantum dot (QD) [11, 12]. The absence of a wetting layer offers a better confinement compared to self-assembled QDs. This has allowed our group to produce single photon at high temperature (220 K) [12]. Furthermore, NW based heterostructures, being much less limited by lattice mismatches, greatly widen the pos-sible materials combinations and enable well controlled stacking of several QDs in a single NW, offering inter-esting possibilities for quantum information processing [13].
In a QD, lowest energy excitons are the combination of an electron (spin ±1/2) and a heavy hole (spin ±3/2). This results in two different energy levels of spin ±1 and spin ±2. The spin ±1 states are optically connected to the zero spin empty dot state and called the bright exci-ton. The low energy spin ±2 states are called the dark exciton because they are not optically active. Indeed a photon is a spin 1 particle that can not carry away 2 quanta of angular momentum.
In a previous work we have performed a thorough spec-troscopic analysis of a single CdSe QD embedded in a ZnSe NW by using photon correlation spectroscopy [17]. We have identified unambiguously the exciton, biexciton, and charged exciton lines using cross-correlations and ob-tained information on the charging dynamics of this QD. In order to fit the various correlation functions we had to
include a dark exciton in the model. The most apparent manifestation of the dark exciton is the large predomi-nance of the biexciton line with respect to the exciton line above saturation.
In this paper we have performed temperature depen-dent lifetime measurements on this CdSe/ZnSe NW. By fitting these data with a model involving an acoustic phonon bath [18] we are able to extract the value of the dark and bright exciton energy splitting ∆E and the spin flip rates between these two states.
ZnSe NWs are grown by Molecular Beam Epitaxy (MBE) in the Vapour-Liquid-Solid (VLS) growth mode catalysed with gold particles on a Si substrate. In or-der to fabricate QDs, a small region of CdSe is inserted in the ZnSe NW. This is done by interrupting the ZnSe growth, changing to CdSe for a short time and growing ZnSe again [12]. From the CdSe growth time, the height of the CdSe slice is estimated to be between 1.5 and 4 nm . The diameter (around 10 nm) is of the order of the bulk exciton Bohr diameter for CdSe (2aB = 11 nm).
This means that the carriers in the CdSe QD are in the strong confinement regime. Details on the growth of the ZnSe NWs can be found in [19]. For the study of single NWs, the sample is sonicated in methanol, so that NWs broke off the substrate into the solution. Droplets of this solution are then deposited on a Si substrate, and a low density of individual NWs is obtained after evaporation. The experimental set-up is a standard microphotolu-minescence set-up. The samples are mounted on a XYZ piezo motor system in a He flow cryostat allowing ex-periments at a temperature of 4 K. Time resolved mea-surements are performed by illuminating the sample at a wavelength of λ = 440 nm with a frequency doubled Ti:sapphire laser operating at λ = 880 nm with pulse du-ration of 1 ps and a repetition rate of 80 MHz. Continu-ous wave excitation is provided by a 405 nm continuContinu-ous- continuous-wave (CW) diode laser. The ZnSe band gap (2.7 eV) corresponds to a wavelength of λ = 460 nm so that both excitation lasers create free carriers in the barrier.
2 microscope objective of numerical aperture N A = 0.65
located in the cryostat. The NW emission is collected by the same objective and sent to a monochromator (1200 grooves/mm grating, 50 cm focal length). The monochromator has a switchable mirror inside that can direct the luminescence either onto a charge coupled de-vice (CCD) camera for the measurement of the micropho-toluminescence (µPL) spectra or through the exit slit to-wards a low jitter (40 ps) Avalanche Photodiode (APD). The APD sends electrical pulses into a time-correlated single photon module that record the arrival time of the photon with respect to the the laser pulse. The overall temporal resolution of our set-up is essentially limited by the jitter of the APD and the dispersion of the monochro-mator grating. It was measured by sending the 1 ps laser pulses in the monochromator and a full width at half maximum of 70 ps was obtained.
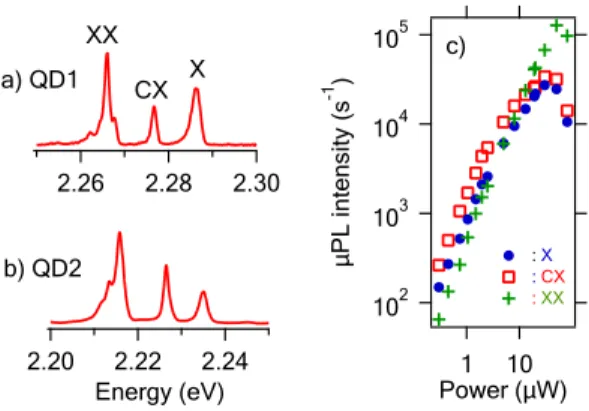
Typical spectra are shown in fig. 1. A comparison with relative energy positions of known emission lines in spectra of self-assembled CdSe/ZnSe QDs [14, 15] sug-gests that these lines correspond to the exciton (X), the biexciton (XX) and the charged exciton (CX). The X-CX and X-XX energy splitting are found around 10 meV (20 meV) as compared to 15-22 meV (19-26 meV) for self-assembled QDs. The mean excitonic energy is also similar (2.25 ± 0.08 eV) as compared to 2.45 ± 0.2 eV for self-assembled CdSe/ZnSe QDs [16]. Unambiguous proof for the assignment of these lines has been given using photon correlation spectroscopy [17].
The ratio between charged and neutral QD lumines-cence is varying from dot to dot. We have also observed that increasing the temperature tends to neutralize the QD. The large linewidths have been attributed to spec-tral diffusion [20]. The most conspicuous feature is that the µPL intensity of the XX line at saturation is always a lot larger than that of the X line as it is shown in the power dependence of the different lines (Fig. 1 c)). This effect is the signature of a strong storage effect on the dark exciton (DX) state. The DX state reduces the lu-minescence of the X line owing to the leakage from the bright to the dark exciton but the DX state remains an efficient intermediate state for populating the XX state [21]. The QD photoluminescence properties are well de-scribed by a set of rate equations including the bright and dark exciton, and the biexciton as represented in fig. 2.
The population transfer between the bright and the dark exciton states is governed by the two temperature dependent rates γd and γu (see fig. 2). We assume that
these transitions are assisted by acoustic phonons whose energy matches the X-DX energy splitting ∆E. At a tem-perature T the number N of acoustic phonons per quan-tum state of energy ∆E is given by the Bose-Einstein statistics and reads
N = 1
exp(∆E/kBT ) − 1
. (1)
The downward transition rate γd from the X to the
2.24 2.22 2.20 Energy (eV) 102 103 104 105 µPL intensity (s -1 ) 1 10 Power (µW) : X : CX : XX 2.30 2.28 2.26 a) QD1 XX CX X b) QD2 c)
Figure 1: Above saturation microphotoluminescence spectra of two different QDs. a) QD1, b) QD2 (excitation power P =60 µW). c) QD2 line intensities as a function of excitation power
Figure 2: Level scheme including the empty dot (E0), the dark exciton (EDX), the bright exciton (EX) and the biexci-ton (EX X). The various rates between the different level are indicated. The fixed values used in the model are γX = 1.4 ns−1, γ X X = 2.5 ns− 1 , γCX = 1.7 ns− 1 . The parameter r is the pumping rate. The other parameters are temperature dependent and are given in the text and in fig. 4.
DX state corresponds to the spontaneous and stimulated emission of a phonon, whereas the upward rate γu
cor-responds to the absorption of a phonon [18]. They are given by
γd = (N + 1)γ0,
γu = N γ0, (2)
where γ0is the zero temperature downward rate (N = 0).
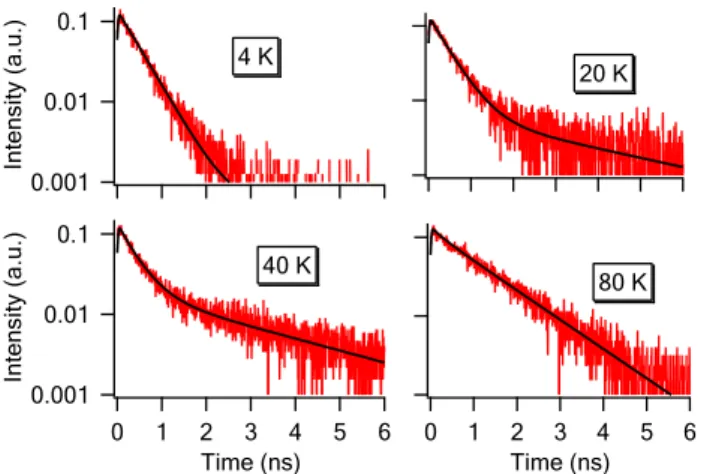
We have performed time resolved photoluminescence of the X state of QD1 at different temperatures. The results are presented in fig. 3. The decay time of the X level de-pends not only on the radiative decay rate γXbut also on
the temperature dependent γd and γu rates between the
bright and dark excitons. At low temperature (T = 4K), the luminescence exhibits a fast monoexponential decay with a time scale of the order of 1/(γX+ γd)
correspond-ing to the radiative decay and the leakage towards the DX state. For intermediate temperatures (T = 20 K and T = 40 K), the fast decay is still present and there
0.001 0.01 0.1 Intensity (a.u.) 4 K 20 K 0.001 0.01 0.1 Intensity (a.u.) 6 5 4 3 2 1 0 Time (ns) 40 K 6 5 4 3 2 1 0 Time (ns) 80 K
Figure 3: Decay of the X line emission of QD1 for different temperatures. The pumping power is well below saturation (r ≪ γX) so that the XX state is almost not populated.
2.5 2.0 1.5 1.0 0.5 0.0 gd , gu (ns -1 ) 100 80 60 40 20 0 Temperature (K)
g
dg
uFigure 4: Downward and upward spin flip rates between X and DX as a function of temperature. The dotted lines are the fits using equations (1) and (2).
is the apparition of a slow time scale corresponding to the thermally activated reloading of the X state from the long lived DX state. For higher temperature (T = 80 K), the reloading from the dark to the bright exciton becomes even more efficient, and the decay appears as monoexponential with a time scale intermediate between the previous slow and fast time scales.
By fitting the lifetimes using the model of fig 2 we can extract the values for γX, γN R, γd and γu. Each
of these parameters has a specific influence on the shape of the luminescence decay and can be evaluated with a good precision. The radiative decay rate of the exciton is found to be γX = 1.4 ns−1. The values for γd and γu
are plotted in fig 4 as a function of temperature. This temperature dependence is well fitted using equations (1) and (2). This enables us to obtain the DX-X energy split-ting ∆E = 6 meV and the zero temperature downward
rate γ0= 1.4 ns−1.
The rather large value for the DX-X energy splitting ∆E is an indication of the strong exciton confinement within the QD, owing to its relatively small size and the absence of a wetting layer [22]. The bulk DX-X energy splitting for CdSe is 0.12 meV. According to the calcu-lation performed by Klingshirn et al [23], confinement induced enhancement of this splitting reaches a factor of 50 (that is ∆E = 6 meV for CdSe) for infinite barri-ers cylindrical dots of radius corresponding to the Bohr radius aBand of height corresponding to aB/4. These
di-mensions are compatible with the measured diameter (10 nm) of the NW and with the height expected from the CdSe growth duration. The DX-X energy splitting has been measured at 1.9 meV for self-assembled CdSe/ZnSe QD [22]. The larger value that we have observed is an indication of the larger confinement in NWs owing to the absence of a wetting layer. This ∆E = 6 meV split-ting corresponds to the value for very small (about 2 nm diameter) colloidal spherical CdSe nanocrystal as re-ported in reference [24]. The value for zero temperature downward transition rate γ0= 1.4 ns−1is comparable to
what has been obtained for colloidal CdSe nanocrystals [18] or some self assembled InP/GaInP QDs [21]. Slower rates (γ0 = 0.01 ns−
1
) have also been observed in In-GaAs/GaAs self assembled QDs [25].
A good fitting of the experimental data requires the inclusion of an effective non-radiative decay rate γN Rof
the DX state. This rate slightly increases with tempera-ture from γN R = 0.2 ns−1 at 4K up to γN R= 0.5 ns−1
at 80 K. These values are of similar order of magnitude that what was reported in InGaAs/GaAs self assembled QDs [25]. Non radiative phenomena in nanocrystals are generally slower ranging from hundreds of nanoseconds to a few microseconds in colloidal nanocrystals [18, 26].
To summarize, we have performed temperature depen-dent lifetime measurements of a CdSe quantum dot em-bedded in a ZnSe nanowire. A careful quantitative anal-ysis of these data has allowed us to confirm the strong influence of the dark exciton and to extract the dark-bright exciton splitting together with the transition rates between these two levels. The rather large dark-bright exciton splitting that we have measured is a signature of the strong confinement of the exciton within the QD in this NW geometry. This value is three times larger than for self-assembled CdSe QDs although the excitonic energy and the X-XX and X-CX energy splittings are of same order of magnitude.
We thank M. Richard for many stimulating discussions and F. Donatini for very efficient technical support. T.A. acknowledges support by Deutscher Akademischer Aus-tauschdienst (DAAD). Part of this work was supported by European project QAP (Contract No. 15848).
4
[1] X. Duan, Y. Huang, Y. Cui, J. Wang, C. M. Lieber, Nature 409, 66 (2001)
[2] W. Lu, C. M. Lieber, Nature Materials 6, 841 (2007) [3] C. Thelander, T. Martensson, M. T. Bj¨ork, B. J. Ohlsson,
M. W. Larsson, L. R. Wallenberg, L. Samuelson, Appl. Phys. Lett. 83, 2052, (2003).
[4] R. K¨onenkamp, Robert C. Word, C. Schlegel Appl. Phys. Lett. 85, 6004 (2004)
[5] H.M. Kim, Y.H. Cho, H. Lee, S.I. Kim, S.R. Ryu, D.Y. Kim, T.W. Kang, K.S. Chung, Nano Lett. 4, 1059 (2004) [6] X. Duan, Y. Huang, R. Agarwal, and C. M. Lieber,
Na-ture 421, 241 (2003)
[7] A.I. Hochbaum, R.Chen, R.D. Delgado, W. Liang, E.C. Garnett, M. Najarian, A. Majumdar, P. Yang, Nature 451, 163 (2008)
[8] Y. Cui, Q. Wei, H. Park, C. M. Lieber, Science 293, 1289 (2001)
[9] M. S. Gudiksen, L. Lauhon, J. Wang, D. C. Smith, C. M. Lieber, Nature 415, 617 (2002)
[10] M. T. Bj¨ork, B. J. Ohlsson, T. Sass, A. I. Persson, C. Thelander, M. H. Magnusson, K. Deppert, L. R. Wal-lenberg, L. Samuelson, Nanoletters 2, 87 (2002); Appl. Phys. Lett. 80, 1058 (2002)
[11] M. T. Borgstr¨om, V. Zwiller, E. M¨uller, A. Imamoglu, Nano Lett. 5, 1439 (2005)
[12] A. Tribu, G. Sallen, T. Aichele, R Andr´e, J.-Ph. Poizat, C. Bougerol, S. Tatarenko, K. Kheng, Nano Lett. 8, 4326 (2008)
[13] C. Simon, Y.M. Niquet, X. Caillet, J. Eymery, J.P. Poizat, J.M. G´erard Phys. Rev. B 75, 081302 (2007) [14] V. T¨urck, S. Rodt, R. Heitz, O. Stier, M. Strassburg,
U. W. Pohl, D. Bimberg, Phys. Status Solidi b 224, 217 (2001)
[15] B. Patton, W. Langbein, U. Woggon, Phys. Rev. B 68, 125316 (2003)
[16] G. Bacher et al, Phys. Rev. Lett. 83, 4417 (1999); F. Gindele et al, Phys. Rev. B 60, R2157 (1999); F. Gindele et al, Phys. Rev. B 60, 8773 (1999); J.C. Kim et al, Appl. Phys. Lett. 75, 214 (1999); T. K¨ummel et al, Appl. Lett. 73, 3105 (1998); S.M. Ulrich et al, Appl. Phys. Lett. 83, 1848 (2003); V. D. Kulakovskii et al Phys. Rev. Lett. 82, 1780 (1999)
[17] G. Sallen, A. Tribu, T. Aichele, R. Andr´e, C. Bougerol, S. Tatarenko, K. Kheng, and J. Ph. Poizat, submitted [18] O. Labeau, P. Tamarat, B. Lounis, Phys. Rev. Lett. 90,
257404 (2003)
[19] T. Aichele, A. Tribu, C. Bougerol, K. Kheng, R. Andr´e, S. Tatarenko Appl. Phys. Lett. 93, 143106 (2008) [20] G. Sallen, PhD thesis, Universit´e Joseph Fourier,
Grenoble (2009). http://tel.archives-ouvertes.fr/tel-00362497/fr/
[21] M. Reischle, G. J. Beirne, R. Roßbach, M. Jetter, and P. Michler Phys. Rev. Lett. 101, 146402 (2008)
[22] J. Puls, M. Rabe, H.-J. W¨unsche, and F. Henneberger Phys. Rev. B 60, R16303 (1999)
[23] C. Klingshirn, M. Hetterich, J.M. Hvam, W. Langbein, U. Woggon, F. Gindele, Solid State Communications 106, 653 (1998)
[24] Al.L. Efros, M. Rosen, M. Kuno, M. Nirmal, D.J. Norris, M. Bawendi Phys. Rev. B 54, 4843 (1996)
[25] J. M. Smith, P. A. Dalgarno, R. J. Warburton, A. O. Govorov, K. Karrai, B. D. Gerardot, P. M. Petroff, Phys. Rev. Lett. 94, 197402 (2005)
[26] M. Nirmal, D.J. Norris, M. Kuno, M.G. Bawendi, Phys. Rev. Lett. 75, 3728 (1995)