HAL Id: tel-01591340
https://tel.archives-ouvertes.fr/tel-01591340
Submitted on 21 Sep 2017
HAL is a multi-disciplinary open access
archive for the deposit and dissemination of sci-entific research documents, whether they are pub-lished or not. The documents may come from teaching and research institutions in France or abroad, or from public or private research centers.
L’archive ouverte pluridisciplinaire HAL, est destinée au dépôt et à la diffusion de documents scientifiques de niveau recherche, publiés ou non, émanant des établissements d’enseignement et de recherche français ou étrangers, des laboratoires publics ou privés.
Andreas Karpf
To cite this version:
Andreas Karpf. Social interactions, expectation formation and markets. Economics and Finance. Université Panthéon-Sorbonne - Paris I, 2015. English. �NNT : 2015PA010015�. �tel-01591340�
Université Paris 1 Panthéon–Sorbonne
Ecole d’Économie de Paris - PSE
Thèse
pour obtenir le grade de Docteur de l’Université de Paris 1 Panthéon-Sorbonne
et de l’École d’Économie de Paris-PSE Spécialité: Sciences Économiques
présenté par Andreas Karpf
Social Interactions, Expectation Formation and
Markets
Directeur de thèse : M. François Gardes, professeur à l’Université Paris 1 Panthéon–Sorbonne
soutenue le 22 octobre 2015 devant le jury composé de
M. Marc-Arthur Diaye rapporteur Université d’Evry Val d’Essonne
M. François Gardes directeur Université Paris 1 Panthéon–Sorbonne
M. Simon Langlois Université Laval
M. Philip Merrigan rapporteur Université du Québec à Montréal
Mme. Agnieszka Rusinowska Université Paris 1 Panthéon–Sorbonne
Ecole doctorale
Ecole doctorale Economie Panthéon-Sorbonne (EPS) no 465
Adresse:
Maison des Sciences Economiques 106-112 Boulevard de l’Hôpital 75647 Paris Cedex 13
France
Laboratoire de recherche Centre d’Economie de la Sorbonne UMR-8174 du CNRS
Unité de gestion no 5, Axe Economie Mathématique, Jeux, Finance
Adresse:
Maison des Sciences Economiques 106–112 Boulevard de l’Hôpital 75647 Paris Cedex 13
Acknowledgments
The completion of this doctoral dissertation has been a long journey and only became possible with the support of several people. Their passionate and careful guidance helped me to overcome all hardships and problems I encountered during my dissertation project. I would like to express my sincere gratitude to all of them.
Foremost, I would like to express my special appreciation and deepest gratitude to my Ph.D. advisor Professor François Gardes. You have been a tremendous mentor for me. I would like to thank you for your patience, your belief in my capabilities as well as for allowing and encouraging me to pursue my own research interests. This permitted me to grow as a research scientist. Your advice and encouragement over the past four years were invaluable for the completion of this dissertation. You are a role model for me in every aspect: As a researcher, as an intellectual, whose knowledgeableness extends far beyond the field of Economics, and as a human. You are one of the few examples of peo-ple I encountered in the academic world whose excitement about research is downright sensible. In my mother tongue German the doctoral advisor is also called “Doktorvater”, which translates into “doctoral father”. You fulfilled this role in the best imaginable way. Thank you!
Furthermore I would like to express my gratitude to Professor Antoine Mandel, one of the coauthors of the article on which Chapter 6 of this thesis is based and my boss in the SIMPOL project. He gave me the great opportunity to work in a very interesting project, meet interesting people, participate in exciting academic events and opened up a completely new perspective for my research. I would like to thank you for your trust in me and your tremendous patience, especially in the last months of my thesis!
I would also like to thank my committee members, Professor Marc-Arthur Diaye, Pro-fessor Simon Langlois, ProPro-fessor Philip Merrigan, ProPro-fessor Agnieszka Rusinowska and Professor Alain Trognon. Your remarks and comments helped me a lot to improve my work!
I am also thankful to Professor Jean-Marc Bonnisseau and Professor Manfred Nermuth from the University of Vienna who made it possible in the first place that I could come to Paris and start my doctoral studies here. I would also like to again thank Professor Agnieszka Rusinowska. You supported me on so many occasions, be it with funding for conferences or permitting me to work in one of the nicest offices in the whole Maison des Sciences Économiques, and allowed me to present my work in the Network Seminar. I am also grateful to the numerous commentators of my work at conferences. In this regard I would like to especially mention Christophe Starzec.
In addition, I have been very privileged to get to know a row of very nice colleagues who I now consider my friends. This list can’t be exhaustive, but Abhishek, Anil,
Ar-tation so much more enjoyable! Our Friday evening seminars are legendary.
I also want to thank you Zhanna, for your love and patience, for comforting me in times of stress, for our long hours of discussing all kind of significant and insignificant things, your critical words when they were necessary (also with regard to my thesis) and for simply being at my side and adding joy to my life.
Special thanks go to my parents. Words cannot express how grateful I am to you, for your love, your unconditional support over so many years and all the sacrifices that you have made on my behalf. Without you all this would not have been possible.
Résumé
Les interactions sociales se trouvent au cœur des activités économiques. Pourtant en sciences économiques, elles ne sont traitées que d’une manière limitée en se concen-trant uniquement aux rapports de qu’elles entrentient avec le marché (Mankiw and Reis, 2002). Le rôle que jouent les interactions sociales vis-à-vis des comportements des agents, ainsi que la formation de leurs attentes sont souvent négligé. Cette négligence reste d’actualité malgré que les premières contributions dans la littérature économique les ont dépuis longtemps déjà identifiées comme étant de déterminants importants pour la prise des décisions des agents économiques, comme par exemple Sherif (1936), Hyman (1942), Asch (1951), Jahoda (1959) ou Merton (1968). En revanche, dans les études de consommation (une spécialité au croisement entre les sciences économiques, de la sociologie et de la psychologie), les interactions sociales (influences sociales) sont con-sidérées comme les “... déterminants dominants [...] du comportement de l’individu...” (Burnkrant and Cousineau, 1975). Le but de cette thèse est de construire un pont entre les interactions sociales et leur influence sur la formation des anticipations et le comportement des agents.
Mot-clès: anticipations, comportement, interactions sociales, reseaux sociaux, ETS,
carbone
Abstract
Social interactions are in the core of economic activities. Their treatment in Economics is however often limited to a focus on the market (Manski, 2000). The role social interactions themselves play for the behavior of agents as well as the formation of their attitudes is often neglected. This is despite the fact that already early contributions in economic literature have identified them as important determinants for the decision making of economic agents as for example Sherif (1936), Hyman (1942), Asch (1951), Jahoda (1959) or Merton (1968). In consumer research, a field on the intersection between Economics, Sociology and Psychology, on the other hand social interactions (social influences) are considered to be the “... most pervasive determinants [...] of individual’s behaviour...” (Burnkrant and Cousineau, 1975). The thesis at hand bridges the gap between social interactions and their influence on agents expectation formation and behavior.
Contents
1 Introduction 1
1.1 Introduction Française . . . 1
1.2 English Introduction . . . 6
2 Herd behavior in inflation expectations 13 2.1 Introduction . . . 13
2.2 The Data - Enquête mensuelle de conjoncture auprès des ménages . . . . 16
2.3 A simple non-parametric test for herding . . . 18
2.3.1 The idea . . . 18
2.3.2 The Test Statistics . . . 20
2.3.3 Comparisons with other approaches to test the REH . . . 21
2.4 Quantifying Inflation Expectations . . . 22
2.4.1 Regression approach . . . 23
2.4.2 The Carlson-Parkin Approach . . . 25
2.4.3 Quantification with Ordered Probit . . . 27
2.5 Construction of a pseudo panel . . . 29
2.6 Estimating cohort-level inflation with ordinal HB-MCMC . . . 31
2.6.1 Specification . . . 32
2.6.2 Settings and Diagnostics . . . 33
2.7 Estimation results and computation of the perceived/expected inflation rate . . . 37
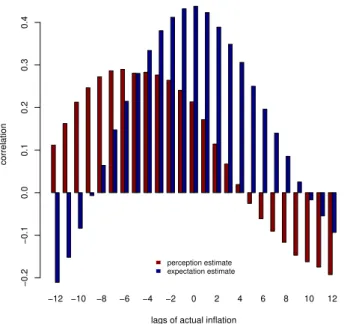
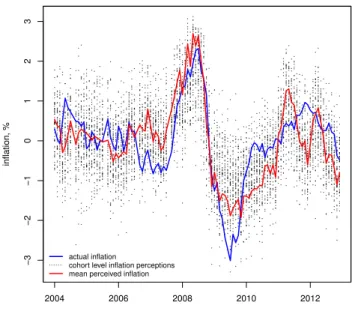
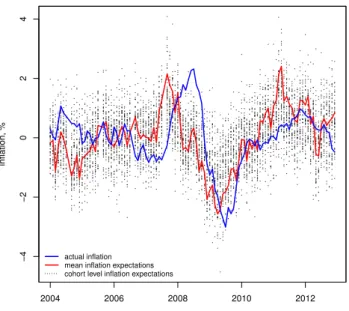
2.7.1 Discussion of the raw perception/expectation estimates . . . 37
2.7.2 Deriving the expected inflation rate . . . 40
2.8 Modifying the test statistics for an application with posterior distributions 42 2.9 Conclusion . . . 43
2.A Data References . . . 47
2.B Variance of the Test statistics . . . 48
2.C Robustness . . . 50
2.D Variables - coding . . . 52
2.E Inflation perceptions and expectations for each cohort . . . 55 11
3.1.1 The Data Set: University of Michigan Consumer Survey . . . 57
3.1.2 Research question and methodology . . . 57
3.2 Decomposition Methodology . . . 61
3.2.1 Basic two-fold decomposition . . . 61
3.2.2 Detailed Decomposition . . . 62
3.2.3 Extending the decomposition method to non-linear models . . . . 63
3.2.4 Computing the Variance of the decomposition estimates . . . 65
3.3 Obtaining cross-section specific perception data by a HOPIT-procedure . 66 3.3.1 The hierarchical ordered probit model . . . 66
3.3.2 Calibration . . . 70
3.3.3 Converting the realized values into individual specific perception estimates . . . 71
3.3.4 Partitioning the survey population into rational and non-rational individuals . . . 72
3.4 Results & Conlusion . . . 74
3.4.1 Differences . . . 74
3.4.2 Endowment effects, coefficient effects . . . 74
3.4.3 Conclusion and Policy implications . . . 76
3.A Decomposition Results . . . 79
3.B Linear and Non-Linear Blinder-Oaxaca Decomposition in R Code . . . 84
3.C C++ implementation of the likelihood function . . . 91
3.D HOPIT Quantification Results . . . 93
4 Expectation Formation and Social Influence 95 4.1 Introduction . . . 95
4.1.1 Objectives . . . 95
4.1.2 The Data Set: University of Michigan Consumer Survey . . . 96
4.2 Transfer Entropy . . . 97
4.3 Measuring Information Flows and Network structures with household sur-veys . . . 100
4.3.1 Construction of a pseudo panel . . . 101
4.3.2 Computing the Transfer Entropy to infer the structure of a Social Network . . . 102
4.4 Results . . . 102
4.4.1 Summary . . . 102
4.4.2 Identifying information transfer between social groups . . . 103
4.4.3 Transfer Entropy and Social Networks . . . 105
4.4.4 Higher connectivity, more influence . . . 107
4.4.5 Information transfer over time . . . 112
5 A Concept for Constructing an Economic Sentiment Indicator via Web
Mining 115
5.1 Objective . . . 115
5.2 Background and Context . . . 115
5.3 Significance of the Study . . . 117
5.4 Methodology . . . 120
5.4.1 Data Sources and Collection . . . 121
5.4.2 Text mining . . . 122
5.4.3 Machine Learning Algorithms . . . 124
5.4.4 Annotation of Sentiment . . . 129
5.4.5 Constructing a Sentiment Indicator . . . 133
5.5 Testing Economic Hypotheses and the Predictive Power . . . 135
5.6 Software and Ressources . . . 136
5.7 Conclusion . . . 137
6 A network-based analysis of the EU-ETS 139 6.1 The Background - The European Emission Trading System . . . 139
6.1.1 The United Nations Framework Convention on Climate Change & Kyoto Protocol . . . 139
6.1.2 Flexible Mechanisms . . . 140
6.2 The European Emission Trading Scheme . . . 144
6.2.1 Legal & Political Foundations . . . 144
6.2.2 The adoption of Emission Trading . . . 145
6.2.3 The legal implementation of the ETS . . . 146
6.2.4 Functioning . . . 147
6.2.5 Surrender and cancellation of allowances . . . 148
6.2.6 Banking and Borrowing . . . 148
6.2.7 The allocation of allowances . . . 148
6.2.8 Registries . . . 149
6.2.9 The Linking Directive: Joint Implementation and Clean Develop-ment Mechanism . . . 150
6.3 The data set . . . 150
6.4 Methodology and research questions . . . 151
6.5 The Network structure of the European Emission markets . . . 152
6.6 Network position, trading volume and profits . . . 154
6.7 Network formation . . . 155
6.8 Conclusion . . . 158
7 Conclusion 161 7.1 Summary, Results and Discussion . . . 161
7.2 Methodological Contributions . . . 165
7.3 Topics for future Research . . . 167
Chapter 1
Introduction
1.1
Introduction Française
Les interactions sociales se trouvent au cœur des activités économiques. Pourtant en sciences économiques, elles ne sont traitées que d’une manière limitée en se concen-trant uniquement aux rapports de qu’elles entrentient avec le marché (Mankiw and Reis, 2002). Le rôle que jouent les interactions sociales vis-à-vis des comportements des agents, ainsi que la formation de leurs attentes sont souvent négligé. Cette négligence reste d’actualité malgré que les premières contributions dans la littérature économique les ont dépuis longtemps déjà identifiées comme étant de déterminants importants pour la prise des décisions des agents économiques, comme par exemple Sherif (1936), Hyman (1942), Asch (1951), Jahoda (1959) ou Merton (1968). En revanche, dans les études de consommation (une spécialité au croisement entre les sciences économiques, de la sociologie et de la psychologie), les interactions sociales (influences sociales) sont con-sidérées comme les “... déterminants dominants [...] du comportement de l’individu...” (Burnkrant and Cousineau, 1975). Le but de cette thèse est de construire un pont entre les interactions sociales et leur influence sur la formation des anticipations et le comportement des agents. Cette thèse est structuré de la façon suivante:
Les chapitres 2 à 5 de cette thèse abordent la question de la formation des antici-pations. Comment les agents forment-ils leurs anticipations, dans quelle mesure sont-ils influencés par les autres agents et quels autres facteurs jouent un rôle dans la création d’un biais potentiel dans les anticipations des agents. De plus je presente une méthodolo-gie indiquant comment les données sur les opinions peuvent être collectées dans l’avenir en utilisant les techniques modernes d’analyse de texte. Dans le chapitre 6 le marché européen des émissions est analysé du point de vue du réseau social. L’objet de l’étude est de déterminer comment la structure du réseau reflète le fonctionnement du marché d’emission et comment la position des agents à l’intérieur du réseau influe sur leur apti-tude à créer des revenus en provenance de ces transactions.
L’objet de l’étude des chapitres 2 à 4 de cette thèse concerne la question de la ra-tionalité anticipative. Les premières contributions de Knight (1921) et Keynes (1936) suggèrent déjà que la prise des décisions des agents est largement influencée non
ment par leurs anticipations mais aussi par leur évaluation des risques, reflétant ainsi les aspects psychologiques des agents (Carnazza and Parigi, 2002). Que les agents anticipent rationnellement ou non les changements économiques et les décisions poli-tiques futures, est une question principale à partir de laquelle s’articule une multitude de travaux théoriques en économie. La courbe de Phillips est probablement l’exemple le plus frappant dans ce contexte (Phillips, 1958). Le constat empirique fait par William Phillips affirme que la relation négative qui éxiste entre le taux d’inflation et le taux de chômage. Ceci a été utilisée ultérieurement comme un levier pour influencer le marché du travail à travers la politique monétaire. Avec Milton Friedman (1968), Sargent et al. (1973) et Lucas (1976), de telles tentatives seraient pourtant, du moins à moyen terme, neutralisées par les agents rationnels qui prennent en compte un taux d’inflation anticipé plus élevé lors de la négociation de leurs salaires. Ainsi, ce n’est pas très surprenant que les hypothèses concernant les anticipations d’inflation, mais également d’autres variables économiques, soient cruciales aussi bien pour la théorie économique que pour la prise de décision politique.
Étant donné l’importance des anticipations dans la théorie économique, les premiers défenseurs de l’économie comportementale tels que George Katona se sont dévoués au développement des instruments qui permettent de mesurer les attitudes et les anticipa-tions des agents économiques vis-à-vis de l’économie. Le travail realisé dans la première période de l’après-guerre par Katona est à l’origine de la recherche économique fondée sur des sondages et a conduit à la création des indicateurs de confiance des consomma-teurs et des entreprises. Ceci représente encore aujourd’hui une source importante de données en complément des variables macroéconomiques quantifiables des tendances de prévision et d’évaluation de l’économie (Katona, 1974). L’indice de confiance des con-sommateurs de l’Université du Michigan (MCSI), conceptualisé par George Katona et régulièrement mis à jour depuis 1955, ainsi que l’indice de confiance des consommateurs (CCI), qui a été lancé en 1967 et qui est actuellement entretenu par le Conference Board des États-Unis, sont des exemples anciens et reconnus d’indices adressées aux ménages. Les données transversales provenant du premier de ces deux indices sont utilisées dans les chapitres 3 et 4. Un autre exemple de ce genre des données est l’Enquête mensu-elle de conjoncture auprès des ménages français (ECAMME), dont les données microé-conomiques sont utilisées au Chapitre 2. L’évaluation des avis émicroé-conomiques fondée sur les sondages a été étendue plus tard aux entreprises. L’indice de la Fed de Philadelphie, effectué depuis 1968, ou l’indice allemand IFO du climat des affaires crée à la fin des an-nées 1940 et régulièrement publié depuis 1972, peuvent être cités à titre d’exemple dans ce contexte. Des données similaires sont actuellement collectées dans toutes économies des pays développés. En outre, il existe aussi des indicateurs composites, comme par exemple l’Indicateur européen du climat économique (ESI) établi par la Commission européenne et qui combine de données en provenance des ménages et des entreprises pour des pays et des industries différents. D’autres sondages sur la confiance visent un publique hautement spécialisé, comme par exemple les prévisionnistes professionnels ou les responsables d’achats. Un exemple de la première catégorie serait le Philadelphia Fed’s Survey of Professional Forecasters.
1.1. Introduction Française 3 Les données sur les anticipations des agents typiquement collectées dans les enquêtes de consommation sont qualitatives et non quantitatives. Cela signifie, en ce qui concerne par exemple l’évolution de l’inflation, que l’on demande aux répondants de choisir entre différentes catégories ordonnées au lieu de donner un chiffre précis de celui-ci pour un laps de temps donné (par exemple les prochains douze mois). Comme nous verrons plus tard, les individus ont un bon flair en ce qui concerne la tendance, mais manquent sou-vent d’une notion exacte de la grandeur. Si, comme dans la plupart des cas, seulement l’information qualitative sur les anticipations est disponible, de méthodes différentes de quantification peuvent être utilisées. On peut alors regrouper ces approches en deux catégories: D’une part l’approche régressive, dont l’origine peut être retracée jusqu’à Anderson (1952), Pesaran (1985, 1987) mais aussi bien qu’à Pesaran and Weale (2006a). D’autre part l’approche probabiliste qui a été initialement développée par Theil (1952) et Carlson and Parkin (1975) et qui est ainsi souvent désignée par ce dernier comme “l’approche de Carlson-Parkin”. Les éléments discutés ci-dessus seront repris dans dif-férents chapitres de la thèse. Il s’ensuit une discussion en détail des chapitres respectifs. Le chapitre 2 cherche à savoir si la formation des anticipations individuelles d’inflation est biaisée dans le sens du consensus et est ainsi contrainte au comportement grégaire. En s’appuyant sur l’approche traditionnelle de Carlson-Parkin pour quantifier les don-nées qualitatives des sondages et sur l’extension de celui-ci realisé par Kaiser and Spitz (2002) dans un cadre sondé ordonné, je propose une methode qui permet d’obtenir des anticipations individuelles du niveau d’inflation en utilisant une évaluation hiérarchique bayésienne de Monte Carlo d’une chaîne de Markov (MCMC). Cette méthode est ap-pliquée aux données microéconomiques sur les anticipations des ménages à partir de l’“Enquête mensuelle de conjoncture auprès des ménages – ECAMME” (de janvier 2004 à décembre 2012). Puisque l’ensemble de données de l’ECAMME ne contient qu’une structure de panel très basique, une fraction des ménages est interviewée pendant trois mois consécutifs. L’algorithme de carte auto-organisatrice de Kohonen (Kohonen, 1982) est utilisé pour créer un pseudo panel afin d’être en mesure de retracer les perceptions et les anticipations des différentes cohortes sur toute la période disponible des données. Finalement une version modifiée du test non-paramétrique développé originalement par Bernardt et al. (2006) pour expliquer le comportement grégaire est réalisée . La modifi-cation permet d’appliquer le test directement aux distributions ultérieures au niveau des cohortes résultant de la méthode d’évaluation du MCMC. Je démontre que la formation des anticipations n’est pas biaisée dans le sens du consensus. Au contraire, elle expose une forte tendance anti-grégaire, ce qui est conforme aux résultats d’autres études (Rülke and Tillmann, 2011) et soutient la notion des anticipations hétérogènes.
Le chapitre 3 étudie les raisons possibles de la distorsion des anticipations des agents. Contrairement au chapitre précédant, les données du Michigan Consumer Survey sont utilisées ici, puisqu’elles contient une structure de panel basique. Cela signifie qu’un pourcentage élevé de répondants peut être retrouvé dans l’ensemble d’interviewés douze mois après leur première interview. Afin de classifier les répondants entre agents “ra-tionnels” et “non-ra“ra-tionnels”, j’utilise la structure de panel du Michigan Consumer Sur-vey, ainsi que ses questions sur les anticipations et les perceptions des agents douze mois
plus tard concernant les différentes variables économiques. Dans le cas d’indisponibilité des variables de perception, j’utilise une technique de quantification d’information quali-tative des sondages qui se sert du Hierarchical Ordered Probit pour les construire (Lahiri and Zhao, 2015). Ensuite, l’écart entre les individus rationnels et non-rationnels est dé-composé en utilisant la technique détaillée d’Oaxaca-Blinder linéaire (Oaxaca, 1973; Blinder, 1973; Yun, 2004) et non-linéaire (Bauer and Sinning, 2008). Les moments des estimations sont calculés selon les méthodes exposées par Rao (2009) et Powers et al. (2011). Les codes, utilisés dans ce chapitre pour le modèle HOPIT, ainsi que pour la méthode de décomposition, ont dû être écrits à partir de zéro. Les codes R et C++ peuvent être retrouvés respectivement dans les annexes B et C du même chapitre.
Je demontre que le biais rationnel peut être expliqué, dans une grande mesure, par les variables sociodémographiques contenues dans le Michigan Consumer Survey (édu-cation, âge, etc.) et par d’autres variables observables. On retrouve ces variables dans le sondage lui-même, comme par exemple la consommation d’information du répondant avant l’interview, ce qui se révèle être un déterminant significatif pour le biais “rationnel” faisant l’objet de l’enquête. Il en resulte que, le biais anticipatif n’est probablement pas une question de rationalité, mais il reflète plutôt les expériences et les perceptions des individus sur la situation économique dans la vie quotidienne. Ce constat peut être considéré en lien avec les résultats du chapitre 2.
Le chapitre 4 se focalise sur le rôle qui a l’influence sociale dans la formation des anticipations des agents économiques. Tout comme dans le chapitre 3, l’ensemble des données transversales répétées du Michigan Consumer Survey est transformé en un pseudo-panel en utilisant les cartes auto-organisatrices de Kohonen (Kohonen, 1982). Ceci permet de surveiller la formation des anticipations des cohortes sur toute la période disponible (janvier 1978 à juin 2013). Ensuite, le concept théorique d’information “trans-fer entropy” (Schreiber, 2000) est utilisé pour révéler le rôle des influences sociales dans la formation des anticipations, ainsi que pour souligner la structure de réseau. Finale-ment la correction de Panzeri-Treves (Panzeri and Treves, 1996) est appliquée au début de la procédure d’évaluation, afin de contrôler pour un possible biais d’échantillonnage. Je demontre que l’influence sociale dépend fortement des caractéristiques sociodémo-graphiques et coïncide aussi avec un haut degré de connectivité et une position centrale à l’intérieur du réseau d’influence sociale. Le réseau d’influence sociale construit de cette manière suit la loi de puissance et expose ainsi une structure similaire aux réseaux observés dans d’autres contextes.
Le chapitre 5 présente une méthodologie conseillé pour la collecte de données d’opinion pour son implémentation dans le futur. Comme il a été discuté plus haut, jusqu’à présent, ce processus de collecte de données dépendait fortement des sondages pour évaluer les opinions et les anticipations des agents économiques concernant les prospections économiques ou les perceptions des évolutions économiques antérieures. Dans l’hypothèse que l’Internet sert aujourd’hui de large réservoir pour l’expression d’opinions et d’anticipations, ce chapitre propose une méthodologie pour construire un indicateur d’opinions économiques qui analyse des données textuelles non-structurées disponibles librement sur l’internet. Ceci est possible en utilisant des technologies
1.1. Introduction Française 5 modernes d’analyse d’opinion et de texte en combinaison avec l’analyse économétrique traditionnelle. Le site web www.insen.eu fondée sur le principe de “crowdsourcing” est présenté dans ce chapitre. Ce dernière été mis en place en vue de ce projet afin de collecter un ensemble de données d’apprentissage nécessaires à la construction de l’indicateur d’opinions économiques web. Un indicateur d’opinion fondé sur le web selon la méthodologie décrite est capable de fournir plus d’information actualisée sur les opin-ions des individus que le sondage mensuel traditionnel, ce qui permet d’identifier les tendances économiques aussitôt qu’elles apparaissent.
Dans le chapitre 6, la notion d’interactions sociales est contextualisée. Le système européen d’échange de quotas d’émission (ETS) est analysé de point de vu du réseau. Le système européen d’échange de quotas d’émission a été créé en 2005 afin de remplir les objectifs de réduction d’émissions, conformément à ce qui a été défini par le Protocol de Kyoto et au plus bas coût. L’échange des quotas d’émissions cherche à exploiter les différents coûts marginaux entre pays, entreprises, industries ou même différentes branches à l’intérieur d’une compagnie. Le cout marginal engendrée par la réduction d’une unité supplémentaire d’émissions de gaz à effet de serre. Le système est fondé sur un principe de “plafonnement”, selon lequel les unités d’émission autorisées, appellés des quotas d’émission, sont allouées aux émetteurs de gaz à effet de serre. Ces quo-tas sont attribués en tenant en compte des données historiques d’émissions. Ils sont plafonnés en fonction des objectifs fixés de réduction des émissions. Ainsi, les quotas d’émissions deviennent un bien rare que les participants peuvent échanger ou négocier sur le marché. Les participants au marché qui sont légalement obligés de réduire leurs émissions doivent périodiquement céder le montant de quotas d’émission se trouvant en leur possession. Ceux-ci sont ensuite comparés avec les émissions effectuées, qui sont enregistrées en permanence par les installations correspondantes dans le but de vérifier si les objectifs de réduction des émissions ont été atteints. Si les quotas disponibles ne satisfont pas les émissions réalisées, le participant se voit dans l’obligation de payer une amende proportionnelle aux quotas d’émissions qui lui ont fait manquer les obligations ciblés de réduction des émissions. Les installations concernés peuvent être des usines, des centrales électriques ou même des avions. Actuellement, il y a autour de 11.000 installations qui sont intégrées dans l’ETS. L’ETS n’est pas seulement ouvert aux en-treprises devant se conformer aux objectifs de réduction des émissions de gaz à effet de serre. D’autres entités, n’ayant pas d’obligation réglementaire, sont admises aussi, con-tre paiement, à négocier sur le marché d’émissions. Les quotas d’émission peuvent êcon-tre négociés bilatéralement, en vente libre via un courtier ou sur un des marchés européens d’échanges climatiques (marché au comptant). Pour la période, pour laquelle l’ensemble de données de transactions est disponible (2005–2011), la forme la plus commune de transactions était “la vente libre”.
C’est une obligation légale pour chaque transaction dans l’ETS d’être enregistrée dans un système comptable. Cette information est accessible au public avec un délai de trois ans. Au début, ces registres étaient organisés au niveau national. Depuis 2008, cette fonction est assurée par le Journal des Transactions Communautaire Indépendant (CITL) accessible en ligne sur http://ec.europa.eu/environment/ets/. Les
don-nées des transactions provenant du CITL constituent la base de l’analyse fondée sur les réseaux de l’ETS de l’UE réalisée dans le chapitre 6. L’ensemble de données sur les transactions proviennent du CITL. Elles contiennent le cachet de l’heure exacte de la transaction, son volume, l’information sur les comptes actifs, ainsi que les données sur l’attribution des quotas, la cession des quotas et les émissions vérifiées. L’ensemble de données brutes contient approximativement 520.000 transactions, auxquelles ont été ajoutées les informations sur les prix comptant d’après Bloomberg, ainsi que les données sur la structure de propriété et le type d’entreprise (Jaraite et al., 2013).
Une analyse fondée sur le réseau du marché européen des quotas d’émission est alors réalisée. Nous construisons un réseau fondé sur l’ensemble de données transactionnelles. Les agents actifs sur le marché des quotas d’émission sont considérés comme des som-mets. Ces sommets sont reliés par des arêtes dirigées sous forme de transactions depuis le vendeur (le sommet source) jusqu’à l’acheteur (le sommet cible). Les arêtes sont pondérées par le volume d’EUA transférés au cours de la transaction respective. Le but est d’examiner le lien qui existe entre la structure du réseau et le fonctionnement du marché. Par ailleurs, nous étudions si l’organisation du marché se voit reflétée dans la structure du réseau: Quels facteurs sont pertinents pour le processus de concordance au sein du ETS? Est-ce que la structure du réseau soutient l’idée d’exploitation par le marché de quotas d’émissions de la différence dans les coûts de réduction marginaux? Est-ce que la position d’un agent à l’intérieur du réseau a une implication sur son ap-titude à créer des revenus à partir de la négociation? Nous démontrons que le réseau présente une forte structure centre-périphérie, aussi reflétée dans le processus de forma-tion du réseau : En raison d’un manque de places du marché centralisé, les opérateurs des installations sujettes aux règlements du ETS de l’UE doivent recourir aux réseaux locaux d’intermédiaires financiers s’ils souhaitent participer au marché. Il est démontré que cela compromet l’idée centrale du ETS, à savoir celle d’exploiter les differents coûts de réduction marginaux.
1.2
English Introduction
Social interactions are in the core of economic activities. Their treatment in Economics is however often limited to a focus on the market (Manski, 2000). The role social interactions themselves play for the behavior of agents as well as the formation of their attitudes is often neglected. This is despite the fact that already early contributions in economic literature have identified them as important determinants for the decision making of economic agents as for example Sherif (1936), Hyman (1942), Asch (1951), Jahoda (1959) or Merton (1968). In consumer research, a field on the intersection between Economics, Sociology and Psychology, on the other hand social interactions (social influences) are considered to be the “... most pervasive determinants [...] of individual’s behaviour...” (Burnkrant and Cousineau, 1975). The thesis at hand bridges the gap between social interactions and their influence on agents expectation formation and behavior.
1.2. English Introduction 7 How do agents form their expectations, how are they influenced by other agents in this process and which other factors could play a role for an expectational bias? Moreover a concept is presented how sentiment data could be collected in the future using modern text mining techniques. In Chapter 6 of the thesis the European emission market is analyzed from a social network perspective. It is investigated how the network structure reflects the functioning of the market and how the position of agents within the network influences their ability to create revenues from trading.
In Chapters 2 to 4 of this thesis the question of expectational rationality is inves-tigated. Already early contributions of Knight (1921) and Keynes (1936) suggest that decision making of economic agents is largely influenced by their expectations and their assessment of risk, reflecting not least psychological aspects (Carnazza and Parigi, 2002). Whether agents rationally anticipate future economic developments or policy decisions or not, is thus a question on which a multitude of theoretical economic work hinges. The Phillips curve is in this context probably the most prominent example (Phillips, 1958).The empirical finding by William Phillips asserts a negative relationship between the inflation rate and the unemployment rate, which subsequently was used as a me-chanic to influence the labor market via monetary policy. Along Milton Friedman (1968), Thomas Sargent et al. (1973) and Robert Lucas (1976) such attempts would however at least in the medium run be neutralized by rational agents, who take an anticipated higher future inflation rate into account when negotiating their wages. It is thus not very surprising that assumptions about expectations with regard to the inflation but also other economic variables are crucial for economic theory as well as for policy making.
Given the importance of expectations for economic theory, early proponents of be-havioral economics such as George Katona devoted themselves to develop instruments to measure attitudes and expectation of economic agents towards the economy. Katona’s work eventually resulted in the field of survey based economic research and led to the creation of survey based consumer and business confidence indicators in the early post-war period, which until today represent important sources of data complementary to measurable macroeconomic variables in forecasting and evaluating trends in the evolu-tion of the economy (Katona, 1974). The University of Michigan Consumer Sentiment Index (MCSI), conceptualized by George Katona and regularly updated since 1955, or the Consumer Confidence Index (CCI), which started in 1967 and is since then updated and maintained by the U.S. Conference Board are early and well known examples of indicators directed at households. Cross section data from the former of these two indi-cators is used in Chapter 3 and Chapter 4. Another example of a household survey is the French Enquête mensuelle de conjoncture auprès des ménages (ECAMME) of which micro-level data was used in Chapter 2. The survey based assessment of economic sen-timent was later on extended to businesses. The Philadelphia Fed Index, conducted since 1968, or the German IFO Business Climate index, which originated in the late 1940s and is regularly published since 1972, can be cited exemplarily in this context. Similar data is nowadays collected in each major economy. Additional to that, so called composite indicators can be found, as for example the European Economic Sentiment Indicator (ESI) compiled by the European Commission, which combines data from households
and businesses in different countries and industries respectively. Other sentiment sur-veys are addressed to highly specialized audiences as for example professional forecasters or purchasing managers. An example for the former category would be the Philadelphia Fed’s Survey of Professional Forecasters.
The data about agents expectations typically collected in consumer or household surveys is qualitative and not quantitative. This means, with regard to for example the evolution of inflation, respondents are normally asked to choose between different ordered categories instead of giving a precise number of the expected inflation rate in for instance twelve months from the time of the interview. As will be seen later on, individuals have a good feeling for the trend but often lack an accurate notion of the magnitude. To control for the problem that only qualitative expectation information is available in most of the cases, different quantification methods can be used. The approaches therefore can be grouped into two categories: the regression approach which roots can be tracked back to Anderson (1952), Pesaran (1985, 1987) as well as Pesaran and Weale (2006b) on the one hand, and the probability approach which was initially developed by Theil (1952) and Carlson and Parkin (1975) respectively, and thus is often denominated by the latter as the Carlson-Parkin approach on the other hand. The different chapters in this thesis make use of the elements discussed above. In detail the following topics are discussed in the respective chapters.
Chapter 2 investigates whether the formation of individual inflation expectations is biased towards a consensus and is thus subject to herding behavior. Basing on the traditional Carlson-Parkin approach to quantify qualitative survey expectations and its extension by Kaiser and Spitz (2002) in an ordered probit framework, a method to gain individual level inflation expectations is proposed using a Markov chain Monte Carlo Hierarchical Bayesian estimation method. This method is applied to micro survey data on inflation expectations of households from the monthly French household survey “Enquête mensuelle de conjoncture auprès des ménages - ECAMME" (January 2004 to December 2012). Since the ECAMME dataset only contains a very basic panel structure, a fraction of households is interviewed three months in a row, the self-organizing Kohonen map algorithm (Kohonen, 1982) is used to create a pseudo panel in order to be able to track inflation perceptions/expectations of different cohorts over the whole time period in which the dataset is available. Finally, a modified version of the non-parametric test for herding behavior by Bernardt et al. (2006) is conducted. The modification is such that the test can directly be applied to cohort-level posterior distributions resulting from the MCMC estimation method. It is shown that the expectation formation is not subject to a bias towards the consensus. In contrast, it exhibits a strong anti-herding tendency which is consistent with the findings of other studies (Rülke and Tillmann, 2011) and supports the notion of heterogenous expectations.
Chapter 3 studies possible reasons for the rationality bias in agents expectations. In contrast to the previous chapter, here data from the Michigan Consumer Survey is used since it contains some sort of basic panel structure. This means that a high percentage of respondents can be found again in the pool of interviewees twelve months after their first interview. This panel structure of the Michigan Consumer Survey together with its
1.2. English Introduction 9 survey questions about expectations with regard to different economic variables as well as perceptions thereof twelve months later is used to group respondents into “rational” and “non-rational” agents. If the perception variables were not available, a technique to quantify qualitative survey information using an Hierarchical Ordered Probit model (Lahiri and Zhao, 2015) is used to construct them. Then the expectational gap between rational and non-rational individuals is decomposed using a detailed linear (Oaxaca, 1973; Blinder, 1973; Yun, 2004) / non-linear (Bauer and Sinning, 2008) Oaxaca-Blinder decomposition. The moments of the estimates are computed along the methods outlined by Rao (2009) and Powers et al. (2011). The code for both the HOPIT model as well as the decomposition method used in this chapter had to be written from scratch. The
Rand C++ code can be found in Appendices B and C of the same chapter respectively.
It is shown that the rationality bias can be to a large and significant degree explained by sociodemographic variables contained in the Michigan Consumer Survey (education, age, etc.) and other observable variables. The latter group comprises variables stemming from the survey questions themselves, as for example the consumption of news by the respondents prior to the interview which turns out to be a significant determinant for the “rationality”-bias under investigation. The expectational bias is thus probably not so much a question of rationality but more reflects the experiences and perceptions of individuals of the economy in daily live. This outcome can be seen in line with the results from Chapter 2.
Chapter 4 investigates the role of social influence for the expectation formation of economic agents. Like in Chapter 3 the repeated cross-section data set of the University of Michigan consumer survey is transformed into a pseudo-panel using self-organizing Kohonen maps (Kohonen, 1982).This allows to monitor the expectation formation of cohorts over the whole available time span (January 1978 to June 2013). Subsequently the information theoretic concept of transfer entropy (Schreiber, 2000) is used to reveal the role of social influences on the expectation formation as well as the underlying network structure. To control for a possible sampling bias the Panzeri-Treves correction (Panzeri and Treves, 1996) is eventually applied on top of this estimation procedure. It is shown that social influence strongly depends on sociodemographic characteristics and also coincides with a high degree of connectivity and a central positions within the network of social influence. The network of social influence inferred in this way follows a power-law and thus exhibits a similar structure as networks observed in other contexts. Chapter 5 lays out a concept how economic sentiment data could be collected in the future. As discussed above, this data collection process up to now heavily relies on surveys to evaluate opinions and expectations of economic agents regarding economic prospects or perceptions of past economic evolutions. Under the assumption that the internet nowadays serves as a large reservoir for the expression of opinions and expec-tations, this chapter proposes a concept to construct an economic sentiment indicator analyzing unstructured textual data which is freely available on the internet making use of modern text and sentiment mining technologies in combination with traditional econometric analysis. The crowd-sourcing website www.insen.eu is presented. It was set up for this project in order to collect a training dataset for the envisioned web-based
eco-nomic sentiment indicator. It is argued that a web-based sentiment indicator, along the concept outlined, will be able to deliver more up-to-date sentiment information than the traditional monthly survey based sentiment indicators, which allows to track economic trends as they are emerging.
In Chapter 6 the notion of social interactions is brought into a market context. The European Emission Trading System (ETS) is analyzed from a network perspective. The European Emission trading System was created in 2005 in order to fullfil the tar-gets for the reduction of green house gas emissions into the atmosphere along what was defined by the Kyoto Protocol as cost efficient as possible. Emission Trading seeks to exploit differing marginal abatement costs, this is the marginal cost of reducing green house gas emission by one unit, between countries, firms, industries or even between different branches within a company. The system bases on a “cap-and-trade” principle in which permitted emission units, so called allowance units are allocated to emitters of green house gases. These assigned allowance units normally depend on historical yearly green house gas emission data and are capped with regard to committed emission re-duction targets. Thereby allowance units become a scarce good which participants can exchange/trade in a market. Periodically market participants who are legally commit-ted to reduce their emissions have to surrender the amount of allowance units in their possession. These are subsequently compared with the realized emissions which are permanently recorded at the respective installations, to check if the emission reduction targets were met. If the available allowance units fall short of the realized emissions, the obliged market participant has to pay a fine proportional to the allowance units by which the emission reduction obligations were missed. Installations can be factories, power plants or even aircrafts. Currently there are around 11,000 installations captured by the ETS. The ETS is open not only to companies who have to comply with green-house gas emission reduction targets. Also other entities which don’t fall under the ETS regulation are against a fee allowed to trade on the emission market. Allowance units can be traded bilaterally, over the counter via a broker or on one of Europe’s climate exchange markets (spot markets). For the time for which the transaction data set is available (2005 - 2011) the most common form of transactions was “over the counter”.
It is a legal obligation that each transaction in the ETS is recorded in some sort of accounting system (registries). This data is accessible to the public with an embargo of three years. At the beginning these registries were organized on a national level. Since 2008 this function is resumed by a central Community Independent Transaction Log (CITL) accessible online under http://ec.europa.eu/environment/ets/. The transaction data from the CITL form the base of the network-based analysis of the EU ETS conducted in Chapter 6. The transaction data set was scraped from the CITL. It contains the exact time stamp of the transaction, its volume, information about the accounts active in the ETS as well as data with regard to the allowance allocation, the surrendering of the allowances as well as the verified emissions. The raw data set contains approximately 520,000 transactions to which spot price information from Bloomberg as well as data about the ownership structure and the type of the respective companies (Jaraite et al., 2013) were added.
1.2. English Introduction 11 A network based analysis of the European Emission market is then performed. There-fore a network based on the transaction data set is constructed. Agents active in the emission market are thereby regarded as vertices. These vertices are connected by di-rected edges in the form of transactions from the seller (the source vertex) to the buyer (the target vertex). The edges are weighted by the volume of EUAs transferred in the respective transaction. The aim is to investigate the connection between the network structure and the functioning of the market. Among other things it is studied whether the organization of the market is reflected in the network structure, which factors are relevant for the matching process in the ETS, whether the network structure is sup-porting the idea of emission markets to exploit differences in marginal abatement costs and whether the position of an agent within the network has an implication for its abil-ity to create revenues out of a trade. It is shown that the network exhibits a strong core-periphery structure also reflected in the network formation process: Due to a lack of centralized market places, operators of installations which fall under the EU ETS regulations have to resort to local networks or financial intermediaries if they want to participate in the market. It is argued that this undermines the central idea of the ETS, namely to exploit marginal abatement costs.
Chapter 2
Herd behavior in consumer
inflation expectations - Evidence
from the French household
survey
1
2.1
Introduction
Assumptions about expectations regarding inflation are exceedingly relevant for eco-nomic theory as well as policy making. Consumer surveys measuring households’ per-ceptions and expectations regarding the evolution of prices thus have developed into important supplementary tools for monetary authorities and a vivid field of research. The latter is foremost motivated, besides the fact that inflation is an important economic variable directly impacting the welfare of households, by the discussion if and to what degree inflation is fully anticipated and thus if expectations are rational or unbiased. The falsification or verification of several economic theories as for example the well known Phillips curve (Phillips, 1958), heavily base on this question.
Rational Expectations - a short history The theoretical foundation for the notion of rational expectations was laid by the seminal work of Muth (1961). Along Muth agents form their expectations with regard to the future evolution of an economic variable by taking into account to their best knowledge all relevant information available. Under Muth’s strong version of expectational rationality this implies that the expectations of an agent are equivalent to the mathematical notion of conditional expectations. As far as expectations in period t with regard to inflation in period t + 1 are concerned (as relevant in the context of this study), this implies (Snowdon and Vane, 2005, pp. 225):
Pt+1e = E(Pt|Ωt1)
1This chapter bases on a working paper published in the working paper series of the Economics
Faculty of the University Paris 1 Panthéon-Sorbonne (Karpf, 2013).
Here Pt corresponds to the actual inflation rate at time t and Ωt1 to the inflation set
available to the individual in time t − 1. Muth thus implicitly assumes that agents choose a prediction model which along their knowledge is the most accurate. Forecast errors, Muthian expectational rationality doesn’t correspond to perfect foresight, are due incomplete information. Muth also assumes that the expectation formation of agents is not subject to systematic errors. Along Muth a learning effect would lead agents to readjust their prediction model once they realize that their intrinsical forecasting method is erroneous. Sticking to the example of inflation expectations this implies that rational
expectations following Muth exhibit a serially uncorrelated random error �t with mean
zero which is independent from the available information set (Snowdon and Vane, 2005, pp. 225):
Pt+1e = Pt+ �t
The assumption that the error term is uncorrelated from the information set is necessary since this would otherwise imply that agents don’t take full advantage of the information available to them.
The rational expectation hypothesis largely replaced the adaptive expectation hy-pothesis which was dominant in economic modelling up to the 1970ies. In the adaptive expectation model, introduced by Fisher (1911), the expectation formation of agents is based solely on past realizations of the concerned variable and subject to a partial error adjustment if the prediction is not accurate. Formally such a concept could be expressed in what follows (Evans and Honkapohja, 2001, pp. 10):
Pt+1e = Pt−1+ λ(Pt−1− Pt−1e )
The agent thus adjusts his prediction of the future with regard to his prediction error in the past with a rate λ ∈ [0, 1]. Milton Friedman (1968) used this notion of adaptive expectations in his seminal work about the Phillips curve. The Phillips curve, which was an empirical finding by William Phillips (Phillips, 1958), presumes a negative rela-tionship between the inflation rate and the unemployment rate. This relarela-tionship was for long time regarded as mechanical and exploited as a policy instrument. Friedman argued that the goal of lowering unemployment under its natural rate with the help of for example monetary policy would, at least in the medium run be offset by agents adjusting their expectations, by past errors, and comprising the higher inflation rate in their bargaining of wages. For two reasons this however didn’t go far enough for the proponents of the rational expectation hypothesis (Snowdon and Vane, 2005, p. 227):
1. In times of an accelerating inflation rate an error adjustment mechanism of this sort leads to a systematic underestimation of inflation .
2. Instead of taking all available information into account, as proposed by the ratio-nal expectation hypothesis, agents with adaptive expectations only consider past values of the variable in question.
2.1. Introduction 15 This critique most famously found its expression in the seminal work by Sargent and Wallace (1975) who coined the theory of the “policy-ineffectiveness proposition”. Along Sargent and Wallace (1975) every attempt to manipulate the output, for example by monetary policy, would already in short-run be offset by rational agents incorporating the possible effects of taken policy measures into their decision making. The hypothesis of rational expectations was further popularized by Lucas (1976) (this seminal paper became famous under the name “Lucas’ critique”) who argued extending the idea of Muth (1961) that expectations of agents are centered on a unique equilibrium of the economy. Policy measures intending to change the output however would alter this equilibrium (an the expectations) and with it the basis on which this policy decision was taken. Agents in turn would learn the new predictive model and adjust their expectations accordingly. With his critique Lucas directly addressed macroeconomic models which, like the Phillips curve, are based on historic data.
Coinciding with the economic situation in 1970ies, which was characterized by a high inflation and unemployment rate at the same time (due to the oil crisis), the works by Friedman (1968), Sargent et al. (1973) and Lucas (1976) gained significant influence on Economic thinking. Especially Keynesian macroeconomics came under massive pressure, as its results seemed to have become obsolete with the above cited works. Contributions by these early proponents of the rational expectation hypothesis were so influential that today most macroeconomic models comprise assumptions regarding rationality of expec-tations or unbiasedness of expecexpec-tations within the core of their model assumptions. This however does not imply that this assumption is not disputed. Articles like for example by Phelps and Taylor (1977), which can be regarded as direct response to works of the above mentioned authors, sought to reestablish the role of Keynesian Economics. Phelps and Taylor (1977) incorporate expectational rationality in their model, but argue that the fact that wages are normally bargained for multiple periods in advance allows mon-etary policy to still have a stabilizing effect on the economy. Others like Sonnenschein (1973), Debreu (1974) or Mantel (1974) pointed out that individual rationality doesn’t necessarily have implications for aggregate behavior.
In the empirical literature there are multiple, more recent, works which empirically test the hypothesis of rational expectations. Some of them are confirming the hypoth-esis of rational expectations, as Thomas (1999) or Ang et al. (2007), others are, at least partially, rejecting it, like Mehra (2002), Mankiw and Reis (2002), Roberts (1997) or Baghestani (2009). This study tries to contribute to this empirical stream of the literature.
Research Question Using microlevel data from the monthly French household
sur-vey (Enquête mensuelle de conjoncture auprès des ménages - ECAMME)2 this paper
addresses the problem field of rationality or unbiasedness of consumer (household) ex-pectations from a different perspective which by now got fairly little attention. It is investigated if some kind of herd- or flocking-behavior is identifiable within the
expec-2This survey has already been used by other authors to investigate the issue of rational expectations,
tation formation of consumers/households. Herding behavior in this context is defined as a bias towards the consensus of expectations which is assumed to be the mean of all prior expectations within a period. This issue will be discussed in detail later on. The structure of the study is as follows: The traditional probabilistic method, see Theil (1952) and Carlson and Parkin (1975), to quantify survey expectations is extended in a hierarchical Bayesian ordered probit framework to gain individual/cohort-level infla-tion expectainfla-tions. Applying a non-parametric test by Bernardt et al. (2006) of herding behavior to the quantified cohort-level inflation expectation estimates finally allows to investigate if consumer expectations of inflation are solely based on the individual as-sessment (anti-herding) or if they are biased in the direction of a general sentiment or consensus (herding).
The only work, the author is aware of that investigates herding behavior in the context of surveys is the work by Franke et al. (2008). This paper develops a micro-founded model of herding in which agents can switch between two states, optimistic and pessimistic. By means of business survey data from the German ifo and ZEW survey, Franke shows that there is an empirically significant co-movement of agents in terms of transition probabilities between the two states. The paper at hand is different in two ways: First, it addresses the herding behavior of consumers with regard to inflation expectations instead of business sentiment, second, the research question of herding is addressed in a quantitative instead of a qualitative manner as in the paper cited above, thus seeks to answer the question if respondents are biased in the direction of a quanti-tative consensus.
2.2
The Data - Enquête mensuelle de conjoncture auprès
des ménages
The Enquête mensuelle de conjoncture auprès des ménages, in the remainder abbrevi-ated by the official acronym ECAMME is a monthly survey conducted by the French statistical office the Institut National de la Statistique et des Études Économiques (short INSEE) since 1987. The ECAMME succeeded a row of periodic household sentiment surveys conducted by INSEE since as early as 1958. Although interviews were originally only conducted twice a year, the collection of opinions with regard to the evolution of the French economy as well as buying attitudes were in the focus right from the beginning. In 1968 the frequency was increased to three interview sessions per year. Since 1972 the ECAMME is part of the Harmonised EU Programme of Business and Consumer Surveys of the European Commission, which has the goal to standardize survey based economic research within the European Union. From 1987 on, the establishment of the ECAMME as it is known today, the data was finally collected in a monthly manner.
The ECAMME is conducted via telephone interviews with approximately 3300 house-holds per month (until 2006 with the exception of August), which are randomly selected from the official French telephone register. The ECAMME exhibits a basic panel struc-ture, as the households are interviewed in three consecutive months. As will be seen later, this panel structure is however not sufficient for the here envisaged task. A panel
2.2. The Data - ECAMME 17 structure thus has to be artificially established using pseudo panelization techniques. The ECAMME survey collects information about the financial situation, employment and the standard of living of the interviewed households as well as their perceptions and expectations regarding various economic variables. In the context of this paper question 5 and 6 within ECAMME are of importance, which ask for the households perceptions and expectations with regard to past and future consumer price developments:
(Q5) Do you think that prices in the last twelve months have ... (Trouvez-vous que,
au cours des douze derniers mois, les prix ont...) • increased strongly (fortement augmenté) • increased moderately (modérément augmenté) • stagnated (stagné)
• decreased (diminué)
(Q6) In comparison with the last twelve months how do you think the evolution price
will be in the next twelve months ... (Par rapport aux douze derniers mois, quelle sera à votre avis l’évolution des prix au cours des douze prochains mois ...)
• prices will increase with a higher rate (elle va être plus rapide)
• prices will increase with the same rate (elle va se poursuivre au même rythme) • prices will increase with a smaller rate (elle va être moins rapide)
• prices will stay the same (les prix vont rester stationnaires) • prices will go down (les prix vont diminuer)
For the here conducted research micro data from January 2004 until December 2012
was available, supplied by Réseau Quetelet as a distributor for INSEE.3 After sorting
out non responses, especially in Question 5 and Question 6, and flawed data, this cor-responds to all in all 185,945 observations or approximately 1,788 usable interviews per month. The data contains a wide variety of socio-economic information, for example household size, level of education of the head of the household as well as his/her com-panion, employment status of the head of the household as well as his/her comcom-panion, income quartile, age, region, the number of children, the number of persons living in the household et cetera.
ECAMME covers a wide range of the French society: The average participant in the available dataset is however 55.4 years old (st. dev. 16.58), has 0.4 (st.dev. 0.81) children and lives in a household with 2.4 persons (st.dev. 1.3). Of the individuals in the data set 23 % finished primary and 27.5 % finished secondary education. 20.2%
age children hh.size
sex education mean st. dev. mean st. dev. mean st. dev. male primary 68.14 12.47 0.09 0.44 1.98 1.04 secondary 55.90 15.19 0.32 0.74 2.42 1.22 post secondary 52.52 14.38 0.41 0.80 2.51 1.23 tertiary 49.31 15.90 0.51 0.89 2.59 1.31 female primary 68.99 12.44 0.08 0.43 1.81 1.04 secondary 55.42 15.92 0.42 0.82 2.48 1.35 post secondary 50.74 14.44 0.54 0.90 2.71 1.33 tertiary 45.99 14.34 0.68 0.97 2.76 1.38
Table 2.1: Descriptive Statistics - ECAMME data set (Jan 2004 - Dec 2012)
sex education income
1st quart. 2nd quart. 3rd quart. 4th quart. male primary 42.92 33.59 17.25 6.25 secondary 17.83 26.15 30.97 25.06 post secondary 17.4 26.06 35.01 21.53 tertiary 7.48 11.94 24.17 56.41 female primary 54.22 30.55 11.72 3.51 secondary 24.08 28.71 28.87 18.35 post secondary 22.2 27.53 32.32 17.95 tertiary 9.88 16.27 26.41 47.44 male 19.38 23.06 27.04 30.53 female 27.36 25.52 24.53 22.58
Table 2.2: Descriptive Statistics - Income - ECAMME data set (Jan 2004 - Dec 2012) had completed a post-secondary school and 29.2% held a university degree. For some descriptive statistics of the available ECAMME dataset the reader is referred to Table 2.1 and Table 2.2.
2.3
A simple non-parametric test for herding
2.3.1 The idea
In this section a simple non-parametric test for herding is introduced which was originally developed by Bernardt et al. (2006) to test for a potential biasedness of professional forecasters. It is then shown how this test could be applied to consumer survey data.
It is assumed that consumers intrinsically form expectations over future developments for example of prices in a similar way professional forecasters do, by taking into account every disposable information or evidence (this means their own daily consumption expe-rience, communication with other people, the consumption of media et cetera). The dif-ference of course is that consumers, uncomfortable with economic measures, might have difficulties in quantifying inflation within the next months. This problem is addressed in consumer sentiment or household surveys by asking for qualitative tendencies rather than for exact numbers. Evidence shows that the aggregation of such sentiments delivers a pretty precise picture of the future evolution of prices (Ludvigson, 2004; Mourougane
2.3. A simple non-parametric test for herding 19 consensus ¯πe t−1 realized value πe t+1 ˆπe t,t+1 herding anti-herding ˆπe t,t+1 anti-herding herding
Figure 2.1: Schematic plot of the idea behind the herding test by Bernardt et al. (2006) and Roma, 2003; Howrey, 2001; Vuchelen, 2004; Vuchelen and Praet, 1984). The prob-lem of quantifying consumer expectations and thus how to gain quantitative forecasts from qualitative consumer expectations collected by surveys (similar to earning forecasts by analysts) on an individual/cohort-level will be addressed in the next section.
For the sake of clarity, the terminology of the literature of finance is adopted: A fore-cast in this sense is a quantified formulation of expectations over the future development
of an economic variable, here inflation πe
t,t+1. A consensus forecast ¯πe is understood
as the aggregated and quantified expectation of a reference group, for example other individuals which formulated their expectations at an earlier point in time (later on, the
mean of all prior forecasts for the same target value is used as the consensus).4 A forecast
πe
t,t+1 at time t for inflation πt+1 at time t + 1 is regarded as unbiased if, given all
avail-able informations, it equals the median of all posteriors ˆπe
t,t+1, this means πet,t+1= ˆπet,t+1.
Thus, if forecasts are unbiased, there is no reason to assume that they generally tend to be higher or lower than the realized value of the forecasted quantity, this means forecasts should randomly distributed around the consensus. In this sense the probability, given the available information set, that a forecast exceeds or falls short of the realized value
πt+1 can be assumed to be equally 0.5: P (πet,t+1 < πt+1) = P (πt,t+1e > πt+1) = 0.5. If
a forecast is however biased it can be assumed that it deviates from the median of pos-teriors. Therefore the probabilities that the realized values of the forecasted quantities
4
Consensus forecasts find widespread usage, especially in applied Economics. They are regularly published by newspapers or (central) banks to inform readers or clients what professionals in the financial industry or in research think about the future evolution of economic variables. There is a large amount of literature showing that the simple combination of forecasts by averaging can increase the accuracy significantly (see for example (Bates and Granger, 1969; Batchelor, 2001; Jones, 2014)).
will be above or below the forecast, also change. In terms of herding, a bias will be one towards the extant consensus of a reference group (the mean of prior expectations/fore-casts with regard to the same variable of [all] other individuals). If an agent herds and his forecast lies above the consensus then the probability that his forecast will be too low is more than one half. Vice versa the probability that a forecast will exceed the realized value given a bias towards the consensus where the forecast lies below the con-sensus is equally more than one half. Thus, seen from the opposite perspective and more
formal: If the agent herds toward the consensus ¯πe
t,t+1 and his posterior ˆπt,t+1e is above
the consensus, he will choose a forecast πe
t,t+1 ∈ {¯πet,t+1, ˆπt,t+1e }. So if πt,t+1e > ¯πt,t+1e , it
will exceed the realized value with probability less than one half, as πe
t,t+1 < ˆπet,t+1 and
P (πt+1 < πt,t+1e ) < P (πt+1 < ˆπt,t+1) = 12. Herding can be assumed if the two following
conditional probabilities fulfill the following conditions:
P (πt+1 < πt,t+1e |¯πet,t+1< πet,t+1, πet,t+1�= πt+1) <
1
2 (2.1)
P (πt+1 > πt,t+1e |¯πet,t+1> πet,t+1, πet,t+1�= πt+1) < 12 (2.2)
Anti-herding on the other hand, thus a bias away from the consensus forecast, is fulfilled if:
P (πt+1 < πt,t+1e |¯πet,t+1< πet,t+1, πet,t+1�= πt+1) >
1
2 (2.3)
P (πt+1 > πt,t+1e |¯πet,t+1> πet,t+1, πet,t+1�= πt+1) > 12 (2.4)
A schematical display of the idea behind the herding test can be found in Figure 2.1.
2.3.2 The Test Statistics
With regard to the idea presented in Section 2.3.1 Bernardt et al. (2006) construct
the following test statistics which is also used here. The conditioning events z+
t , if
πe
t,t+1 > ¯πt,t+1e , and zt−, if πet,t+1 < ¯πet,t+1, are defined. According to this the indicator
functions,
γt+= 1 if zt+ otherwise γt+= 0 (2.5)
γt−= 1 if zt− otherwise γt−= 0 (2.6)
are constructed. The variables
δt+= 1 if zt+ AN D πte> πt otherwise δt+= 0 (2.7)
δt−= 1 if zt− AN D πte< πt otherwise δt−= 0 (2.8)
indicate overshooting and undershooting with regard to the realized value. The mean of both conditional probabilities from above measures if the forecasts overshoot/under-shoot the realized variable in the same direction in which they overovershoot/under-shoot/underovershoot/under-shoot the consensus forecast.
S(zt−, z+t ) = 1 2 � � tδt+ � tγt+ + � tδt− � tγt− � (2.9)