HAL Id: hal-02453078
https://hal-univ-lemans.archives-ouvertes.fr/hal-02453078
Submitted on 6 Apr 2020
HAL is a multi-disciplinary open access
archive for the deposit and dissemination of
sci-entific research documents, whether they are
pub-lished or not. The documents may come from
teaching and research institutions in France or
abroad, or from public or private research centers.
L’archive ouverte pluridisciplinaire HAL, est
destinée au dépôt et à la diffusion de documents
scientifiques de niveau recherche, publiés ou non,
émanant des établissements d’enseignement et de
recherche français ou étrangers, des laboratoires
publics ou privés.
Thermal imaging of the structural damping induced by
an acoustic black hole
Thomas Durand-Texte, A. Pelat, Guillaume Penelet, F. Gautier, Mathieu
Secail-Geraud
To cite this version:
Thomas Durand-Texte, A. Pelat, Guillaume Penelet, F. Gautier, Mathieu Secail-Geraud. Thermal
imaging of the structural damping induced by an acoustic black hole. Journal of Applied Physics,
American Institute of Physics, 2020, 127 (2), pp.025102. �10.1063/1.5128089�. �hal-02453078�
an acoustic black hole
T. Durand-Texte,1 A. Pelat,1G. Penelet,1 F. Gautier,1 and M. Sécail-Géraud1
LAUM UMR CNRS 6613, avenue Olivier Messiaen, F-72085 Le Mans cedex 9, France
An Acoustic Black Hole (ABH) is a passive and efficient way to control the flexural vibrations of beams or plates. In its classical form, an ABH consists in a local reduction of the thickness of a structure according to a power law profile, associated to a thin visco-elastic coating placed in the thinnest region. A focalisation and a wave trap effect occur, leading to a localised energy dissipation which induces a local temperature increase. The objective of this paper is twofold. Firstly, the goal is to develop an adequate experimental methodology enabling to map accurately the small temperature variations induced by the local dissipation mechanism. Secondly, from the thermal standpoint, the goal is to provide experimental evidence of a local temperature increase associated to a damping effect in the case of an ABH beam. This paper thus describes a new kind of experimental methodology able to provide original data, bringing some new insight in the ABH physical understanding and the analysis of structural damping.
I. INTRODUCTION
Using the Acoustic Black Hole (ABH) effect is a way to passively control vibrations without adding mass. The poten-tial use of this technique mainly targets niche applications in which the weight of the devices used for vibration control is a constraint. This is typically the case, for instance, for the au-tomotive industry, where the major challenge is to guarantee the reliability of the structure and a low level of interior noise with a limited global mass for the vehicle.
For a simple vibrating structure like a beam, an ABH ter-mination can be achieved by locally reducing the thickness of the beam according to a power law profile. In the ideal case, originally introduced by Mironov1, the thickness should
decreases down to zero. As a consequence, for an incident wave incoming to the edge, the wave speed along this profile decreases down to zero and the time of flight tends towards infinity. In parallel, the amplitude of the wave increases up to infinity, due to energy flow conservation. Thus, this ideal case corresponds to a singularity, for which the mechanical reflection coefficient is equal to zero, without any dissipation. In practice, the ideal ABH cannot be perfectly manufactured: as the end of the profile is necessarily truncated, the resid-ual thickness of the beam at its extremity cannot be eqresid-ual to zero. This defect induces a significant wave reflection which can be compensated by gluing a thin visco-elastic layer along the tapered region2. Such an ABH presents a low reflection
coefficient.
In the literature, various models have been developed3–6to
give some understanding of ABH features which can be iden-tified experimentally7, for instance using the impedance
ma-trix method for plane waves3, multimodal4models, wavelets5
or the hypergeometric approach6, among others. It is
no-tably shown that the typical arched shape of the reflection coefficient curve is due to resonances of the complex modes trapped in the ABH ending8,9, thoroughly studied over the
past years4,10–13. Indeed, all the published studies show that
the ABH effect, either in 1D or 2D structures, leads to efficient energy dissipation14. Various designs of the ABH devices
have been proposed by optimising the thickness profile15–19,
but the damping profile itself is rarely fully optimised. Recent studies have shown that tuning the damping in a
profiled beam termination results in a critical coupling of the complex modes trapped within the ABH taper13: the value of
the reflection coefficient can indeed achieve zero at a given frequency corresponding to the resonance of a local mode. Consequently, controlling the amount of damping is a key point to achieve critical coupling, and this can be done for instance with active methods using polymers whose damping properties are controlled by adjusting their temperature20.
All in all, controlling the damping profile is one of the promising lines aiming at improving the design of ABH end-ings. This prospect also relies on the use of advanced mea-surement techniques to characterise experimentally the dissi-pation of energy. Although inverse techniques result in such a characterisation for relatively simple academic cases21,
me-chanical damping is usually complex to model because of the multiple mechanisms involved: visco-elasticity, thermo-elasticity, viscous coupling with the surrounding air, micro friction forces at the interfaces... All these mechanisms lead to energy conversion into heat, and thus in fine to a local tem-perature increase22, which, in turn, may be considered as a
global indicator allowing to identify the regions where dissi-pation occurs, without any distinction regarding their physical origin. This is typically the main interest in thermal measure-ments applied to vibrations23–27, aiming at optimising the
me-chanical parameters and adjusting them for specific needs, for instance for cardboards28or rubbers29.
The work presented in this paper aims at developing an ex-perimental methodology in order to characterise the spatial distribution of mechanical losses in vibrating thin structures, by means of thermal map measurements. The development of an experimental technique enabling to measure accurately the temperature distribution on a vibrating structure is pre-sented; this technique is then applied to the thermal imaging of an ABH beam termination. Such thermal imaging of an ABH is, to the authors’ knowledge, the main novelty provided by the paper. The major difficulty is indeed here to measure small temperature variations (therefore with a low signal to noise ratio) resulting from the local dissipation of mechanical energy. In order to address this objective, an infra-red cam-era is used and an adequate signal and image processing has been implemented. The paper is organised as follows. Firstly, section II details the experimental set-up (Sec. II.A) and the
2 mechanical characterisation with usual methods (Sec. II.B).
Secondly, the experimental protocol and the image processing of raw data extracted from the infrared camera are presented in section III. Thirdly, the temperature variations generated by mechanical damping are experimentally described in sec-tion IV.A. Finally, the transient variasec-tion of the thermal profile of the ABH is studied in section IV.B.
II. EXPERIMENTAL SET-UP AND MECHANICAL CHARACTERIZATION
A. Experimental set-up
A sketch of the experimental set-up is presented in Fig. 1.(a). The device consists of an aluminum beam termi-nated with the ABH at the bottom end. Apart from the black hole termination, the beam is 605 mm long, 20 mm wide, and 5 mm thick. Flexural waves can be generated along the beam by means of a dynamic shaker, whose location is close to the top end at position x = −500 mm (see Fig. 1.(a)). In order to decouple the system from external vibration noise, both the beam and the shaker are hung to two different gallows screwed to a marble plane set on dampers.
The ABH is located at position x = 0, where the thickness of the beam decreases slightly down to 290 µm over about 155 mm and is extended by a 25 mm long plateau of constant thickness. The plateau leads to a significant enhancement of the ABH effect, and an appreciable shift of the frequency band, for which the ABH is active, toward low frequencies30.
Considering the −→x axis defined in Fig. 1.(a), the thickness variations are given by:
h(x) = (
h0(1 − x/x0)2, if xP≥ x ≥0
≈ hP, if x ≥ xP
(1)
with h0 (50 mm) the uniform thickness of the beam, x0
(204 mm) the position at which h(x) = 0, xP (155 mm)
the position at which the thickness remains constant and hP
(290 µm) the thickness of the plateau. In order to provide some evidence of the local temperature increase due to the dis-sipation of mechanical power, the naked (without added layer) and coated (with added layer) ABH configurations are com-pared (see Fig. 1.b). The visco-elastic layer is a double-sided tape, made of a cotton fabric coated with a rubber adhesive and a silicon liner (supplier https://www.foussier.fr, product ref: 438347). The estimated thickness of the layer is about 230 µm . The resulting dissipation mechanism is characterised through thermal measurements using an infra-red camera (FLIR X6580c), combined to vibration field mea-surements carried out with a Scanning Laser Doppler Vibrom-eter (SLDV, Polytec PSV500Xtra). Both devices are placed in front of the beam, at a distance of 1170 mm and 760 mm re-spectively (cf. Fig. 1.(a), where the SLDV is placed behind the beam for the sake of visibility). A shaker excites the beam 500 mm far from the ABH and an impedance sensor (PCB288d01) is used to measure the mechanical impedance at the driving point. Finally, the front (measured) side of the
≈1170 ≈760 Scanning laser vibrometer (SLDV) Infra-red camera Shaker -6 0 5 -5 0 0 0 1 8 0 -2 0 0 Black cardboard Acoustic black hole termination Impedance head − →x − →x 0 1 5 5 Plateau 18 0 Visco-elastic film (a) − →x 0 side view front
view rearview
double-sided tape: cotton fabric with silicon liner beam white dots visible in Fig. 5 taped holes of the marble plane (b) Mechanical measurement |R| |Y | Selection of the frequency fi Thermal measurement Image processing δTqs(x, t) w(f, x) Analysis (c)
FIG. 1. (a) Sketch of the experimental set-up, with dimensions expressed in mm (ABH begins at x = 0); (b) pictures of the ABH (covered with visco-elastic material), front, side and rear views; the front (measured) side is painted black ; the profile of the ABH is visible on the side view; the rear view shows the ABH with the visco-elastic film; (c) block diagram of the proposed method.
beam is painted black (cf. Fig. 1.(b)) and the experimental set-up is fully cloaked with black cardboards during thermal mea-surements in order to maximise the thermal emissivity and to reduce the noise from the environment in the measured ther-mograms.
A block diagram of the proposed method is presented in Fig. 1.(c). The mechanical data obtained with the impedance
head and SLDV, the admittance Y and the reflection coeffi-cient R, are used to select frequencies for infra-red imaging recordings. The obtained thermograms are then processed to calculate the quasi-static temperature variations δ Tqs(x,t),
which are finally analysed, along with the vibrational dis-placements w(x,t), in order to gain insight into the physical behaviour of the ABH and structural damping.
B. Mechanical characterisation of the ABH
From a mechanical standpoint, two indicators are used to assess the effect of damping in the coated case:
1. the co-localised admittance Y = V /F of the sample beam (where V and F are the velocity and the force at the driving point);
2. the mechanical reflection coefficient R of the ABH ter-mination that can be measured by following the method described in Ref. 7.
Far from the shaker and from the ABH termination, (i.e. in the far-field condition), the spatial distribution of the displace-ment along the vibrating beam can be written as the sum of two counter-propagative waves, whose unknown complex am-plitudes can be determined by means of a least mean square method from the SLDV measurements performed on a grid of points.
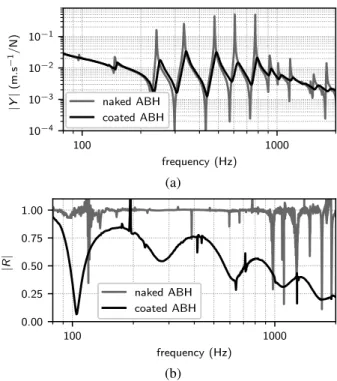
The modulus of the admittance Y shown in Fig. 2.(a) dis-plays a succession of peaks and drops, whose frequency is determined by the beam dimensions, in particular the total length. In the naked case, these peaks/drops are sharp due to the low loss factor of the constitutive material of the beam, and to the total reflection at the extremity (|R| ≈ 1 in the naked case in Fig. 2.(b)). In the coated case, |Y | is significantly smoothed due to the ABH performances. Indeed, the mod-ulus of R (Fig. 2.(b)) decreases when the frequency increases, and displays typical arches for which each drop corresponds to the resonance of a mode localised in the ABH profile8,13.
These trapped modes are independent from the length of the beam. Hence, the frequencies corresponding to the drops of |R|are not directly linked to those of the peaks/drops of |Y|.
In addition to the frequency responses of the structure pre-sented in Fig. 2, measurements have also been performed to characterize the spatial distribution of the vibrational field. Fig. 3.(a) shows a typical map of the out-of-plane forced dis-placement (normalised to its maximum value) in the case of the coated ABH, at 1,000 Hz. The field clearly shows the in-crease along the x-axis of the amplitude of vibration, as well as a reduction of the wavelength, which are both induced by the ABH ending. In the frequency range of interest, it must be noticed that the vibrational field only depends on the position along the x-axis, and not on the y-axis. Fig. 3.(b) represents the flexural field in a frequency vs space plane in which a hor-izontal line corresponds to the longitudinal profile of the field at a given frequency, obtained by averaging the field as mea-sured in Fig. 3.(a) over the width of the beam. Fig. 4 gives examples of such profiles with or without a damping layer, at
100 1000 frequency (Hz) 10−4 10−3 10−2 10−1 |Y | (m .s − 1/ N ) naked ABH coated ABH (a) 100 1000 frequency (Hz) 0.00 0.25 0.50 0.75 1.00 |R | naked ABH coated ABH (b)
FIG. 2. (a) Magnitude of the mobility of the excitation point (x = −500 mm); (b) modulus of the reflection coefficient of the (black) coated and (gray) naked ABH calculated at x = 0. A 50
mm-wide grid of 26 × 6 measurement points located in the region x< −125 mm is used in order to verify the far-field conditions.
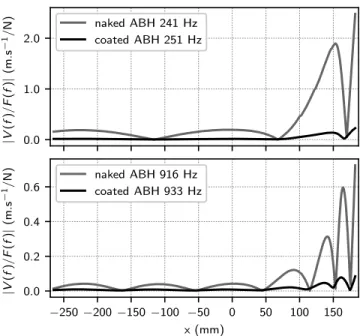
two selected frequencies. It must be noted that the excitation frequency is not set exactly at the same value for the coated or for the naked cases: this is because the frequency is chosen so as to correspond to a local maximum of the admittance, which itself is influenced by the presence of the viscoelastic layer. The results clearly show localised vibrations in the ABH and a huge amplitude reduction in the coated ABH case, compared with the typical amplitudes of the naked ABH case.
III. THERMAL METROLOGY
A. Experimental set-up for IR-thermography
This part is devoted to metrological aspects and to the pro-cessing of raw data applied to the thermal measurements us-ing the red camera. The data obtained with the infra-red camera correspond to the surface temperature of the alu-minum beam, which itself can be decomposed into two com-ponents as:
T(x,t) = T0(x) + δ Tqs(x,t). (2)
In Eq. (2), the temperature T0(x) corresponds to a reference temperature, namely that of the beam at rest. This reference temperature is actually very close to the room temperature T∞,
but it may be slightly influenced by parasitic sources of heat-ing. The quasi-static temperature, δ Tqs(x,t), corresponds to
space-4 x (mm) −200 −100 0 100 200 (a) −200 −100 0 100 x (mm) 250 500 750 1000 1250 1500 1750 2000 fr eq u en cy (H z) −60 −50 −40 −30 −20 −10 dB ref. 1 m.s−1/N (b)
FIG. 3. (a) Snapshot of the measured velocity of the coated ABH at 1,000 Hz; the ABH begins at x = 0 and the amplitude is nor-malised to its maximum value; (b) absolute value of the frequency response functions Y (ω,x) = V (ω,x)/F(ω) where V (ω,x) is the ve-locity spectrum, at point x belonging to the bottom end of the coated ABH, and where F(ω) is the applied force spectrum at the driving point.
and time-dependent component of the temperature distribu-tion induced by the dissipadistribu-tion of mechanical power when flexural waves are generated along the beam. It is worth pointing out that in Eq. (2), we deliberately discarded the fact that there should be an additional term, corresponding to an oscillating component of the temperature variations. The flexural waves in the beam should indeed also lead to some fluctuations of temperature resulting from the thermo-elastic effect caused by a dynamic change in elastic strain. How-ever, this oscillating component of temperature fluctuations, whose time-average over one cycle equals zero, is not consid-ered in this study. Its order of magnitude is indeed assumed to be small against the slow variations δ Tqsof the temperature
caused by damping, and the exposure time used in this study for temperature measurements (about 3 ms) is comparable to the period of one cycle (typically from 1 up to 10 ms). It is worth noting that, in Eq. (2), the temperature is assumed to depend only on the axial component, x: this statement is actu-ally confirmed by the observations in the experiments carried out for the present study.
The camera used is a FLIR X6580sc, with a sensor matrix
0.0 1.0 2.0 |V (f )/ F (f )| (m .s − 1/ N ) naked ABH 241 Hz coated ABH 251 Hz −250 −200 −150 −100 −50 0 50 100 150 x (mm) 0.0 0.2 0.4 0.6 |V (f )/ F (f )| (m .s − 1/ N ) naked ABH 916 Hz coated ABH 933 Hz
FIG. 4. Vibrational profiles of the bottom part of the beam for two modes, 241 Hz and 916 Hz for the naked ABH and 251 Hz and 933 Hz for the coated ABH).
of 512 × 640 pixels. Its thermal sensitivity is about 20 mK, with an absolute and a relative uncertainty equal to ±1◦C and
±1% respectively. In order to minimise the noise potentially visible in the thermograms, the whole set-up is cloaked with black cardboards and the beam is painted black to maximise the thermal emissivity. Note that the infra-red radiation emit-ted by the camera itself is reflecemit-ted on the beam, even if the beam is painted black, and this radiation is clearly visible on the thermograms, except if the camera is voluntarily not placed in front of the beam but slightly aside.
The non-uniformity of the thermal maps is corrected before every measurement phase: the software driving the infra-red camera allows correcting the non-uniformity from images of a scene of uniform temperature (by using a black cardboard placed in front of the objective of the camera for example). An example of a thermogram of the beam, with the correction of the non-uniformity done beforehand, is presented in Fig. 5. As shown in Fig. 1.(b), white dots are painted on the beam, and are also visible in the thermogram in Fig. 5. These dots give reference positions and enable retrieving the system of coordinates used both for SLDV and IR thermometry. On the thermograms presented (Fig. 5 and 7.(a)), the black hole side (x > 0) is on the right.
When observing the evolution of the quasi-static temper-ature profile of the beam at rest, measured at several times (δ Tqs(x,ti)), two types of variations are noticeable: small
vari-ations on each image (around a few mK) and jumps (around 90 mK). After several observations, the former look uniform, whereas the latter display spacial coherence. The small varia-tions are due to the temperature drift of the body of the camera and the jumps are due to the correction of this drift, done au-tomatically by the integrated software. Note that the values of these variations remain in the range of the uncertainty values
− →x 0 −175 −125 21.20 21.25 21.30 21.35 21.40 21.45 21.50 21.55 temperature (°C)
FIG. 5. Example of thermogram of the beam at rest, averaged in time over 30 thermograms (15 sec.), used to measure T0(x).
given by the manufacturer. However, these variations can be corrected by processing the signal. As the objectives of this experiment require to measure variations of around a few tens of mK, signal and image processing is thus used to lessen the uncertainty values and improve the accuracy of the measure-ment.
B. Image processing
As mentioned previously, the thermograms measured present small uniform variations and the software integrated in the camera corrects the drift by taking into account the tem-perature of the body of the camera, which leads to jumps in the measured signals. These jumps are not uniform; yet they seem spatially coherent. As the variable of main interest is the quasi-static one, δ Tqs(x,t), and is about a few tens of mK,
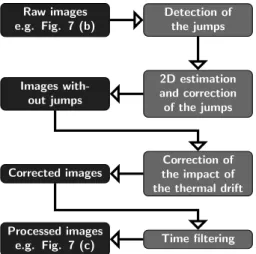
these jumps must be corrected. As the drift correction cannot be switched off, the protocol used consists firstly in suppress-ing manually the automatic correction, which simultaneously removes the jumps, and secondly in correcting manually the temperature drift. The different steps of the processing are summarised in Fig. 6. Raw images e.g. Fig. 7 (b) Detection of the jumps 2D estimation and correction of the jumps Images with-out jumps Correction of the impact of the thermal drift Corrected images
Time filtering Processed images
e.g. Fig. 7 (c)
FIG. 6. Synoptic diagram of the image processing applied; (black) type of images and (grey) image processing stages.
Firstly, the temperature variation, spatially averaged in each raw image, is calculated so as to detect the jumps. For each jump detected in time, the variations of δ Tqs(x,t) between
two thermograms are supposedly very small compared to the jumps. 2D estimations of the variations due to these jumps are then calculated from the difference between the averaging of n thermograms before and after each jump (here n = 3), by using the least mean square method, with a 3-order poly-nome. These 2D estimations are subsequently used to remove the jumps.
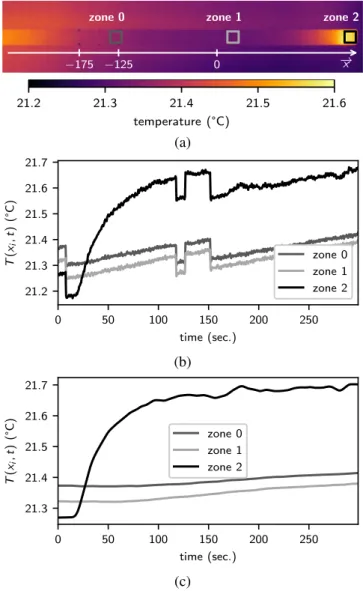
As mentioned previously, the signal drift due to the tem-perature variation of the body of the camera appears, and is thus supposed uniform in all the thermograms. The impact of this thermal drift is finally estimated by using a black card-board set behind the beam, in the background. It corresponds to the average temperature variation of this black area, whose temperature is assumed constant during each acquisition. This value is then subtracted from the thermograms in order to get the corrected images. The final step consists in filtering the signal of each pixel in time, to smooth the results. To illus-trate this protocol, three measured signals of the beam un-dergoing a local increase in temperature are shown in Fig. 7, before and after processing. The frame rate of the camera is set to 2 frames per second (fps). Before the processing stage, noise, jumps and signal drift are visible. After processing, the curves are visibly smoother, the jumps have been removed and the drift is corrected.
IV. THERMO-MECHANICAL CHARACTERISATION OF THE ABH
A. Evidence of the thermal increase due to the added damping layer
This section aims at highlighting local heating due to the added damping layer when the beam is excited in a steady state by a wideband noise over the range [0.2-1] kHz. The frame rate of the infra-red camera is set to 2 fps, and the ex-posure time to 3,000 µs.
The choice of the voltage supplied to the dynamic shaker is a tricky issue in this experiment. Ideally, the same power should be injected for both cases of naked and coated ABH. In practice, this setting is impossible to achieve due to the differences in the order of magnitude of the mechanical ad-mittance of the beam between the two cases, as discussed for Fig. 3.(a). Indeed, applying a power level so that a heating may be measurable in the coated case results in a highly non-linear vibration regime in the naked case. Conversely, apply-ing a power level that guarantees a linear vibration regime in the naked case results in very low power dissipation within the ABH and the resulting local increase in temperature is not possible to measure.
The adopted compromise then consists in adjusting the power level so that its value 2|ℜ{Sf a/ jω}| (Sf a being the
cross-spectrum force-acceleration)31,32 may be of the same
range at resonance peaks in both naked and coated cases (see Fig. 8). Therefore, due to large differences in damping between the two cases, the total injected energy that corre-sponds to the frequency integration of these signals is sig-nificantly different: the values obtained are 21.6 mW and
6
zone 0 zone 1 zone 2
− →x 0 −175 −125 21.2 21.3 21.4 21.5 21.6 temperature (°C) (a) 0 50 100 150 200 250 time (sec.) 21.2 21.3 21.4 21.5 21.6 21.7 T (xi ,t ) (° C ) zone 0 zone 1 zone 2 (b) 0 50 100 150 200 250 time (sec.) 21.3 21.4 21.5 21.6 21.7 T (xi ,t ) (° C ) zone 0 zone 1 zone 2 (c)
FIG. 7. (a) Time averaged thermogram (over 300 sec.) and measure-ment areas: (black) zone 0, (light gray) zone 1, (dark gray) zone 2;
the variations of the average temperature, plotted for the three areas, are estimated (b) from raw images, and (c) from processed images.
245.5 mW in the naked and coated cases, respectively. These values reflect the differences in the level of energy dissipated by the ABH in both cases.
Fig. 9 shows the evolution of the quasi-static temperature δ Tqs(x,t)over a long time after having switched on the
broad-band excitation at t = 20 sec. Each vertical column of this plane is obtained by averaging the instantaneous thermogram over the width of the beam.
In the naked ABH (see Fig. 9.(a)), no significant heating is measured on the vibrated beam compared to its thermal state at rest. However, slight and abrupt temperature variations of a few tens of mK with complex time evolution are observed. These variations are probably due to uncontrolled environ-mental conditions in the set-up, such as slight air streams and room temperature variations or light pollution.
However, for the coated case presented in Fig. 9.(b), a lo-calised heating at the end of the beam, where the vibration
100 1000 frequency (Hz) 10−5 10−4 10−3 2 ℜ { Sfa / jω } (m .s − 1N ) naked ABH coated ABH
FIG. 8. Measurement of the injected power, Π(ω) = 2ℜSf a/ jω, Sf a
beeing the cross-spectrum force - acceleration, for the naked and the coated ABH.
amplitudes and dissipative mechanisms are greater, is clearly measured. After a transient rise of about 30 sec. after switch-ing on the source, the temperature profile stabilises and shows a maximum value of about 500 mK. In these conditions, the ABH is active and generates a local increase of the tempera-ture. These experimental data provide the main original result of this paper.
B. Analysis of the transient evolution of the thermal profile It is also relevant to analyse the variations the temperature field δ Tqs in both space and time domains, in the case of a
harmonic excitation. Such an analysis of the transient estab-lishment of the temperature distribution is provided hereafter. Fig. 10.(a) and Fig. 11.(a) show the evolution of δ Tqs(x,ti),
for ti ranging from 18 sec. (when the shaker is switched on)
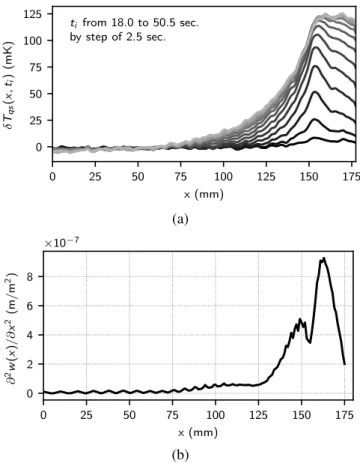
to 50.5 sec. (when a steady state is reached) with time steps of 2.5 sec., for a sinusoidal excitation at 276 Hz and 933 Hz. These two frequencies are close to those of vibrational modes of the beam terminated with a coated ABH (see Fig. 4.(a)). The corresponding reflection coefficients are similar and equal to 0.54 and 0.49, respectively. The frame rate of the infra-red camera is set to 2 fps. Moreover, in order to smooth the ther-mograms, a space Gaussian filter has been applied with the filtfilt algorithm33.
Has the dissipated power is usually related to the strain energy, the second spatial derivative of the deformation, ∂2w(x)/∂ x2, is estimated from data obtained with SLDV as it is proportional to the strain34. The corresponding curves are
displayed in Fig. 10.(b) and Fig. 11.(b) for both frequencies. Two conclusions derive from the analysis of these curves: • for both chosen frequencies, the position where heating
is the greatest does not correspond to the position where the vibrational amplitude is the largest , but where the strain energy is maximum. The geometric discon-tinuity of the junction between the ABH profile and the uniform plateau of residual thickness, located at x=155 mm, seems to be an important source of me-chanical power dissipation, as can be seen from the hot spot clearly visible on the early stage of the transient regime.
0 50 100 150 200 250 time (sec.) −200 −100 0 100 x (m m ) −75 −50 −25 0 25 50 75 δTqs (mK) (a) 0 50 100 150 200 250 time (sec.) −200 −100 0 100 x (m m ) 0 100 200 300 400 500 δTqs (mK) (b)
FIG. 9. Measured δ Tqs(x,t)for the (a) naked and (b) coated ABH,
with injected mechanical power described in Fig. 8.
• the process of heat diffusion through the beam and of heat exchange with the surrounding fluid, result in a steady-state temperature field whose shape and ampli-tude depend on the frequency of excitation.
V. CONCLUSION
This paper concerns the experimental characterisation of damping mechanisms in vibrating structures, and especially in ABH endings. This issue is known to be tricky given the diversity and physical complexity of the dissipation mecha-nisms involved. The control and characterisation of damping is an important topic of research with several important stakes for the industry. In this context, the objective pursued here is to develop an imaging technique providing information on mechanical damping, based on the vibration and thermal maps of a vibrated structure.
The results reported in this paper focus on the thermogram measurement technique and its application to the case of an
0 25 50 75 100 125 150 175 x (mm) 0 200 400 600 δT q s (x ,ti ) (m K ) ti from 18.0 to 50.5 sec. by step of 2.5 sec. (a) 0 25 50 75 100 125 150 175 x (mm) 0 1 2 3 ∂ 2w (x )/ ∂ x 2(m / m 2) ×10−6 (b)
FIG. 10. (a) Measured δ Tqs(x,ti)for tiranging from (black) 18.0 sec.
to (light grey) 50.5 sec. with time steps of 2.5 sec., and (b) estimated
∂2w(x)/∂ x2at 276 Hz.
ABH beam termination. The results are summarized below. • An image processing method based on infra-red
ther-mograms has been developed and enables carrying out the accurate detection of local heating induced by me-chanical dissipation in a thin vibrating structure. The access to these new types of experimental data opens up potentially new approaches for both basic and ap-plied research in the field of vibration.
• The evidence of a local temperature increase of a few hundreds of mK, due to local damping in an ABH beam termination, is provided in the case of vibrations using a broadband noise signal.
• The analysis of the transient states, once the shaker is switched on, shows that the geometric discontinu-ity at the ABH/plateau junction is one of the important sources of heating.
The non-invasive techniques used in this paper provide use-ful information, which might help getting further insights on the complex processes of damping in vibrating structures. In-deed, damping usually occurs at junctions, and thermal imag-ing allows visualisimag-ing this effect, and thus localisimag-ing it. For ex-ample, this method could be applied to glazing with joints on borders or a panel with a partial visco-elastic coating or/and
8 0 25 50 75 100 125 150 175 x (mm) 0 25 50 75 100 125 δT q s (x ,ti ) (m K ) ti from 18.0 to 50.5 sec. by step of 2.5 sec. (a) 0 25 50 75 100 125 150 175 x (mm) 0 2 4 6 8 ∂ 2w (x )/ ∂ x 2(m / m 2) ×10−7 (b)
FIG. 11. (a) Measured δ Tqs(x,ti)for tiranging from (black) 18.0 sec.
to (light grey) 50.5 sec. with time steps of 2.5 sec., and (b) estimated
∂2w(x)/∂ x2at 933 Hz.
installed on dampers. In the ABH case, data extracted from the thermograms and mechanical measurement may provide information to increase understanding on the ABH effect and may allow improving its characterisation. Works are cur-rently in progress to develop a thermo-mechanical model en-abling to reproduce the experimental observations reported in this paper.
SUPPLEMENTARY MATERIALS
Videos made with raw images obtained from the camera and with processed images, corresponding to the data pre-sented in Fig. 7, are available as supplementary materials, to present subjectively the quality of the signal and image pro-cessing applied.
ACKNOWLEDGMENTS
This work is funded by the French Research Agency (ANR) through the FullFields joint lab program (ANR-17- LCV2-0010). This work is also partly linked to the reasearch pro-gramme eTNAA funded by the ANR French agency (ANR-17-CE08-0035) and dedicated to active control of damping in
ABH devices.
Authors are grateful to Julien Nicolas, from ENSIM Engi-neering School, who manufactured the ABH sample beam.
1M. A. Mironovv, “Propagation of a flexural wave in a plate whose thickness decreases smoothly to zero in a finite interval,” Soviet Physics: Acoustics 34, 318–319 (1988).
2V. V. Krylov, “New type of vibration dampers utilising the effect of acoustic ‘black holes’,” Acta Acustica united witth Acoustica 90, 830–837 (2004). 3V. Georgiev, J. Cuenca, F. Gautier, L. Simon, and V. Krylov, “Damping of
structural vibrations in beams and elliptical plates using the acoustic black hole effect,” Journal of Sound and Vibration 330, 2497–2508 (2011). 4V. Denis, A. Pelat, and F. Gautier, “Scattering effects induced by
imper-fections on an acoustic black hole placed at a structural waveguide termi-nation,” Journal of Sound and Vibration 362, 56 – 71 (2016).
5L. Tang, L. Cheng, H. Ji, and J. Qiu, “Characterization of acoustic black hole effect using a one-dimensional fully-coupled and wavelet-decomposed semi-analytical model,” Journal of Sound and Vibration 374, 172 – 184 (2016).
6J. Y. Lee and W. Jeon, “Exact solution of euler-bernoulli equation for acous-tic black holes via generalized hypergeometric differential equation,” Jour-nal of Sound and Vibration 452, 191–204 (2019).
7V. Denis, F. Gautier, A. Pelat, and J. Poittevin, “Measurement and mod-elling of the reflection coefficient of an acoustic black hole termination,” J. of Sound and Vibration 349, 67–79 (2015).
8A. Pelat, V. Denis, and F. Gautier, “Experimental and theoretical study of the reflection coefficient of a abh beam termination,” in INTER-NOISE and NOISE-CON Congress and Conference Proceedings, Vol. 250 (Institute of Noise Control Engineering, 2015) pp. 5001–5009. 9O. Aklouche, A. Wang, A. Pelat, and F. Gautier,
“Dispersion curves for bending waves in a meta-plate made with a periodic lattice of abh like scatterers,” in INTER-NOISE and NOISE-CON Congress and Conference Proceedings, Vol. 255 (Institute of Noise Control Engineering, 2017) pp. 5226–5232. 10O. Aklouche, A. Pelat, S. Maugeais, and F. Gautier, “Scattering of flexural
waves by a pit of quadratic profile inserted in an infinite thin plate,” Journal of Sound and Vibration 375, 38 – 52 (2016).
11P. A. Feurtado and S. C. Conlon, “An experimental investigation of acous-tic black hole dynamics at low, mid, and high frequencies,” 138 (2016), 10.1115/1.4033894.
12L. Ma, S. Zhang, and L. Cheng, “A 2d daubechies wavelet model on the vibration of rectangular plates containing strip indentations with a parabolic thickness profile,” Journal of Sound and Vibration 429, 130 – 146 (2018). 13J. Leng, F. Gautier, A. Pelat, R. Picó, J.-P. Groby, and V. Romero-García,
“Limits of flexural wave absorption by open lossy resonators: reflection and transmission problems,” New Journal of Physics 21, 053003 (2019). 14A. Pelat, F. Gautier, F. Semperlotti, and S. Conlon, “The acoustic black
hole: a review of therory and applications,” submitted to the Journal of Sound and Vibration (2019).
15A. Climente, D. Torrent, and J. Sánchez-Dehesa, “Gradient index lenses for flexural waves based on thickness variations,” Applied Physics Letters 105(2014), 10.1063/1.4893153.
16S. Foucaud, G. Michon, Y. Gourinat, A. Pelat, and F. Gautier, “Artificial cochlea and acoustic black hole travelling waves observation: Model and experimental results,” Journal of Sound and Vibration 333, 3428 – 3439 (2014).
17T. Zhou, L. Tang, H. Ji, J. Qiu, and L. Cheng, “Dynamic and static prop-erties of double-layered compound acoustic black hole structures,” Interna-tional Journal of Applied Mechanics 09, 1750074 (2017).
18T. Zhou and L. Cheng, “A resonant beam damper tailored with acoustic black hole features for broadband vibration reduction,” Journal of Sound and Vibration 430, 174 – 184 (2018).
19W. Huang, H. Zhang, D. J. Inman, J. Qiu, C. E. Cesnik, and H. Ji, “Low reflection effect by 3d printed functionally graded acoustic black holes,” Journal of Sound and Vibration 450, 96 – 108 (2019).
20M. Ouisse, D. Renault, P. Butaud, and E. Sadoulet-Reboul, “Damping con-trol for improvement of acoustic black hole effect,” Journal of Sound and Vibration 454, 63–72 (2019).
stiffness and damping properties of plates by using the local equation of motion,” Journal of Sound and Vibration 333, 2454–2468 (2014). 22M. Mihalec, J. Javh, F. Cianetti, M. Moretti, G. Rossi, J. Slaviˇc, and
M. Boltežarn, “Damping heat coefficient – theoretical and experimental re-search on a vibrating beam,” J. Sound Vib. 400, 13–21 (2017).
23G. Pitarresi and E. A. Patterson, “A review of the general theory of ther-moelastic stress analysis,” The Journal of Strain Analysis for Engineering Design 38, 405–417 (2003).
24G. Pitarresi, L. D’Acquisto, and A. M. Siddiolo, “Thermoelastic stress analysis by means of an infrared scanner and a two-dimensional fast fourier transform-based lock-in technique,” The Journal of Strain Analysis for En-gineering Design 43, 493–506 (2008).
25C. Antolis and N. Rajic, “Optical lock-in thermography for structural health monitoring – a study into infrared detector performance,” Procedia Engi-neering 188, 471–478 (2017).
26F. Li, J. Liu, H. Yang, Y. Lu, and L. Zhang, “Numerical simulation and experimental verification of heat build-up for rubber compounds,” Polymer 101, 199–207 (2016).
27W. Luo, B. Yin, X. Hu, Z. Zhou, Y. Deng, and K. Song, “Modeling of the heat build-up of carbon black filled rubber,” Polymer Testing 69, 116–124
(2018).
28N. Navaranjan and R. Jones, “Lock-in infrared thermography for the eval-uation of the structural performance of corrugated paperboard structures,” Composite Structures 92, 2525–2531 (2010).
29K. Akutagawa, S. Hamatani, and T. Nashi, “The new interpretation for the heat build-up phenomena of rubbery materials during deformation,” Poly-mer 66, 201–209 (2015).
30L. Tang and L. Cheng, “Enhanced acoustic black hole effect in beams with a modified thickness profile and extended platform,” Journal of Sound and Vibration 391, 116–126 (2017).
31F. J. Fahy, “Measurement of acoustic intensity using the cross-spectral den-sity of two microphone signals,” The Journal of the Acoustical Society of America 62, 1057–1059 (1977).
32J. Y. Chung, “Cross-spectral method of measuring acoustic intensity with-out error caused by instrument phase mismatch,” The Journal of the Acous-tical Society of America 64, 1613–1616 (1978).
33A. V. Oppenheim and R. W. Schafer, Discrete-Time Signal Processing (Prentice-Hall, 1989) pp. 311–312.
34Z. Zembaty, P. Bobra, P. Bo´nkowski, S. Kokot, and J. Ku´s, “Strain sensing of beams in flexural vibrations using rotation rate sensors,” Sensors and Actuators A 269, 322–330 (2018).