HAL Id: hal-02485570
https://hal.archives-ouvertes.fr/hal-02485570
Submitted on 25 Mar 2020HAL is a multi-disciplinary open access archive for the deposit and dissemination of sci-entific research documents, whether they are pub-lished or not. The documents may come from teaching and research institutions in France or abroad, or from public or private research centers.
L’archive ouverte pluridisciplinaire HAL, est destinée au dépôt et à la diffusion de documents scientifiques de niveau recherche, publiés ou non, émanant des établissements d’enseignement et de recherche français ou étrangers, des laboratoires publics ou privés.
Distributed under a Creative Commons Attribution - NonCommercial - NoDerivatives| 4.0 International License
Impact of wind direction variability on hazard
assessment in Martinique (Lesser Antilles): The example
of the 13.5 ka cal BP Bellefontaine Plinian eruption of
Mount Pelée volcano
Audrey Michaud-Dubuy, Guillaume Carazzo, Stephen Tait, Guillaume Le Hir,
Frédéric Fluteau, Edouard Kaminski
To cite this version:
Audrey Michaud-Dubuy, Guillaume Carazzo, Stephen Tait, Guillaume Le Hir, Frédéric Fluteau, et al.. Impact of wind direction variability on hazard assessment in Martinique (Lesser Antilles): The example of the 13.5 ka cal BP Bellefontaine Plinian eruption of Mount Pelée volcano. Journal of Volcanology and Geothermal Research, Elsevier, 2019, 381, pp.193-208. �10.1016/j.jvolgeores.2019.06.004�. �hal-02485570�
Impact of wind direction variability on hazard assessment in
Martinique (Lesser Antilles): the example of the 13.5 ka cal BP
Bellefontaine Plinian eruption of Mount Pelée volcano.
Audrey Michaud-Dubuy, Guillaume Carazzo, Stephen Tait, Guillaume Le Hir, Frédéric Fluteau, Edouard Kaminski
Université de Paris, Institut de physique du globe de Paris, CNRS, F-75005 Paris, France
*Corresponding author: Audrey Michaud-Dubuy, michauddubuy@ipgp.fr
Highlights
• We identify a Plinian fall deposit heading south from Mount Pelée volcano
• We estimate eruptive parameters of the Bellefontaine event dated at 13.5 ka cal BP • The southward dispersion axis of this event is not consistent with mean wind profiles • ERA-Interim wind data from 1979 show that northerly winds are possible in Martinique • Updated volcanic hazard maps in Martinique should consider wind direction variability
Keywords
Mount Pelée volcano, Plinian eruption, tephra dispersal, eruptive dynamics, wind variability, hazard assessment
Abstract
The threat posed by powerful Plinian explosive eruptions, which inject large quantities of ash into the atmosphere and produce pyroclastic density currents (PDC) on ground, is mainly controlled by
eruptive parameters and by the direction and strength of the wind field during the eruption. In most studies, mean wind profiles are used to investigate potential tephra deposit dispersion and to assess volcanic risk. Here we present a detailed reconstruction and reinterpretation of a poorly-understood eruption of Mount Pelée volcano (Martinique), and use it to demonstrate that exclusive use of the average trade wind profile can lead to a misrepresentation of the volcanic risk. The great interest of this eruption stems from its unusual southward dispersion, which encompasses areas that are considered to be safe in current hazard maps and that host major infrastructure. Our new field study and radiocarbon dating show that these deposits are not part of the 2010 BP P3 eruptive sequence as previously thought, but define a so far unknown eruptive event dating back to 13,516 cal BP, which we propose to name the Bellefontaine eruption. The Bellefontaine sequence consists of a basal grey lithic-rich layer resulting from an explosive opening phase that destroyed a pre-existing lava dome, immediately followed by a much thicker, slightly reverse-graded white pumice-fall layer. Their dispersal, thickness, and grain-size distribution are used together with physical models of a volcanic plume to reconstruct the time evolution of the eruption. We find that the mass eruption rate reached 5 × 10⁷kg s-1, producing a 20-km-high Plinian plume, and that the minimum volume of pyroclastic
deposits was 0.18 km3DRE. 2D simulations of tephra dispersion in the atmosphere performed with HAZMAP show that, unlike the recent eruptions at Mount Pelée volcano, mean seasonal wind profiles cannot explain the southward dispersal of the Bellefontaine deposits. To understand the origin of this unusual dispersion axis, we retrieve forty years of wind data over Martinique by using global atmospheric reanalyses from 1979 by the European Center for Medium-Range Weather Forecasts ERA Interim (hereafter ERA-Interim) and ERA5 (hereafter ERA5). We find that, contrary to previous assumptions, this eruption did not necessarily occur during extreme weather conditions associated with the passing of a hurricane. Looking in detail into the ERA Interim datasets, we observe that the wind direction variability over the past 40 years is very low during the dry season (from December to May), and much larger during the wet season (from June to November), even in the troposphere (≈0 to 18 km), which can occasionally result in northerly
winds in the mid- to high troposphere over Martinique. As a similar eruption today would spread volcanic material as far as the prefecture of Fort-de-France and its international airport, a zone classified as safe in current hazard maps, this study highlights the importance of including daily variability of winds in hazard assessment models when considering Plinian eruptions.
1. Introduction
The powerful Plinian eruptions produced by volcanoes located on subduction zones can form convecting plumes of a mixture of gas and pyroclasts that ascend to the stratosphere. During this rise, the bulk density of the volcanic column is reduced by the thermal expansion of the cold atmospheric air entrained at the plume margins (Woods, 1988), and can become lower than that of the atmosphere. In that case, the volcanic jet becomes a buoyant plume rising up to its level of neutral buoyancy in the atmosphere, where the volcanic mixture spreads horizontally to form an umbrella cloud. The structure and dispersal direction of the volcanic cloud depends on stratospheric winds and turbulent diffusion (Carey and Sparks, 1986). The link between ash cloud dynamics, and wind speed and direction is key in risk assessment, as sedimentation of pumice lapilli and ash from the volcanic umbrella can cause infrastructure damage, health problems and major air traffic disruption (Wilson et al., 2014).
The main direction of tephra dispersal is of critical importance when considering a small volcanic island such as Martinique. During an eruption, the authorities will need to estimate the possible damage to critical facilities (e.g., hospitals, police force, power lines, water sources…), including the international airport, to ensure efficient crisis management. In most studies about the Lesser Antilles, mean wind profiles are used as inputs into tephra dispersal models (Komorowski et al., 2008; Lindsey and Robertson, 2018), mainly because the trade winds are considered to enforce a largely invariable regime. Here the limits of this approach are tested by studying an eruption with atypical deposition from Mount Pelée volcano in Martinique.
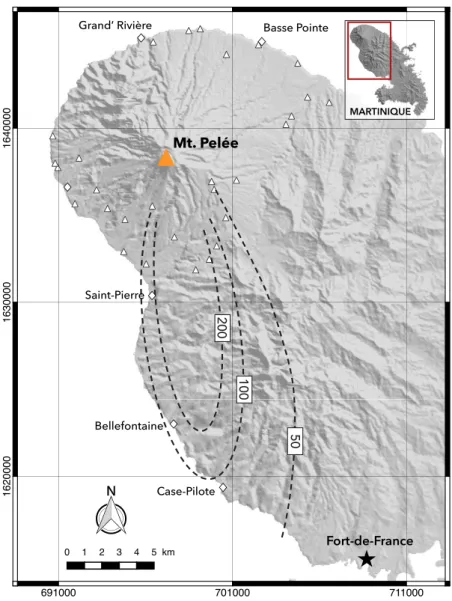
The recent eruptive history of Mount Pelée is rather well-documented by on-land stratigraphic studies and 14C measurements, which identify at least 28 magmatic eruptions that occurred during the last 16,000 years (Westercamp and Traineau, 1983; Boudon et al., 2005), including the 1902-1904 Pelean (Lajoie et al., 1989), the 650 ± 50 BP P1 (Carazzo et al., 2012), the 1670 ± 40 BP P2 (Carazzo et al., 2019), and the 2010 ± 140 BP P3 Plinian events (Traineau et al., 1989). Among these major eruptions, most of the Plinian eruptions underwent a systematic behavior characterized by the formation of a stable plume producing pumice fall deposits, immediately followed by partial and/or total column collapse producing pyroclastic density currents (PDC). P1 and P2, the last two Plinian eruptions that have occurred in Martinique, formed a 19 to 22-km-high (Carazzo et al., 2012) and a 23 to 26-km-high column (Carazzo et al., 2019), respectively, which later collapsed producing dense and dilute PDC on the ground. A major difference between these two eruptions is their dispersal axis. Whereas the P1 eruption spread volcanic tephra over the southwestern flank of the volcano, the P2 eruption covered the northeastern slopes of Mount Pelée volcano with a blanket of pumice. The directions of tephra dispersion of P1 and P2 eruptions are consistent with the current Lesser Antilles trade wind directions during the wet and the dry seasons, respectively (Komorowski et al., 2008;Carazzo et al., 2012; 2019). The P3 eruption spread volcanic ash over a larger area than P1 and P2, suggesting that it was a major event at Mount Pelée volcano, but its eruptive parameters are currently poorly constrained (Westercamp and Traineau, 1983; Traineau et al., 1989). The Plinian fall deposit named P3-2 and associated to the P3 eruptive sequence by Westercamp and Traineau (1983) exhibits a surprising southward and elongated dispersion axis (Figure 1). Such a direction for the dispersion axis, attributed by the authors to a hurricane passing over Martinique, is important to confirm because a similar eruption occurring today would impact the city of Fort-de-France and its international airport. Further fieldwork performed by the same authors led Traineau et al. (1989) to conclude that the P3-2 deposits are older than 2010 BP, and thus that the interpretation of the P3-2 deposits identified by Westercamp and Traineau (1983) must be revised.
In this paper, we revisit the enigmatic P3-2 layer based on a new extensive study of this Plinian fall deposit performed in 2017 and 2019 in Martinique, and an associated detailed reconstruction of the eruption dynamics based on physical models of a volcanic plume. Our new carbon-dating measurements reveal that the event, dated at 13,516 cal BP, is actually considerably older than previously thought. Because it does not belong to the P3 sequence, and because its age does not correspond to any known eruption, we propose to rename the eruptive event as the "Bellefontaine eruption". We fully characterize the key eruptive parameters of the event (total volume, maximum column height, mass discharge rate, eruption duration and covered areas) and determine the likely wind conditions that prevailed during the eruption using the global atmospheric reanalyses ERA-Interim (Dee et al., 2011) and ERA5 (Hersbach et al., 2019), and the HAZMAP tephra dispersion software (Macedonio et al., 2005). Forward modeling reveals that the southward and elongated dispersion axis of the deposits of the Bellefontaine eruption results from northerlies blowing within the upper troposphere, between 100 and 400 hPa (≈16 to 7 km a.s.l), over Martinique. We find that upper tropospheric northerlies, while rather infrequent, occur regularly from September to May, and hence cannot be neglected when establishing eruptive scenarios. This finding demonstrates that volcanic risk assessment should be improved by using high temporal resolution atmospheric wind profile in tephra dispersion models.
2. Field study
2.1. Stratigraphy of the Bellefontaine deposits
The Bellefontaine deposits are easily recognizable by the presence of a strong stratigraphic marker: a yellowish very well-sorted fine ash layer, referred to by Roobol and Smith (1976) and
Traineau et al. (1989) as an “ash hurricane deposit”, underlying the Bellefontaine sequence and separated from it by a dark brown soil. The nature and origin of this deposit that belongs to another
older eruption will be the object of a separate study. At every location where Bellefontaine deposits were identified, we measured the thickness of each layer of the sequence, and the major axes of the five largest lithic fragments found in the deposits. These measurements are made in order to construct isopach and isopleth maps, which constrain the volume of the deposits, the average column heights and exit velocities. Based on diagnostic sedimentary, stratigraphic and physical features of its deposits, we divide the Bellefontaine eruption into two main phases, called Unit A and Unit B.
2.1.1. Unit A
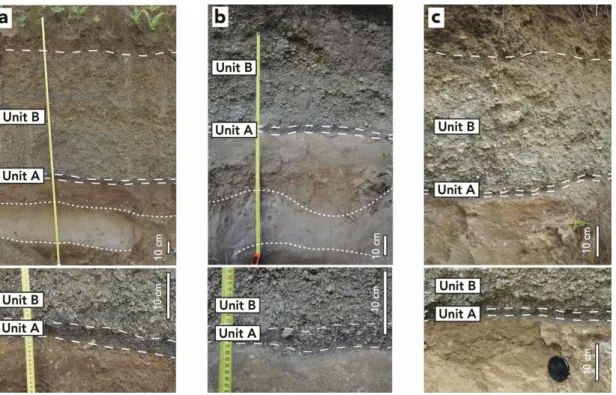
The opening phase of the eruption spread a thin (1-8 cm) dark grey lithic-rich pumice fall layer over ≈130 km2 to the south of the vent. This pumice fall layer, referred as Unit A, is unstratified, unconsolidated and contains ≈30 wt% of juvenile lithic fragments. The contact with the overlying layer is always sharp, without erosion or weathering of the top of the unit, which shows that Unit A and the overlying unit are part of the same event (Figure2).
Unit A’s thickness regularly decreases with distance from the source to the south, which thus corresponds to the downwind direction. The deposit can be found up to 14 km to the south but is missing on the west and east flanks of the volcano. The relatively widespread nature of this deposit, its uniformly decreasing thickness with distance from the source, its framework (clast-supported), and its grain type characteristics (pumice and juvenile lithic fragments) show that Unit A is a fall deposit resulting from a violent explosion associated with a vent-opening phase producing a short-duration, lithic-rich, and small plume, consistent with the low thickness of this unit.
The main layer of the Bellefontaine sequence overlies Unit A and is referred as Unit B. It is a blanket of clast-supported, coarse white pumice with a grey sandy matrix (Figure 2) bearing a few grey pumices. Unit B contains juvenile and accidental lithic fragments in a total amount of ≈7 wt% at the base. At most sites, both pumice and maximum lithic size increase slightly in the uppermost part of the unit.
In the downwind direction (to the south), Unit B has a maximum thickness of 180 cm at 6.5 km from the crater, and steadily thins to 30 cm within 16 km of the vent. In the crosswind direction (East-West), Unit B is 180 cm thick in the most proximal sections (within 6.5 km from the vent), and thins to 45 cm within 8.4 km of the crater. Based on its characteristics, we identify Unit B as the main fall deposit of the eruption.
2.2. Dating and spatial distribution of the Bellefontaine deposits
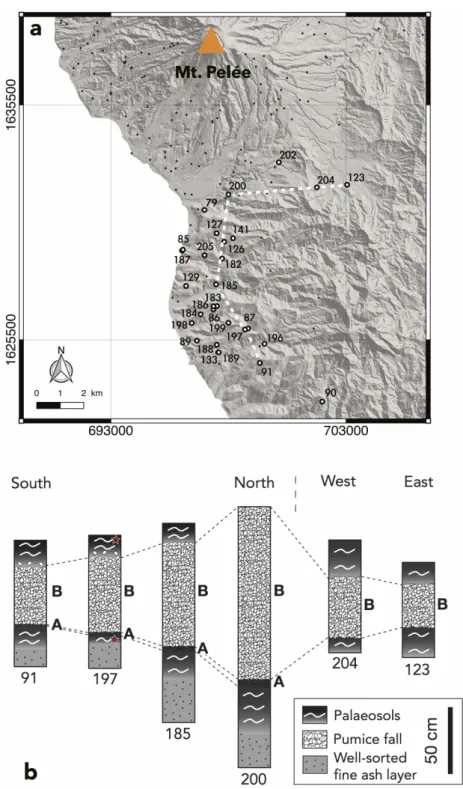
We identified the Bellefontaine eruption deposits at 29 locations over 217 outcrops studied in northern Martinique (Figure 3a). Figure 3b shows a stratigraphic correlation of Bellefontaine outcrops along two different dispersal axes (North-South and West-East, see Figure 3a for localization). The complete sequence can be found up to 13.9 km from the crater (sites 200, 185, 197, and 91 in Figure 3b). New carbon-dating measurements on two palaeosoils sampled at site 197 (red stars in Figure 3b), calibrated using the free online software OxCal (Oxcal 4.3, Bronk Ramsey, 2009) with the atmospheric IntCal13 calibration curve recommended for the Northern Hemisphere (Reimer, 2013), provide an age of 13,516±42 cal BP for the Bellefontaine eruption.
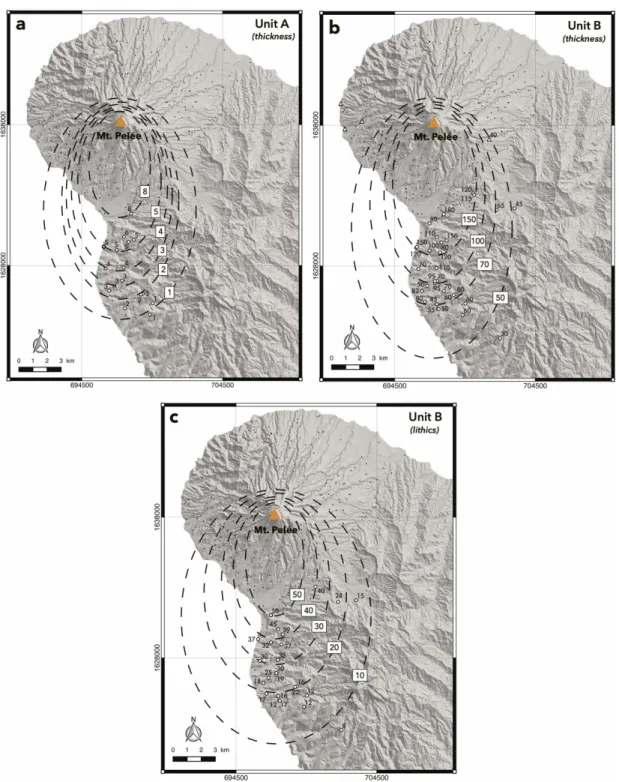
Thickness measurements at each location are reported in isopach maps for the two phases of the Bellefontaine eruption (Figure 4a and b) later used to calculate the volume of deposits (see Section 3.1). Unit A deposits are widespread on the south flank of the volcano, and vary between 8 cm at 6.5 km from the crater to 1 cm further south (Figure 4a). Unit B deposits are much thicker (Figure 4b), which allows a better-constrained volume. We thus use the crosswind distance found
for Unit B as a maximum extent for the isopachs of both units. Because Unit A is not very thick, the error on the contribution of this phase to the total volume estimation can be expected to be low. The thicknesses of both units show ellipsoidal contour patterns indicating fallout dispersion towards the south (Figure 4a and b). The direction of dispersal is in good agreement with the results of
Westercamp and Traineau (1983), cf Figure 1.
The lack of Bellefontaine deposits between the vent and our most northern location (202) is most likely due to a major flank collapse that occurred at ≈9 ka and removed most of the old volcanic material into the sea as a debris avalanche (Le Friant et al., 2003). Neither Roobol and Smith (1976), nor Westercamp and Traineau (1983) report outcrops of these deposits in this area where voluminous PDC deposits of recent eruptions (P3, P2, P1, 1902, 1929) filled up the large depression created by the flank collapse. In order to obtain some field data in this key area, we studied the stratigraphic sections given by Smith and Roobol (1990) who performed 30 deep core drillings around Mt Pelée volcano (Figure 1). We have identified Bellefontaine eruption deposits at two boreholes located to the south and to the east of the volcano with thicknesses consistent with our own measurements in these areas (Figure 4b). Bellefontaine pumice fallout deposits might also be present in three additional boreholes to the west of the volcano, where several pumice fallout deposits older than 2,447 BP but younger than 36,095 BP are present. The lack of precise dating (or presence of a stratigraphic marker) prevents us from positively identifying the Bellefontaine eruption deposits in these three boreholes, but their potential thicknesses are always comprised between 10 and 40 cm.
We measured the major axis of the five largest lithic fragments at each outcrop to build an isopleth map for the Bellefontaine eruption later used to estimate the maximum column height and minimum exit velocity (see Section 3.2). Because of the Unit A deposit’s thinness, it was too difficult to sample lithics belonging to this unit, so we constructed only a maximum lithic isopleth map for Unit B (Figure 4c). The isopleth map of the base of Unit B is well-constrained thanks to the
good preservation of the deposit. We note that the southern direction of the dispersal axis is consistent with that inferred from the isopach map.
2.3. Grain-size analyses
The total grain-size distribution (TGSD) is an essential input for models of tephra transport and dispersion in the rising volcanic plume (Michaud-Dubuy et al., 2018) and the spreading umbrella cloud (Macedonio et al., 2005), as it gives the mass percentage of the different particle classes at the source. The TGSD of a given unit is calculated from the grain-size distribution of each individual sample collected in the field for this unit. Sixteen samples from selected locations of Unit A and Unit B deposits were sampled and analyzed in order to determine the grain-size distribution of single sub-layers (Supplementary material Table S1) using the method described in Appendix A. Unit A is fine-grained and poorly sorted with a relatively broad unimodal distribution. At the different sites, the median diameter (Md ranging from -1.45φ to -0.10φ) and sorting (σ ranging from 1.17 to 1.56) have the typical values of fall deposits, but the amount of ash particles (< 2 mm) reaches relatively high values (up to 94 wt%). Unit B shows typical fallout characteristics with median diameter ranging from -2.93φ to -0.24φ and sorting ranging from 1.62 to 2.10. The grain-size distribution of individual samples is generally bimodal and shows variations in minimum, maximum, and modal grain-size depending on distance from the vent. The top of Unit B is always slightly coarser grained than its base, and the amount of ash particles (< 2 mm) increases regularly from proximal to distal locations (i.e., from 31 to 73 wt%).
We calculated the total grain-size distribution of both units using the method of Kaminski and Jaupart (1998) (see Appendix A for calculation details). The ash fraction (< 2 mm) reaches 78 wt% for Unit A and 61 wt% for Unit B. From these results, we infer that the power law exponent D that fully characterizes the TGSD decreases from D = 3.6 ± 0.1 for Unit A (i.e., the population of fragments is dominated by fine ash particles) to D = 3.0 ± 0.1 for Unit B (i.e., the population of
fragments is evenly balanced between coarse and fine ash particles), cf Supplementary material Figure S1. These values are fully consistent with measurements made for various pumice fallout deposits (Kaminski et Jaupart, 1998), in particular those emplaced during small (i.e., ≈20 km-high) Plinian eruptions (Costa et al., 2016b). The total grain-size distribution of Unit A is unimodal and centered around 0 φ (Supplementary material Figure S1a). Unit B is bimodal with peaks at -2.5φ and 1 φ (Supplementary material Figure S1b). The median diameter is -0.44 φ for Unit A and -0.91 φ for Unit B, and the sorting is 1.36 for Unit A and 1.94 for Unit B.
3. Eruptive dynamics
3.1. Erupted volumes
In Martinique, as in other tropical islands of small dimensions and subject to intense weathering, only proximal (and incompletely preserved) deposits are available, much being lost at sea. The volume calculations are thus bound to provide minimum estimates only.
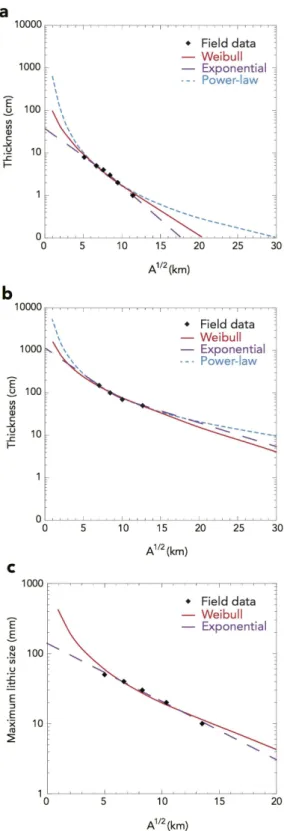
Figure 5a and b gives the thinning trend of Units A and B deposits based on proximal isopach contours (Figure 4a and b). Integration of the two-segment exponential fit (Pyle, 1989), the power-law fit (Bonadonna and Houghton, 2005), and the Weibull fit (Bonadonna and Costa, 2012) computed using the AshCalc software (Daggit et al., 2014) all yield a volume of 0.41 km3. We thus retain a minimal volume of 0.41 km3 for the Unit B fallout. The corresponding DRE volume is 0.175 km3 based on deposit and magma densities of 1070 kg m-3 and 2500 kg m-3, respectively
(Traineau et al., 1989). The same methods used for Unit A yield a volume of 0.01 km3, 0.02 km3, and 0.01 km3 for the exponential fit, the power-law fit, and the Weibull fit, respectively. We thus retain a minimal volume of 0.01 – 0.02 km3 for Unit A, corresponding to a DRE volume of 0.004 – 0.009 km3.
The final estimate of the total volume of the Bellefontaine eruption (Unit A + Unit B) is thus 0.180 – 0.184 km3 DRE, and the total mass of tephra emitted is estimated to be 4.5 – 4.6 x 10¹¹ kg, which corresponds to a magnitude 4.6 (Pyle, 2000) and a VEI 4 event (Newhall and Self, 1982).
3.2. Column height and exit velocity (Unit B)
We use the model of Carey and Sparks (1986) adapted to tropical atmospheric conditions in Central America (Carey and Sigurdsson, 1986) to infer the maximum height reached by the Bellefontaine eruptive column. This model uses three isopleths (8, 16 and 32 mm) and their crosswind ranges to yield a maximum height and associated error bars (see Figure 17 in Carey and Sigurdsson, 1986). Within this framework, our isopleth map (Figure 4c) yields a maximum height of 20.1 ± 0.4 km for the plume that produced the base of Unit B. This method is independent of the wind speed as it uses crosswind ranges to estimate the maximum height. Figure 5c gives the decreasing trend of maximum lithic size as a function of the square root of isopleth contours for fragments collected at the base of Unit B. Following the approach of Bonadonna and Costa (2013), a Weibull fit gives a maximum height of 19.7 ± 0.1 km for the volcanic plume at the beginning of the Unit B, which is equivalent to the estimation made using the method of Carey and Sigurdsson (1986). We thus retain an average value of 20 ± 0.3 km for the maximum height reached by the volcanic plume that produced Unit B.
We also use data of Figure 5c to estimate the minimum exit velocity of the volcanic plume at the vent. Extrapolating the exponential curve in Figure 5c down to A1/2 = 0, we can calculate a maximum lithic size at the vent that, using Equation (1) in Bonadonna et al. (1998), gives a minimum velocity required to carry up this fragment up in the vertical plume of 232 ± 10 m s-1. Using the same method on a decreasing trend of the maximum lithic size as a function of half the crosswind range, we infer a minimum exit velocity of 214 ± 10 m s-1. We thus retain an average
3.3. Mass discharge rate and duration of the eruption
We calculate the mass discharge rate (MDR) feeding the plume produced by Bellefontaine eruption based on the maximum height and using empirical relationships from Carazzo et al. (2014)
and Woodhouse et al. (2016), which explicitly include the effect of wind (see Table 2 of Costa et al., 2016a for calculation details). A first estimate is given by considering a linear wind profile increasing from 0 m s-1 at the ground to 20-30 m s-1 at the tropopause. Within this framework, a maximum column height of 20 km, and tropical atmospheric conditions, yield a maximum MDR of (2 – 4.8) × 107kg s-1 for the Carazzo et al. (2014) relationship and a maximum MDR of 5 × 10⁷kg
s-1 for the Woodhouse et al. (2016) one. A third estimate can be obtained by considering a more realistic and complex wind profile as in Girault et al. (2016) who calculated the maximum height reached by a volcanic column as a function of the total grain-size distribution at the vent. Taking their complex wind profile, which is closer to the average wind profiles in the Lesser Antilles as it shows a wind shear in speed and a reversal in direction (Dunion, 2011), we infer a maximum MDR of 6 x 10⁷kg s-1.
Based on these three estimates, we retain a peak MDR for the beginning of Unit B of (5 ± 1) × 107kg s-1, a value corresponding to an eruption intensity of 10.7 (Pyle, 2000). Combined with the total mass of fallout deposits (Section 3.1), this MDR provides a minimum duration of about 2.5 ± 0.5 hours for the Bellefontaine eruption.
4. Dispersal modeling of the Bellefontaine eruption products
The Bellefontaine event is characterized by the striking southward distribution of the isopachs and isopleths (Figure 4). This direction is surprising because it is not consistent with the mean directions of easterly (up to ≈6 km high) and westerly (between 7 and the tropopause) winds (Dunion, 2011), although these directions explain well the dispersion of the recent P1 and P2
eruptions deposits. Previous studies suggested that this could be related to very specific wind conditions during the Bellefontaine eruption, perhaps due to a hurricane passing over or close to Martinique (Roobol and Smith, 1976; Westercamp and Traineau, 1983; Traineau et al., 1989). Here we test this possibility by performing 2D simulations of volcanic tephra dispersal, using the HAZMAP tephra dispersion model (Macedonio et al., 2005;version 2.4.2 released in 2014).
HAZMAP is a semi-analytical model that solves the equations of dispersion, transport and sedimentation of fine particles in the umbrella cloud. This model is commonly used for volcanic hazard assessment to predict Plinian deposit characteristics as a function of eruptive source parameters and wind datasets (e.g., Macedonio et al., 2008; 2016; Costa et al, 2009; Bonasia et al., 2011; 2012). HAZMAP introduces a horizontal atmospheric diffusion coefficient that we set at 3000 m2 s-1, a value consistent with the empirical ones used in the literature (Macedonio et al., 1988; Pfeiffer et al., 2005). The simplification of the eruptive column in the model requires two additional empirical parameters, the Suzuki parameters A and λ, that describe geometrically the vertical mass distribution within the eruption column and define the shape of the column (see Figure 1 in Pfeiffer et al., 2005 and Macedonio et al., 1988 or Suzuki et al., 1983 for calculation details). Here we use A = 4 and λ = 1, commonly chosen values in the literature (Pfeiffer et al., 2005; Costa et al., 2009; Macedonio et al., 2016). We finally consider a deposit density of 1070 kg m-3 based on previous estimates for Mount Pelée deposits(Traineau et al., 1989). In all simulations, the total erupted mass for Unit B is taken as 4.6 x 10¹¹ kg, the maximum column height is set at 20
km (see Table 1), and we use the total grain–size distribution reconstructed in Supplementary materialFigure S1b.
HAZMAP being used in its “deposit mode”, the computation of the mass distribution requires a given single wind profile including wind velocity components (u, v) as a function of altitude. In this study, we mainly use wind velocity profiles based on the European Centre for Medium-Range Weather Forecasts ERA-Interim reanalysis (ERA-Interim) for the years 1979-2017 (Dee et al. 2011). We further use ERA5 (Hersbach et al., 2019) for hurricane simulations for which
higher temporal and horizontal resolutions are necessary to capture the detailed time evolution of these non-linear and quickly evolving events. Note that the atmospheric reanalysis of ERA-Interim is now offline and no longer updated.
The initial content of ERA-Interim files consists of six-hourly global fields of zonal and
meridional winds at a horizontal resolution of 0.75° × 0.75° (≈79 km) and vertically distributed on 37 pressure levels from 110 m (1000 hPa) to ≈48 km (1 hPa). These wind fields have been interpolated to match HAZMAP format by converting each of the 37 pressure levels into an altitude level using the altitude model in Supplementary material Figure S2. We calculate the wind components over Martinique at each time step and each pressure level in an area ranging from 14.4°N to 14.8°N and from 60.8°W to 61.2°W. Our final dataset, used is Sections 4.1 and 4.2, is composed of 56,984 vertical wind profiles from January 1979 to December 2017.
The ERA5 dataset (Hersbach et al., 2019) released in early 2019 uses the same 37 pressure levels as ERA-Interim but has higher horizontal (0.25° × 0.25°, ≈31 km) and temporal (hourly analysis fields) resolutions, the latter of which is smaller than the duration of the Bellefontaine eruption (i.e., 2h30). Hurricane simulations using ERA5 are reported in Section 4.3.
4.1. Modeling tephra dispersion in Martinique using mean seasonal wind profiles
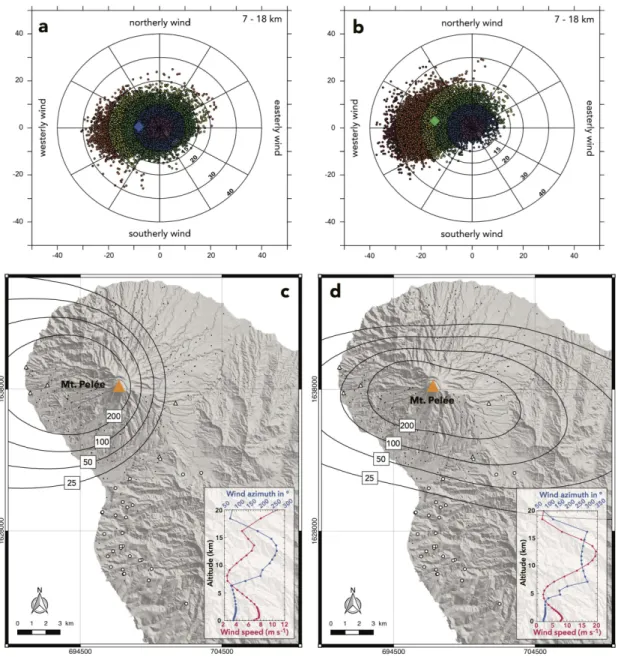
We first use the eruptive source parameters inferred from our field study, and the dominant seasonal wind profiles in the Lesser Antilles to analyze their consequences for the fallout isopach maps. Figure 6a and c (inset) presents the wind profile, averaged over the wet season (June to November), while Figure 6b and d (inset) corresponds to the dry season (December to May). The averaged wind profile for the wet season (June to November) is characterized by easterlies from the surface to 350 hPa (≈7 km) with a highest speed of 7.8 m s-1 at 850 hPa (≈1 km), and westerlies from 300hPa (≈8.8 km) to 125 hPa (≈15.3 km) with wind speed not exceeding 7 m s-1 at 150 hPa (≈13 km). This wind profile for the wet season compares remarkably well with the one determined
by Dunion (2011, Figure 8e and f) using 8 years of rawinsonde observations from four Caribbean stations. At an elevation of 20 km, where most of tephra are injected, the mean wind speed does not exceed 12 m s-1. During the dry season (December to May), we observe two noticeable differences compared with the wet season: the change in wind direction within the troposphere occurs at a lower elevation (550 hPa or ≈4.5 km) in the dry season, and westerlies within the upper troposphere becomes much faster with 20 m s-1 at 175 hPa (≈12 km).
The main dispersal axes obtained with HAZMAP using mean wind profiles of the wet (Figure 6c) and dry (Figure 6d) seasons are clearly inconsistent with the dispersion axis inferred for the Bellefontaine eruption (Figure 4b). For the wet season, the direction of the dispersal axis (Figure 6c) is mainly westward which corresponds to the direction of the most rapid easterlies found within the lower stratosphere and within the troposphere below an elevation of 9 km. During the dry season, the model predicts fallout deposits west and east of Mount Pelée volcano (Figure 6d). The amount of deposits is larger to the east than to the west, highlighting the effect of strong westerlies within the upper troposphere. We also note that the direction of the dispersal axis during the wet season (Figure 6c) is consistent with the isopachs determined in the field for the P1 (Figure 5 in
Carazzo et al., 2012).
4.2 Northerly winds in Martinique (1979-2017)
Averaged wind profiles, such as those used in Section 4.1, represent the typical value for a dataset, i.e. the most probable case. Unfortunately, a “statistical” forecasting based solely on average values hides by definition the variability observed at shorter timescales (months, days, or hours). In order to interpret the unusual southward direction of tephra dispersion during the Bellefontaine eruption, we analyzed the high frequency (i.e., six-hourly) wind dataset over Martinique from ERA-Interim. Among the 56,984 vertical wind profiles available (1979-2017), we observed a relatively weak variability of wind in the lower troposphere, which is strongly
dominated by easterlies throughout the year. The upper troposphere between 400 hPa (≈7 km high) and the tropopause (≈18 km high) are, however, characterized by a notable variability of both wind speed and direction (Figure 6a and b), which can affect the direction of tephra dispersion. Consequently, we sampled a few cases where upper tropospheric mean winds blow from N310 to N30, a configuration that was likely to counterbalance the effect of lower tropospheric easterlies and provide isopach maps consistent with the Bellefontaine deposits. Cases with upper tropospheric mean winds from N30 to N50 were discarded since their trend would tend to align with lower tropospheric easterlies and spread tephra to the southwest at sea. Among 54 of such wind profiles (see Supplementary material Table S2), used as input in HAZMAP together with the same volcanic input parameters as in Section 4.1, 45 produce isopach maps similar to that inferred for Bellefontaine eruption (Figure 4b) (cases marked “O” in the Supplementary material Table S2), including those shown in Figure 7a, b, and c. Hence this preliminary criterion accounts for the location of the Bellefontaine deposits in the field in a very large majority of cases (83%), and highlights the importance of the wind direction heterogeneity when considered at a finer time-scale (few hours maximum).
To enhance the robustness of our selection, we further looked for common features shared by these 45 successful simulations, and found that a specific combination of factors - made explicit below as four criteria - leads to a successful reproduction of the Bellefontaine southward ash dispersion. First, in the high tropospheric layers (from 7 to 18 km of altitude), the wind azimuth has to be limited to a narrow band of directions: from 310°N to 350°N (criterion C1). Second, these upper tropospheric winds also have to be dominant with a speed > 7 m s-1 (C2). Third, wind speed ratio between the high and mid- troposphere (from 2 to 7 km of altitude) must be larger than 2 (i.e., high/mid > 2, C3). Finally, lower tropospheric wind speeds (below 2 km of altitude) have to be low enough (< 4 m s-1) to avoid tephra dispersion in multiple directions (C4). We note that no specific condition for the lowest stratospheric layers (from 18 to 20 km of altitude) is required to reproduce
the Bellefontaine eruption dispersion axis, because the winds at those levels are generally weaker than in the high troposphere.
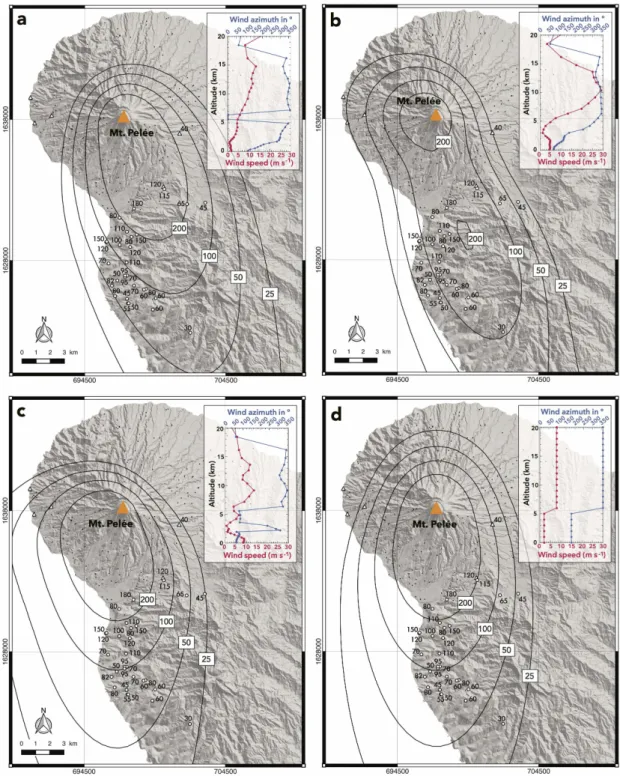
Figure 7a shows that for a simulation using a wind profile fulfilling all the above criteria, we obtain a dispersal axis oriented to the SSE, thus covering the entire area where Bellefontaine deposits were found. When all the criteria but C4 are satisfied, the simulated dispersal axis remains similar (SSE and S, respectively, in Figure 7b and c). The “bulge” to the west in Figure 7c however shows the impact of strong easterly winds in the low troposphere, which can reach a maximum speed of 9 m s-1 in the first km of altitude. One can also note a secondary maximum in the simulated isopach map shown in Figure 7b, which is not present in any of the other results of this study. Considering the proximity to the vent and the simple modeling approach taken, this feature is probably not caused by volcanic plume effects (Manzella et al., 2015) or topographic effects (Watt et al., 2015). It could rather be due, as suggested by Poulidis et al. (2018), to the low wind speed layer associated to wind shear present at ≈4 km of altitude (inset in Figure 7b), which traps ash and thus can act as an elevated secondary source.
Four of the 9 unsuccessful cases (marked “x” in the Supplementary material Table S2) are presented in Supplementary material Figure S3. We show that when only one or two criteria are fulfilled, the tephra dispersion axis is always oriented to the southwest. In case of stronger winds in low to mid-troposphere (i.e., only C1 and C2 are satisfied) mostly blowing from the southeast to east, the tephra dispersion axis is oriented to the southwest, with a “bulge” to the northwest (Supplementary material Figure S3a). If stronger easterly winds in mid-troposphere are combined with weaker winds in high troposphere (i.e., only C1 and C4 are fulfilled), the isopachs are more circular with a dispersal axis oriented to the southwest (Supplementary material Figure S3b). If only C2 is satisfied, the isopachs are strongly stretched to the southwest (Supplementary material Figure S3c). Finally, if C2 and C3 are fulfilled, a similar result is found, but with a “bulge” to the northwest due to south-easterlies in the low troposphere (Supplementary material Figure S3d).
Figure 7a, b, and c thus shows that the combination of all the criteria given above leads to model predictions consistent with the main direction of tephra dispersion observed for the Bellefontaine eruption. However, the thicknesses and global shape of isopachs are not completely equivalent to those in Figure 4b. Based on these results, we further optimized the wind conditions in order to better reproduce the isopach map inferred from the field data. We determined the wind profile yielding the best agreement between simulated isopachs and those measured in the field (Figures 7d and 4b), in both downwind and crosswind directions. This idealized wind profile, fulfilling all the criteria, consists of southerlies blowing at 2 m s-1 up to an altitude of 5 km, and northerlies blowing at speed of 8 m s-1 above an altitude of 5 km up to the tropopause (inset in
Figure 7d). Such conditions prevent the formation of elongated isopachs (Figure 7a and b) and the shift of volcanic deposit pattern towards the sea (Figure 7c).
4.3 Can hurricanes explain the Bellefontaine pattern of deposition?
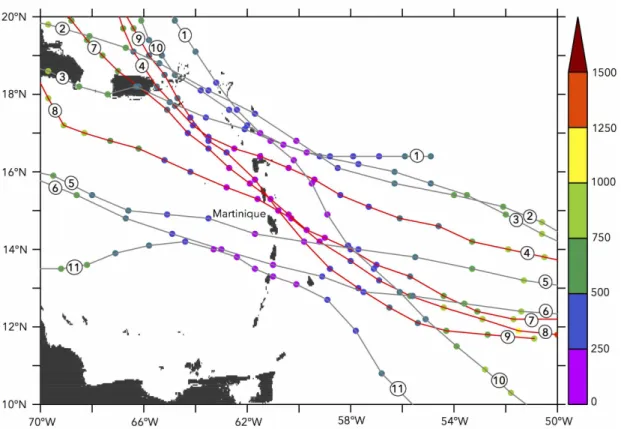
We now test the hypothesis originally proposed by Westercamp and Traineau (1983) that strong hurricane winds blowing over Martinique during the eruption could explain the southward dispersion of the Bellefontaine deposits. As a hurricane is a synoptic scale weather system (i.e., corresponding to a large horizontal length scale of about 1000 kilometers), it can affect the meteorological state (and thus wind speed and direction) up to 250 kilometers from the eye. Using the Atlantic hurricane database HURDAT2 maintained by the National Oceanic and Atmospheric Administration (NOAA) National Hurricane Center (Landsea and Franklin, 2013), we identified 11 hurricanes that passed within less than 250 kilometers from Mount Pelée in the past 40 years (Figure 8). In the northern hemisphere, northerly winds can only be observed to the west of the hurricane eye. We thus focused only on the 8 hurricanes that passed to the east and then to the north of Martinique (labeled 1, 2, 3, 4, 7, 8, 9, and 10 in Figure 8). We retrieved the wind profiles corresponding to these hurricanes from the atmospheric reanalysis ERA5, and found that only 5 of
them produced northerly winds, and did so during a short period of time (≈2h): hurricanes David in 1979, Hugo in 1989, Marilyn in 1995, Georges in 1998, and Maria in 2017. These 5 events all belong to the cluster 3 defined by Kossin et al. (2010), in which hurricanes originate from the eastern part of the central Atlantic Ocean (defined as Cape Verde hurricanes). Because of its high temporal and spatial resolution, hurricane tracks and wind speed profiles are better captured by ERA5 than by ERA-Interim dataset. Using this approach implies to neglect gusts associated with hurricanes (which can reach speeds up to 80 m s-1; Murakami, 2014). This type of event is, however, generally too brief (about one minute long) to significantly influence tephra dispersion.
Using the HAZMAP model, we then performed 2 simulations for each hurricane, each considering two different (and consecutive in time) wind profiles from ERA5 dataset (SupplementarymaterialFigure S4). These wind profiles differ from those described in Section 4.2, and illustrate the changes of air mass circulation as the hurricane is passing by. In particular, hurricane Maria exhibits a decreasing speed with height, a characteristic generally observed during a hurricane (Franklin et al., 2000). Comparing these wind profiles with our criteria defined in the previous section, reveals that C1, C3, and C4 are not fulfilled but the wind speed is > 7 m s-1 in the
high troposphere (C2). Wind directions are rather homogeneous along the entire tropospheric column with an azimuth between N315 and N35, with strongest winds up to 22 m s-1 in the low to mid-troposphere. These conditions are likely to promote a southward dispersion of the volcanic products. As each wind profile presents the state of the atmosphere for one hour (temporal resolution of ERA5) and as the Bellefontaine eruption lasted for approximately 2 hours, each simulation was made using as HAZMAP input half of the total erupted volume of the Bellefontaine eruption (i.e, 2.3 x 10¹¹ kg). The lack of pronounced grading in the deposits (the grain sizes are broadly homogeneous throughout the deposit thickness) is consistent with the hypothesis of a stable mass discharge rate during the entire eruption, which makes this approximation valid. Other volcanic inputs parameters are the same as described in Section 4.
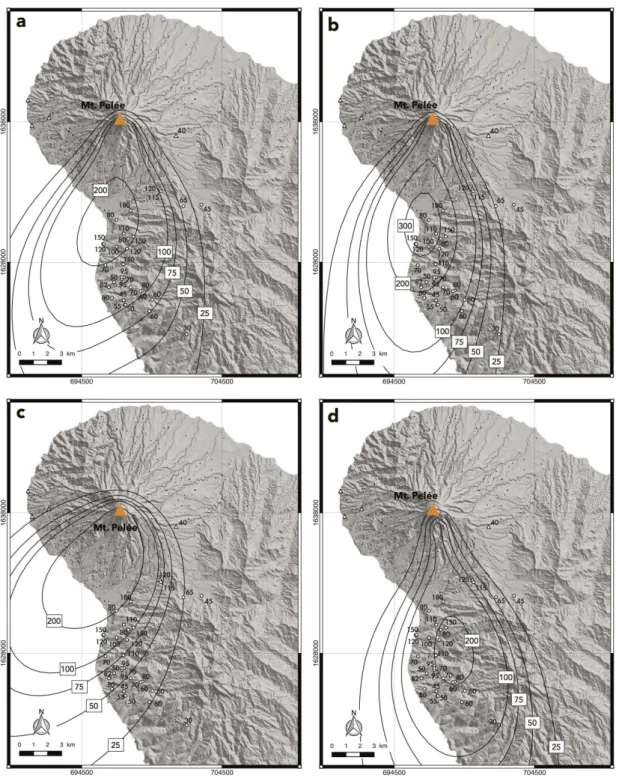
Figure 9 shows the isopach map obtained for each hurricane by adding the two simulations consecutive in time. The model predicts a southward dispersal axis for hurricanes David (Figure 9a), Hugo (Figure 9b), and Maria (Figure 9d), while the simulations for hurricane Marilyn (Figure 9c) result in a main dispersal axis oriented to the southwest. This difference can be explained by the N13-N23 oriented low tropospheric winds (< 2 km) of hurricane Marilyn (at 4 pm UTC,
Supplementary material Figure S4e). A similar orientation (N13-N22) can be observed for hurricane David (12 pm UTC, Supplementary material Figure S4a) but the prevailing orientation arising from these low tropospheric winds was counterbalanced by northerly winds (N345-N348) in the higher tropospheric layers (from 7 to 9 kilometers), thus resulting in a southward dispersal axis. Similar N315 to N360 winds are systematically observed for hurricanes David, Hugo and Maria, either in the low, mid- or high troposphere (SupplementarymaterialFigure S4a, b, c, d, g and h). As in the previous section, this N315-N360 orientation is thus the main criterion to obtain a southward dispersal axis. Finally, hurricane Georges displays a main southeastward dispersal axis (thus not consistent with the Bellefontaine dispersion axis) in response to low tropospheric winds oriented N278 to N288.
The main southward dispersal axis is retrieved from these hurricane simulations (Figure 9), but some differences can be noted when compared to the Bellefontaine isopach map inferred from field data (Figure 4b). In the first place, the dispersion induced by the hurricanes appears more elongated than in the Bellefontaine case, and the thicknesses do not match those measured in the field (especially on the eastern flanks of the volcano). This difference could be due to strong winds present within the entire tropospheric column. In the second place, an interesting feature is that the maximum thickness is shifted from the vent for hurricanes David (Figure 9a), Hugo (Figure 9b) and Maria (Figure 9d). Such a pattern was never observed at Mount Pelée volcano, and could be a response to the change in wind speed noted between 3 to 5 km of altitude for hurricanes David and Hugo (Supplementary material Figure S4a, b, c and d), and between 0 and 2 km of altitude for hurricane Maria (SupplementarymaterialFigure S4g and h).
We conclude that a hurricane passing to the north of Martinique can indeed produce northerly winds. However, it remains difficult to prove convincingly that a hurricane can explain the dispersion of the Bellefontaine products, mainly because of the simulated maximum thickness shifted from the vent, and because the elongated isopachs produced are significantly different from the Bellefontaine deposit pattern measured in the field.
5. Implications for volcanic hazard assessment
5.1 Comparison with the most recent Plinian eruptions in Martinique
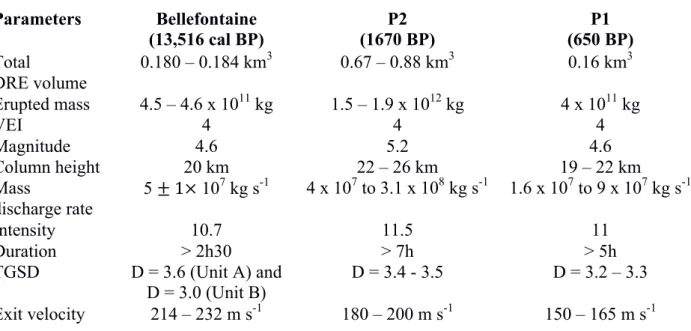
First and foremost, the Bellefontaine event contrasts with the two most recent Plinian eruptions at Mount Pelée volcano (P1 and P2, see Table 1) by its unusual southward dispersal. But one can note some other differences between these three eruptions. The minimum eruption durations are estimated to be 2h30 for the Bellefontaine eruption, compared to 7h for P2, and 5h for P1, making Bellefontaine a relatively short-duration event in Martinique. Grain-size analyses reveal that the eruptive products of the Bellefontaine eruption are coarser (D = 3.0 for main Unit B) than those of the P2 (D = 3.4) and P1 eruptions (D = 3.2). Moreover, the Bellefontaine eruption seems to be the only one for which no PDC deposits were identified (which would mean that no column collapse occurred). Apart from these points, the eruptive parameters retrieved from field data for the Bellefontaine eruption are close to those estimated for the P1 and P2 eruptions. All three eruptions are VEI 4 events during which the Plinian column reached a similar maximum height (i.e., 19 – 21 km for the Bellefontaine event, compared to 22 – 26 km for P2, and 19 – 22 km for P1). Their mass discharge rates are also very similar to each other (≈107 kg s-1).
These three eruptions, similar in terms of eruptive parameters, show the importance of wind variability in setting the main dispersal axis as they each spread tephra in a different direction. Taken together, they impacted the totality of the northern part of Martinique (up to Fort-de-France),
and thus constitute a strong basis to include Plinian eruptions in volcanic hazard assessment in Martinique.
5.2 Impact of wind on hazard assessment
In many volcanic hazard studies using tephra dispersion models, the impact of wind is investigated by considering mean wind profiles typically averaged over a season (Komorowski et al., 2008; Lindsey and Robertson, 2018). This may be taken as a valid assumption for most eruptions in the Lesser Antilles as the trade and anti-trade winds are considered to enforce a largely invariable regime, especially during the dry season (from December to May). However, we show in this study that for the Bellefontaine eruption, considering a mean wind profile cannot reproduce the dispersion deposits as they are found in the field (Figure 6c and d). While exploring the 1979-2017 ERA-Interim dataset to estimate the number of occurrences of wind configuration that could have produced tephra deposits similar to those observed for the Bellefontaine eruption, we noticed that although the trade wind regime is ubiquitous, exceptional circumstances indeed exist and need to be taken into account. Contrary to the dry season during which the wind directions are remarkably stable, they are quite variable during the wet season, i.e. from June to November (Figure 6a and b). The wind speed also remains uniform in the troposphere during the dry season, whereas it fluctuates during the wet season. Above 20 km, the wind speed can strongly vary during the whole year. These results can explain the discrepancy between the simulations presented in Figure 6c and d and our field measurements.
Applying the four criteria required to produce Bellefontaine-like dispersion axes (described in Section 4.2) on our complete ERA-Interim wind database (1979-2017), we have detected 1,327 (out of 56,984 cases) northerly wind profiles blowing over Martinique that could have produced southward deposit dispersion similar to the Bellefontaine eruption. We thus calculate that the monthly probability of spreading tephra to the south of the island including the city of
Fort-de-France lies between 0 and 5% during the wet season, and between 2 and 4% during the dry season (Figure 10). We note that there is a non-negligible probability of spreading tephra towards the south of Martinique during most part of the year, and that the highest probabilities correspond to seasonal transitions in November (4.7%) and May (3.8%). One can note that northerly winds due to a hurricane passing by Martinique can be hidden in the wind profiles likely to reproduce the Bellefontaine deposit dispersion during the wet season. Our results however strongly support that most of the northerly winds (99.9%) are the result of a particular atmospheric circulation lasting between ≈6h and ≈3 days. The atmospheric pattern linked to Bellefontaine-like events (Section 4.2) is indeed a result of a peculiar situation wherein the path of the subtropical jet-stream is spitted into two branches: a northern branch flowing from the West to the East (standard behavior), and a southern branch meandering toward the South before flowing to the East (Supplementary material Figure S5a). Reasons leading to this change are beyond the scope of this study, but the common feature seems to be a drifting to the North (> 30°N latitude) of the high/low-pressure zone at the surface/tropopause in the central Atlantic Ocean. In contrast, a hurricane is a transient and local system (Supplementary material Figure 5b), and thus, the chance of it passing close enough to Martinique, along an appropriate path, during an eruption is less probable than northerly winds such as those presented in Section 4.2. This probability should be taken into account into a future multi-hazard assessment in Martinique.
These results highlight the scarcity of the cases in Martinique yielding Bellefontaine-like southward tephra dispersion. The Bellefontaine event is, however, the proof that such a scenario (impacting half of the island) remains possible for future eruptions in Martinique as well as other Caribbean volcanoes (e.g., Brazieret al., 1982; Poret et al., 2017; Poulidis et al., 2018). Such wind conditions are of crucial importance for hazard assessment as our HAZMAP calculations show that a Bellefontaine-like eruption would spread over 2 cm of ash on the city of Fort-de-France, a situation not currently represented on the hazard map (Stieltjes and Mirgon, 1998). Moreover, Fort-de-France and its surrounding area are densely populated (more than 123,000 inhabitants), which
increase their vulnerability – and therefore the volcanic risk – to a future eruption. We thus conclude that models must include the daily variability of wind profiles instead of using season-averaged ones to depict volcanic hazard and risk in Martinique (and in other similar settings) more accurately.
6. Conclusion
We have presented a new comprehensive field study of the Bellefontaine Plinian eruption. The deposits of this eruption are those of the hitherto enigmatic P3-2 unit identified by Westercamp and Traineau (1983). New radiocarbon dating data provide an age of 13,516±42 cal BP for this eruption. The field data collected are combined with physical models of volcanic plumes to achieve a detailed reconstruction of eruptive dynamics. After an initial opening phase characterized by the formation of a small plume (Unit A), the eruption produced a ≈20 km-high stable column (Unit B). Our calculations show that Bellefontaine was a small Plinian eruption (VEI=4, M=4.6). The total volume of tephra is estimated to be larger than 0.18 km3 DRE, and the mass eruption rate was sustained at ≈ 5 × 10⁷ kg s-1during at least 2h30.
Simulations of tephra dispersion using the HAZMAP model suggest that the eruption probably did not occur during a hurricane, but rather under weak northerlies in upper troposphere (7-18 km) occasionally measured over Martinique, and could have spread volcanic tephra as far as the city of Fort-de-France. This finding identifies a major caveat in using mean seasonal wind profiles, which provide information about the most probable case only, to assess hazard-prone areas with a high degree of confidence. To improve volcanic disaster forecasting, especially in regions like small tropical islands, the daily variability of winds in terms of speed and direction must be taken into account.
The authors warmly thank two anonymous reviewers, and the editor, J. Gardner for their very useful comments, which greatly improved the original version of this paper. We are thankful to O. Roche and L. Chupin for their help during preliminary field investigations and for stimulating discussions. We are grateful to the staff of the Mt. Pelée volcanological observatory (OVSM) for their assistance. We also thank L. Beck, E. Delque-Kolic, J.-P. Dumoulin, and C. Moreau (LMC14, CNRS UMS2572) who performed the 14C dating. This work was funded by the INSU-CNRS Artemis 2017 program for 14C dating, the RAVEX ANR Project (ANR contract ANR-16-CE03-0002) and is part of A. Michaud-Dubuy’s PhD thesis. This study contributes to the IdEx project "Université de Paris" (ANR-18-IDEX-0001).
Appendix A
We collected and analyzed sixteen samples from Bellefontaine deposits in order to determine the total grain size distribution (TGSD) of each phase of the eruption. All the samples were dried for 24 h in an oven and sieved by hand down to 6φ (32 µm). The lithic fragments were separated from pumices by hand in the size range -5φ to -2φ (32 mm to 4 mm). Volume calculations for isomass maps for each φ interval were then used to infer the grain-size distributions of single sublayers. We calculated the cumulative frequency curves using the method of Kaminski and Jaupart (1998), which accounts for the power law size distribution of the rock fragments (Hartmann, 1969; Turcotte, 1986; Alibidirov and Dingwell, 1996; Kueppers et al., 2006):
! !! ≥ !! = !!!!, (A1)
where N(Rp ≥ rp) is the number of particles with a radius larger than r, and D is the power-law
exponent. The latter fully characterizes the grain-size distribution of both fall and PDC deposits and generally ranges between 2.9 and 3.9 (Kaminski and Jaupart, 1998). The value of the exponent D
reflects the fragmentation efficiency, and thus quantifies the fraction of fine (D > 3, efficient fragmentation) or coarse (D < 3, poorly efficient fragmentation) particles in the deposit. It has been proven to control the total amount of gas available in the turbulent flow (Kaminski and Jaupart, 1998) hence to affect the maximum column height of sustained Plinian columns (Girault et al., 2014) and collapsing fountains (Michaud-Dubuy et al., 2018). This parameter is thus important to characterize the eruption dynamics. Kaminski and Jaupart (1998) have shown that the exponent D can be accurately retrieved from field deposits by using any sufficiently large range of sizes because it would take gross changes/errors in the sieve data outside this range to affect its value. Thus, the lack of fine-grained particles lost at sea, or the uncertainties in sieving analyses do not affect its estimation.
The total grain-size distribution of Bellefontaine deposits is calculated using the method of
Kaminski and Jaupart (1998). We evaluated the total mass in sieve class φ, !!, by the volume
integral
!!= !!ℎ ! !! ! ! ! d!, (A2)
where ℎ ! is the deposit thickness, !! ! is the concentration of class φ at distance ! from the vent,
! ! d! is the area bounded by isopachs at distances ! and ! + d!, and L is the distance where h or !!
drop to zero. We used linear interpolations for h and !! between localities.
References
Alibidirov, M., Dingwell, D.B., 1996. Magma fragmentation by rapid decompression. Nature. 380, 146-148.
Bonadonna, C., Ernst, G.G.J., Sparks, R.S.J., 1998. Thickness variations and volume estimates of tephra fall deposits: the importance of particle Reynolds number. J. Volcanol. Geotherm. Res. 81, 173-187.
Bonadonna, C., Costa, A., 2012. Estimating the volume of tephra deposits: a new simple strategy. Geology 40(5), 415-418.
Bonadonna, C., Costa, A., 2013. Plume height, volume, and classification of explosive volcanic eruptions based on the Weibull function. Bull. Volcanol. 75, 742-761.
Bonadonna, C., Houghton, B.F., 2005. Total grain-size distribution and volume of tephra fall deposits. Bull. Volcanol. 67, 441-456.
Bonasia, R., Capra, L., Costa, A., Macedonio, G., Saucedo, R., 2011. Tephra fallout hazard assessment for a Plinian eruption scenario at Volcan de Colima (Mexico). J. Volcanol. Geotherm. Res. 203, 11–22. doi:10.1016/j.jvolgeores. 2011.03.006
Bonasia, R., Costa, A., Folch, A., Capra, L., Macedonio, G., 2012. Numerical simulation of tephra transport and deposition of the 1982 El Chichon eruption and implications for hazard assessment. J. Volcanol. Geotherm. Res. 231, 232, 39–49. doi:10.1016/j.jvolgeores.2012.04.006
Boudon, G., Le Friant, A., Villemant, B., Viode, J-P., 2005. Martinique, in Volcanic Hazard Atlas
of The Lesser Antilles, edited by Lindsay JM, Robertson REA, Shepherd JB, Ali S, pp. 127-146,
Seismic Research Unit, The University of the West Indies, Trinidad and Tobago, W.I.
Brazier, S., David, A.N., Sigurdsson, H., Sparks, R.S.J., 1982. Fall-out and deposition of volcanic ash during the 1979 explosive eruption of the Soufriere of St. Vincent. J. Volcanol. Geotherm. Res. 14, 335–359. Doi:10.1016/0377-0273(82)90069-5.
Bronk Ramsey, C., 2009. Bayesian analysis of radiocarbon dates. Radiocarbon. 51, 337–360.
Pelée volcano (Lesser Antilles): The P1 AD 1300 eruption. Bull. Volcanol. 74, 2187-2203.
Carazzo, G., Girault, F., Aubry, T., Bouquerel, H., Kaminski, E., 2014. Laboratory experiments of forced plumes in a density-stratified crossflow and implications for volcanic plumes. Geophys. Res. Lett. 41, 8759-8766.
Carazzo, G., Tait, S., Kaminski, E., 2019. Marginally stable recent Plinian eruptions of Mt. Pelée volcano (Lesser Antilles): The P2 AD 280 eruption. Bull. Volcanol. 81, 1-17. doi:10.1007/s00445-018-1265-6
.
Carey, S., Sparks, R.S.J., 1986. Quantitative models of the fallout and dispersal of tephra from volcanic eruption columns. Bull. Volcanol. 48, 109–125.
Carey, S., Sigurdsson, H., 1986. The 1982 eruptions of El Chichon volcano, Mexico (2): Observations and numerical modeling of tephra-fall distribution. Bull. Volcanol. 48, 127-141.
Costa, A., Dell’Erba, F., Di Vito, M.A., Isaia, R., Macedonio, G., Orsi, G., Pfeiffer, T., 2009. Tephra fallout hazard assessment at the Campi Flegrei caldera (Italy). Bull. Volcanol. 71(3), 259– 73. doi:10.1007/s00445-008-0220-3.
Costa, A., Suzuki, Y.J., Cerminara, M., Devenish, B.J., Esposti Ongaro, T., Herzog, M., Van Eaton, A.R., Denby, L.C., Bursik, M., de’ Michieli Vitturi, M., Engwell, S., Barsotti, S., Folch, A., Macedonio, G., Girault, F., Carazzo, G., Tait, S., Kaminski, E., Mastin, L.G., Woodhouse, M.J., Phillips, J.C., Hogg, A.J., Degruyter, W., Bonadonna, C., 2016a. Results of the eruptive column model inter-comparison study. J. Volcanol. Geotherm. Res. 326, 2–25.
Costa, A., Pioli, L., Bonadonna, C., 2016b. Assessing tephra total grain-size distribution: insights from field data analysis. Earth Planet. Sci. Lett. 443, 90-107.
Daggit, M.L., Mather, T.A., Pyle, D.M., Page, S., 2014. AshCalc – a new tool for the comparison of the exponential, power-law and Weibull models of tephra deposition. J. Appl. Volcanol. 3:7.
Dee, D.P., Uppala, S.M., Simmons, A.J., Berrisford, P., Poli, P., Kobayashi, S., Andrae, U., Balmaseda, M.A., Balsamo, G., Bauer, P., Bechtold, P., Beljaars, A.C.M., van de Berg, L., Bidlot, J., Bormann, N., Delsol, C., Dragani, R., Fuentes, M., Geer, A.J., Haimberger, L., Healy, S.B., Hersbach, H., Hólm, E.V., Isaksen, L., Kållberg, P., Köhler, M., Matricardi, M., McNally, A.P., Monge-Sanz, B.M., Morcrette, J.-J., Park, B.-K., Peubey, C., de Rosnay, P., Tavolato, C., Thépaut, J.-N., Vitart, F., 2011. The ERA-Interim reanalysis : configuration and performance of the data assimilation system. Q. J. R. Meteorol. Soc. 137, 553-597.
Dunion, J .P., 2011. Rewriting the climatology of the tropical North Atlantic and Caribbean Sea atmosphere. J. Climate. 24, 893-908. https://doi.org/10.1175/2010JCLI3496.1
Franklin, J.L., Black, M.L., Valde, K., 2000. Eyewall wind profiles in hurricanes determined by GPS dropwindsondes. In Preprints, 24th Conf. on Hurricanes and Tropical Meteorology, Fort Lauderdale, FL, Amer. Meteor. Soc (pp. 446-447).
Girault, F., Carazzo, G., Tait, S., Ferrucci, F., Kaminski, E., 2014. The effect of total grain-size distribution on the dynamics of turbulent volcanic plumes. Earth Planet. Sci. Lett. 394, 124-134. Girault, F., Carazzo, G., Tait, S., Kaminski, E., 2016. Combined effects of total grain-size distribution and crosswind on the rise of eruptive volcanic columns. J. Volcanol. Geotherm. Res. 326, 103-113.
Hartmann, W.K., 1969. Terrestrial, lunar and interplanetary rock fragmentation. Icarus. 10, 201-213.
Hersbach, H., Bell, B., Berrisford, P., Horányi, A., Muñoz Sabater, J., Nicolas, J., Radu, R.,
Schepers, D., Simmons, A., Soci, C., Dee, D., 2019. Global reanalysis: goodbye ERA-Interim, hello ERA5. ECMWF Newsletter. 159, 17-24.
Kaminski, E., Jaupart, C., 1998. The size distribution of pyroclasts and the fragmentation sequence in explosive volcanic eruptions. J. Geophys. Res. 103, 29,759–29,779.
sub-plinian tephra dispersal during the 1530 AD Soufriere (Guadeloupe) eruption: implications for scenario definition and hazards assessment. J. Volcanol. Geotherm. Res. 178, 491–515.
Kossin, J.P., Camargo, S.J., Sitkowski, M., 2010. Climate modulation of North Atlantic hurricane tracks. J. Climate. 23, 3057-3076. https://doi.org/10.1175/2010JCLI3497.1
Kueppers, U., Perugini, D., Dingwell, D.B., 2006. “Explosive energy” during volcanic eruptions from fractal analysis of pyroclasts. Earth. Planet. Sci. Lett. 248, 800-807.
Lajoie, J., Boudon, G., Bourdier, J-L., 1989. Depositional mechanics of the 1902 pyroclastic nuée-ardente deposits of Mt. Pelée, Martinique. J. Volcanol. Geotherm. Res. 38, 131-142.
Landsea, C.W., Franklin, J.L., 2013. Atlantic hurricane database uncertainty and presentation of a new database format. Monthly Weather Review. 141, 3576-3592. doi: 10.1175/MWR-D-12-00254.1.
Le Friant, A., Boudon, G., Deplus, C., Villemant, B., 2003. Large-scale flank collapse events during the activity of Montagne Pelée, Martinique, Lesser Antilles. J. Geophys. Res. 108(B1), 2055. doi:10.1029/2001JB001624, 2003.
Lindsey, J.M., Robertson, R.E.A., 2018. Integrating volcanic hazard data in a systematic approach to develop volcanic hazard maps in the Lesser Antilles. Frontiers in Earth Science 6, 42.
Macedonio, G., Costa, A., Folch, A., 2008. Ash fallout scenarios at Vesuvius: Numerical simulations and implications for hazard assessment. J. Volcanol. Geotherm. Res. 178, 366-377. Macedonio, G., Costa, A., Longo, A., 2005. A computer model for volcanic ash fallout and assessment of subsequent hazard. Comput. & Geosci. 31, 837-845.
Macedonio, G., Costa, A., Scollo, S., Neri, A., 2016. Effects of eruption source parameter variation and meteorological dataset on tephra fallout hazard assessment: example from Vesuvius (Italy). J. Appl. Volcanol. 5:5. DOI 10.1186/s13617-016-0045-2.
of the 79 AD eruption of Vesuvius. J. Geophys. Res. 93(B12), 14817–14827.
Manzella, I., Bonadonna, C., Phillips, J.C., Monnard, H., 2015. The role of gravitational instabilities in deposition of volcanic ash. Geology. 43, 211-214. Doi:10.1130/G36252.1.
Michaud-Dubuy, A., Carazzo, G., Kaminski, E., Girault, F., 2018. A revisit of the role of gas entrapment on the stability conditions of explosive volcanic columns. J. Volcanol. Geotherm. Res. 357, 349-361.
Murakami, H., 2014. Tropical cyclones in reanalysis data sets. Geophys. Res. Lett. 41, 2133-2141. doi:10.1002/2014GL059519.
Newhall, C.G., Self, S., 1982. The volcanic explosivity index (VEI): an estimate of explosive magnitude for historical volcanism. J. Geophys. Res. 87, 1231–1238.
Pfeiffer, T., Costa, A., Macedonio, G., 2005. A model for the numerical simulation of tephra fall deposits. J. Volcanol. Geotherm. Res. 140(4), 273–94. doi:10.1016/j.jvolgeores.2004.09.001
Poret, M., Costa, A., Folch, A., Martí, A., 2017. Modelling tephra dispersal and ash aggregation: The 26th April 1979 eruption, La Soufrière St. Vincent. J. Volcanol. Geotherm. Res. 347, 207–220. Doi:10.1016/j.jvolgeores.2017.09.012.
Poulidis, A.P., Phillips, J.C., Renfrew, I.A., Barclay, J., Hogg, A., Jenkins, S.F., Robertson, R., Pyle, D.M., 2018. Meteorological controls on local and regional volcanic ash dispersal. Scientif. Rep. 8, 6873. Doi:10.1038/s41598-018-24651-1.
Pyle, D.M., 1989. The thickness, volume and grainsize of tephra fall deposits. Bull. Volcanol. 51, 1–15.
Pyle, D.M., 2000. Sizes of volcanic eruptions. In: Sigurdsson H, Houghton B, Reimer H, Stiw J, McNutt S (eds) Encyclopedia of volcanoes. Academic, San Diego, pp 263-269
international calibration (IntCal) criteria. Radiocarbon. 55, 1923–1945.
Rogers, E.M., and Sood, R. Mass media operations in a quick-onset natural disaster: Hurricane David in Dominica. Working Paper, Annenberg School of Communications, University of Southern California, Los Angeles, 1981.
Roobol, M.J., Smith, A.L., 1976. Mount Pelée, Martinique: a pattern of alternating eruptive styles. Geology. 4, 521–524.
Smith, A.L., Roobol, M.J., 1990. Mt. Pelée, Martinique: A Study of an Active Island Arc Volcano. Geol. Soc. Am. Memoir 175.
Stieltjes, L., Mirgon, C., 1998. Approche méthodologique de la vulnérabilité aux phénomènes volcaniques: Test d’application sur les réseaux de la Martinique. Unpublished Internal Report No. R 40098, Bureau de Recherches Géologiques et Minières, Marseille.
Suzuki, T., 1983. A theoretical model for dispersion of tephra, in: Shimozuru, D., Yokoyama, I. (Eds.), Arc Volcanism: Physics and Tectonics. Terra Scientific Publishing Company (TERRAPUB), Tokyo, pp. 93–113.
Traineau, H., Westercamp, D., Bardintzeff, J.M., Miskovsky, J.C., 1989. The recent pumice eruptions of Mt. Pelée volcano, Martinique. Part I: Depositional sequences, description of pumiceous deposits. J. Volcanol. Geotherm. Res. 38, 17–33.
Turcotte, D.L., 1986. Fractals and fragmentation. J. Geophys. Res. 91, 1921-1926.
Watt, S.F.L., Gilbert, J.S., Folch, A., Phillips, J.C., Cai, X.M., 2015. An example of enhanced tephra deposition driven by topographically induced atmospheric turbulence. Bull. Volcanol. 77, 35. Doi: 10.1007/s00445-015-0927-x.
Westercamp, D., Traineau, H., 1983. The past 5,000 years of volcanic activity at Mt. Pelée Martinique (F.W.I.): Implications for assessment of volcanic hazards. J. Volcanol. Geotherm. Res. 17, 159–185.
infrastructure: a review. J. Volcanol. Geotherm. Res. 286, 148–182.
Woodhouse, M.J., Hogg, A.J., Phillips, J.C., 2016. A global sensitivity analysis of the PlumeRise model of volcanic plumes. J. Volcanol. Geotherm. Res. 326, 54–76.
Woods, A.W., 1988. The fluid dynamics and thermodynamics of eruption columns. Bull. Volcanol. 50, 169–193.
Tables Parameters Bellefontaine (13,516 cal BP) (1670 BP)P2 (650 BP)P1 Total DRE volume 0.180 – 0.184 km 3 0.67 – 0.88 km3 0.16 km3 Erupted mass 4.5 – 4.6 x 10¹¹ kg 1.5 – 1.9 x 10¹² kg 4 x 10¹¹ kg VEI 4 4 4 Magnitude 4.6 5.2 4.6 Column height 20 km 22 – 26 km 19 – 22 km Mass discharge rate 5 ± 1× 10 7 kg s-1 4 x 10⁷ to 3.1 x 10⁸ kg s-1 1.6 x 10⁷ to 9 x 10⁷ kg s-1 Intensity 10.7 11.5 11 Duration > 2h30 > 7h > 5h TGSD D = 3.6 (Unit A) and D = 3.0 (Unit B) D = 3.4 - 3.5 D = 3.2 – 3.3 Exit velocity 214 – 232 m s-1 180 – 200 m s-1 150 – 165 m s-1
Table 1: Summary of the estimated eruptive parameters for the Bellefontaine eruption (this study)
and comparison with the P1 (Carazzo et al., 2012) and P2 eruptions (Carazzo et al., 2019).
Figures
Fig. 1: Isopach map (in centimeters) of the P3-2 sequence (here renamed the Bellefontaine
eruption) as drawn by Westercamp and Traineau (1983). Triangles indicate all drilling locations from Smith and Roobol, 1990. All maps were generated using the open source QGIS software. Coordinates are in WGS 84 – UTM Zone 20 system.
MARTINIQUE
200
Case-Pilote Bellefontaine
Saint-Pierre
Grand’ Rivière Basse Pointe
Mt. Pelée
Fort-de-France
50