READ THESE TERMS AND CONDITIONS CAREFULLY BEFORE USING THIS WEBSITE. https://nrc-publications.canada.ca/eng/copyright
Vous avez des questions? Nous pouvons vous aider. Pour communiquer directement avec un auteur, consultez la
première page de la revue dans laquelle son article a été publié afin de trouver ses coordonnées. Si vous n’arrivez pas à les repérer, communiquez avec nous à PublicationsArchive-ArchivesPublications@nrc-cnrc.gc.ca.
Questions? Contact the NRC Publications Archive team at
PublicationsArchive-ArchivesPublications@nrc-cnrc.gc.ca. If you wish to email the authors directly, please see the first page of the publication for their contact information.
NRC Publications Archive
Archives des publications du CNRC
This publication could be one of several versions: author’s original, accepted manuscript or the publisher’s version. / La version de cette publication peut être l’une des suivantes : la version prépublication de l’auteur, la version acceptée du manuscrit ou la version de l’éditeur.
Access and use of this website and the material on it are subject to the Terms and Conditions set forth at
Settlement studies on the National Museum Building, Ottawa, Canada/
Etudes sur le tassement du Musee National du Canada a Ottawa
Crawford, C. B.
https://publications-cnrc.canada.ca/fra/droits
L’accès à ce site Web et l’utilisation de son contenu sont assujettis aux conditions présentées dans le site LISEZ CES CONDITIONS ATTENTIVEMENT AVANT D’UTILISER CE SITE WEB.
NRC Publications Record / Notice d'Archives des publications de CNRC:
https://nrc-publications.canada.ca/eng/view/object/?id=ed36be6f-7753-4c53-9f8e-e41d8b2ba266 https://publications-cnrc.canada.ca/fra/voir/objet/?id=ed36be6f-7753-4c53-9f8e-e41d8b2ba266
NATIONAL RESEARCH COUNCIL
CANADA
Settlement Studies
on
the
National
Museum
Building
OTTAWA, CANADA
b y
CARL
B.
CRAWFORDReprinted from Proceedings of the Third International Conference on Soil Mechanics and Foundation Engineering, Switzerland, 16th to 27th August 1953.
Reprinted from Proceedings of the Third International Conference on Soil Mechanics and Foundation Engineering, Switzerland 16th t o 27th August 1953, Vcl. I , Session 4
Proceedings edited by the Organizing Coinmittee of the Third Conference, Gloriastrasse 39, Zurich 6 Printed by Berichthaus, Zurich
Session
415
Settlement Studies on the National Museum Building,
Ottawa, Canada
Etudes sur le tassement du Mus6e National du Canada
a
Ottawa
by CARL B. CRAWFORD, Assistant Research Officer, Soil Mechanics Section, National Research Council, Ottawa, Canada
Summary
The building for the National Museum of Canada is a four-storey structure about 400 feet long and 150 feet wide with heavy exterior walls of sandstone resting on spread footings. Since completion of the building in 1910, footing loads which vary from about 1; to 4 tons per square foot have caused a differential settlement of more than 1; feet.
Borings show that the building is underlain by about 50 feet or sensitive, compressible marine clay. Below this is a variety of silty clays, clayey silts, and sands. Glacial till occurs at a depth of about 120 feet and bedrock at 132 feet. Regular engineering tests were per- formed on undisturbed sanlples obtained outside the influence of the building in order to determine grain size, strength, consolidation and plasticity characteristics of the soil.
An attempt is made to determine the cause of settlements and to compute settlements using soil mechanics theories. These move- ments are compared with actual settlements. Theoretical bearing capacity is compared with estimated actual bearing capacity. Com- ments are made on the existing foundation design and a design which would have been chosen for this building on the basis of modern practice.
The foundation problems of the National Museum Building in Ottawa, Canada, have interested engineers since 1910 when, after much difficulty, the structure was completed. One of the functions of the Division of Building Research of the National Research Council is to investigate building problems in Canada. Recently, the Division was given the opportunity of studying the foundation conditions of this interesting structure. This is a summary report of the results of the study.
Building Design
The Museum Building is a four-storey structure about 400 feet long and 150 feet wide with heavy sandstone bearing walls
Le MusCe National du Canada, construit en 1910, est un bitiment de quatre Ctages d'i peu prks 400 pieds de longueur et 150 pieds de largeur avec de lourds murs extCrieurs en grks tail16 se reposent sur des semelles 5 empattements. La charge des fondations, qui varie de 1,5 ii 4 tonnes par pied carrC, a provoquC des tassements diffkrentiels de plus de 1,5 pieds.
Les sondages ont rCvClC que le bgtiment est situe sur une couche de 50 pieds d'argile marine trks sensible et compressible. Plus bas on trouve des argiles sablonneuses, sables argileux et sables fins. La moraine glaciaire commence i une profondeur de 120 pieds et la roche de fond
A
132 pieds. Des essais standards ont CtC faits sur des carottes de sondages provenant des forages situes en dehors de l'in- fluence de la charge du b2tinlent, avec le but d'obtenir la composition granulomCtrique, la rCsistance au cisaillement et les caractCristiques de consolidation et plasticite.On a essay6 de dCterminer les causes des tassements et de calculer les tassements probables en se basant sur les theories de la mCcanique des sols. Ces mouvements ant CtC comparbs avec les tassements actuels. La capacitC portante thCorique a CtC comparCe avec la capa- citC existante relevCe. Les diffkrences entre le projet des fondations rCalisC et celui qui aurait CtC choisi actuellement, bask sur la pratique moderne, ont CtC discutks.
which rest o n spread footings. A s will be seen from the illus- trations, it is a n example of Victorian architecture at its mas- sive best !
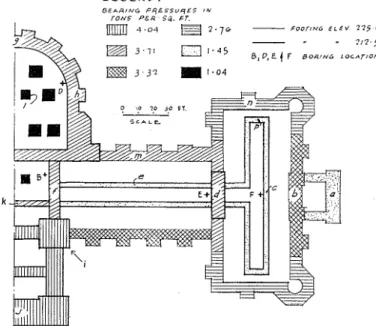
Since there is n o record of the design loads for t h e Museum, a weight analysis of the Building was made to determine foot- ing loads o n the soil. If the foundations were assumed to be completely flexible, unit loads u p to 53 tons p e r square foot would exist. N o doubt the heavy foundations a r e capable of considerable distribution of load and the calculated footing pressures are believed to be within 5% of the actual pressures. Load estimates made in 1915 a r e very close to those obtained in this study.
L E G E N W : B E n a , u c r P F ( E S S u q 4 5 l N T O N 5 P E R 5 4 F T 4 04 2 . 7 6 - F O O T I N G e i s v ? ? 5 0
-
v " ? I 7 5 3 7 1n
1 . 4 5 8, 0 , E ( F B O R r N L lOCAT,ON5 3 3 2 1 1 . 0 4 ? '? 7.0 A? FT. kFig. 1 Foundation Pressures in Tons per Square Foot Pression des fondations en tonnes par pied carre
vations and that unit loads vary widely. This has resulted in severe differential settlement. Fortunately, above the ground floor the internal structure is carried entirely on plate girders which span the exterior walls. This has allowed relatively uni- form settlement of the upper portion of the Building. The basement and ground floors, however, are supported on both exterior and interior footings and severe distortion of the floors and interior walls is evident.
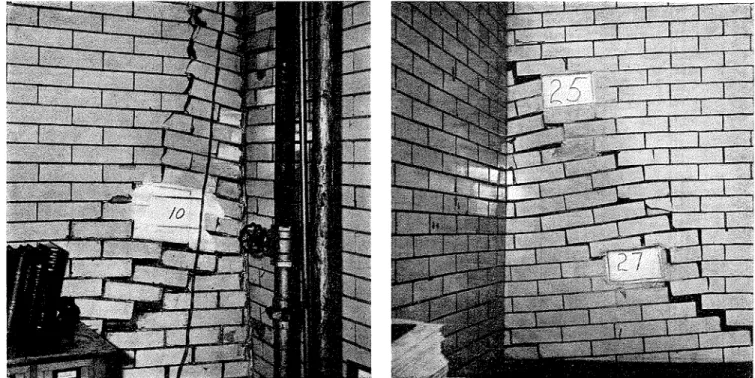
Fig. 3 shows two typical failures of interior brick walls. These failures, although alarming in appearance, are not of great structural importance. The sub-basement floor is a strik- ing illustration of differential movement. The floor undulates from footing to footing and this aspect is often exaggerated by the springing-up of footings under archways where the load is interrupted. In one instance between two heavy pillars a con- tinuous footing had broken and had raised the floor by several inches. Consequently the sub-basement floor was of little use in determining actual settlements.
Settlements were noticed even during construction. By 1915 the tower at the front of the Building was out of plumb by more than a foot. Consequently, during that year the settle-
0 "A" Boring
ment of the Building was carefully observed. In 191 6 the upper
portion of the tower was removed to prevent complete failure. Fig. 4 shows the building and, separately, the original tower. Observations indicate that little settlement of the Building has occurred since the tower was removed. For this reason pressures shown in Fig. 1 include the weight of the tower.
The total weight of the Building is about 65,000 tons of which less than 2% is live load. The weight of soil excavated was about 34% of the weight of the Building. The renloval of the upper portion of the tower reduced the corresponding footing pressures by 35%.
Stress distribution in the soil beneath various points was determined using influence charts (Newnzark, 1942). For the determination of each point on the vertical stress profile four values were necessary: (1) stress due to original overburden, (2) stress due to upper footings, (3) stress due to lower foot- ings, and (4) negative stress due to soil removed. Further conl- plications were introduced by the variety of footing pressures. Several typical profiles of vertical stress with depth are shown in Fig. 5. The corresponding points under the building where
stresses were computed are shown in Fig. 1.
All observations in this study were made for one-half of the building. This has simplified the study and is justified because the building is symnletrical in shape, loading, and actual settle- ment.
Soil Studies
Borings show that the Building rests on a 130-foot soil de- posit. The upper 50 feet consists of compressible marine clay which grades into clayey silt, sand and glacial till with in- creasing depth. This clay, deposited in an arm of the sea which invaded the region near the close of Pleistocene time, is com- monly called "leda clay" (Johnston, 1917). It covers a con- siderable portion of the populated regions of eastern Ontario and Quebec provinces.
Two borings were made at points A and C a s shown in
Fig. 2. In boring A, continuous sampling was carried out to
a depth of 80 feet, using a 2-inch, thin-walled piston sampler. Intermittent split spoon samples were taken below this depth and rock was encountered at 132 feet. At boring C, continuous samples were secured to a depth of 45 feet using a thin-walled piston sampler. In addition to these two borings outside the influence of the Building, four borings were made from the sub-
basement at points B, D, E, and F (Fig. 1) and undisturbed
samples obtained. Owing to the variety of borehole and foot-
Fig. 2 Location of Borings A and C Relative to Building
Emplacement des forages A et C par
Fig. 3 Illustration of Typical Settlement Cracks in Basement Fissures caractkristiques dans la cave
ing elevations, all samples are referred to absolute elevation above sea level in feet. The ground level around the building is at elevation 234.5.
Laboratory tests were performed on these samples and the results are shown in Figs. 6 to 11. Fig. 6 shows the results of
grain size analyses of the samples from boring A. Several ran-
dom tests. on samples from the other borings agreed closely with these results. In no case did the percentage of the various fractions vary more than 7% and the average variation was 24%. Fig. 7 shows water contents, Atterberg limits and the
Casagrande classification (Casagrande, 1948) for samples from
borings A and C. The average water content curve was ob-
tained by averaging groups of data.
The hydrometer and Atterberg limit tests were performed on sample trimmings and are therefore averages for the sample. The clay was stratified with occasional silty layers. In one case, at elevation 194.0 separate Atterberg limits were determined on two distinct layers and the results are shown in Fig. 7. Layers with more pronounced differences in properties are likely to be present.
Fig. 4 General View of Building Showing Portion of Tower Removed Vue gknkrale du bitiment avec tour dtmolie 5. gauche
S T R E S S IN TOMS P E R SQUARE FOOT
Fig. 5 Vertical Stress Distribution under Typical Points Courbes de pressions verticales sous points caracteristiques
Fig. G Distribution of Grain Size with Depth (M.I.T. Classification)
Distribution granulomitrique en fonction de la profondeur
Results of unconfined compression tests performed at a rate
of strain equal to 196 per minute on carefully cut specimens
3 inches high by 12 inches in diameter froin A and C boring
samples are shown in Fig. 8. The average curve, "A", was
obtained by averaging groups of points. The actual strength
is considered to be near the n~axinlumvalues obtained as shown
obtained as shown in curve "B", allowing for sample disturb-
ance and fissures near the surface (R~rtle~lge, 1944). The strength
of the upper soils was greatly affected in the laboratory by fissures which it was thought would not appreciably reduce the in situ strength. Attempts were made to test remoulded spe- cimens but the sensitivity of the soil made this impossible.
Several triaxial quick-tests were performed on sainples in an effort to determine the effect of fissures on strength values but owing to apparatus difficulties these results are not reported. Consolidation tests were performed on undisturbed samples froin all boreholes. Typical pressure versus void ratio curves are shown in Fig. 9. Two special tests were made using small loading increments and these showed the pre-consolidation
load to be increased from 10% to 15% by slow loading.
Specific gravity of the soil particles was found to average
about 2.83 with little variation throughout the top 50 feet.
Unit weight determinations were made on strength and con- solidation samples and from these results overburden pressures were computed.
From consolidation test results two curves of the most
probable preconsolidation loads are plotted in Fig. 10 together
with total and effective overburden stresses. Two interpre-
CASAGRANDE C L A S S I F I C A T / O N
7
0 2 0 4 0 6 0 80 100 P E R C E N T BY W E I G U T
2
Fig. 7 Variation of Water Content and Atterberg Limits with Depth Variation de la teneur en eau et limites d'Atterberg en fonction de la profondeur
PRESSURE (TONS PLR SQUARE FOOT)
Fig. 8 Variation of Unconfined Compression Strength with Depth Variation de la resistance A la compression simple en fonction
de la profondeur
tations of the method of preconsolidation are possible from test results. Curve (I), paralleling the effective overburden stress curve, indicates preconsolidation caused by overburden that has been removed during the history of the sediment. Curve (2), paralleling the total overburden stress curve, re- presents preconsolidation due to temporary lowering of the groundwater table causing natural consolidation during the history of the sediment. The slight displacement to the right would be due to subsequently stripped overburden.
As tests 36-7 and 36-9 are from boring A and tests 36-46
and 36-48 are from boring C, it is difficult to disregard these
results. These two interpretations depend in part on the valid- ity of test results between elevations 205 and 213. If full weight is given to these results the second interpretation is more reasonable. If, however, they may be disregarded the first interpretation, curve (I), is more reasonable. Other test re- sults in the immediate vicinity support this interpretation. The lowering of the water table would therefore have had to be a local phenomena over a limited area. The opinion of geologists is that 20 or 30 feet of stripping by erosion is very likely in this region whereas temporary lowering of the groundwater table, although possible, is quite unlikely.
For these reasons curve (1) is considered to be the best inter- pretation of preconsolidation load and this curve is used for consolidation settlement calculations. The occurrence of fis- sures down to elevation 210 and the indication of desiccation
Fig. 9 Typical Pressure Void Ratio Curves
Courbes caractkristiques de l'indice des vides en fonction de la pression
down to the break in the preconsolidation curve a t elevation 213 is evidence that the groundwater table has been lower than it is now but not necessarily low enough to cause preconsoli- dation beyond curve (1).
Grain size and Atterberg limits test results (Figs. 6 and 7) indicate that a drainage layer for consolidation occurs at ele- vation 184.0 or higher. Drainage can also occur a t the footing elevations since the ground water table has been drawn down to the footings by artificial drainage.
Actual Settlement
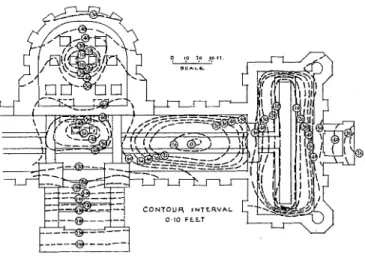
When built, the elevation of the Museum Building was not related to a permament bench mark. Therefore, the absolute settlement of the Building has had to be estimated. Fortu- nately, level points were established in 1915 around the out- side of the building all at the same course of stone. Several level surveys were made during 1915 using the entrances at each end of the building as references. Since 1949 an annual level survey of the original points has been made and many interior points have been added to the survey. By assuming that these entrances have not moved since construction it was possible to approximate the original elevation of all outside level points and therefore their subsequent settlement. By plotting present outside perimeter elevations and comparing these with present inside perimeter elevations, it was possible to approximate the
original ground floor elevation. By comparing ground floor elevations with basement floor elevations at points above one another at column locations (where movements should occur as a unit) it was possible to determine the original basement floor elevation. These comparisons were made for separate parts of the building and in each case the results were within 0.02 to 0.03 feet. With these original elevations determined, it was possible to use original and recent level points together to draw the contours of differential settlement.
If the assumption of no movement of the end entrances was true, these contours would represent absolute settlement. How-
ever, with this assun~ption, parts of the building which rest on
Legend:
Most
Minimum probable
-0
Value Value Fic. 10 Variation of Overburden and Preconsolidation Stresses with
Depth
Variation des pressions dues au poids du sol et preconsolidation en fonction de la profondeur
deep footings appeared to have risen 0.20 feet. Since there is no apparent reason why these footings which are loaded to 14 tons per square foot should rise, it was concluded that the entrances were dragged down by the main building. Careful observation of the entrances indicates that this is possible.
Although the vertical stress under point "a" in Fig. 5 appears
to be insufficient to cause settlement, it is based on the assump- tion of complete flexibility of the foundation and may actually be increased due to stiffness of the structure. Therefore to ob- tain absolute settlement 0.20 feet were added to all contours shown in Fig. 11.
A comparison of elevations taken in 1915 and 1951 show that during that period an average settlement of 0.10 feet has occurred all around the Building except in the vicinity of the tower. Where the tower joins the Building no change in ele- vation has occurred since 1915 and at the outer edge of the tower the walls appear to have risen about 0.13 feet due to rebound after removal of the upper part of the tower.
Colnputed Settlements
The total settlement of this structure probably collsists of elastic, plastic, and consolidation settlement. An attempted evaluation of the contribution of each of these to the total settlement would be of little use in view of the limited informa- tion on the strength properties of this soil and the lack of facts concerning the early history of the building. Generally speak- ing, the footing loads exceed the elastic range of the soil so that elastic settlements would be followed by plastic deformation. Although the contribution of each is unknown, a considerable part of the settlement shown in Fig. 11 is thought to be due
@
C O N T O U R I N T E R V A L
Fig. 11 Measured Settlement Contours Lignes de niveau des tassements mesuris
to these causes. A reasonably accurate estimation of theamount of consolidation settlement could probably be made by deter- mining the variation in water content immediately under several footings and comparing this with initial water contents. One of the purposes of making borings under the building was to make this comparison. Stress distributions show, however, that it is essential to obtain samples directly below the footings for this purpose. The size of footings and groundwater con- ditions make the procurement of these samples difficult but an attempt is planned.
Settlement computations based on the theory of consolida- tion (Terzaghi, 1943) were made for various selected points in
the building. The location of the points, a to p, is shown in
Fig. 1 and the computed settlements are shown in Table 1 tog- ether with estimated actual settlement. The actual settlement includes elastic and plastic deformation. Therefore the dis- crepancy between the actual and computed settlements is even greater than that shown in the Table.
Calculations of time versus degree of consolidation indicate that on the average 50% consolidation settlement will occur in 2 to 4 years and 80% will occur in 7 to 14 years after loading so that an explanation of the discrepancy by partially com- pleted consolidation is ruled out. Although this soil is quite impervious, the relatively short time required for almost corn- plete consolidation can be understood by reference to the stress differences presented in Fig. 5 which show that most of the consolidation would occur within 10 or 12 feet of the footings. The n o s t puzzling feature of the settlement of the structure occurs around the semi-circular part at the rear of the building,
generally represented by points g and h in Fig. 1. Footing
Table 1 Comparison of Observed Settlement and Computed Con- For comparative purposes the footings can be divided into
solidation Settlement four groups: (1) footings under the tower, (2) square footings
under the centre of the building, (3) all remaining deep foot- ings, (4) all shallow footings. A conlparison of computed values to actual bearing pressures is shown in Table 2. It will
Table 2 Ultimate Bearing Capacity of Soil Compared to Bearing
Pressure of Footings in Tons per Square Foot
Grorip
1. 2. 3. 4.
A possible reason may be that the excavation was left open longer than usual and that drying increased the preconsoli- dation load.
The occurrence of silt layers is worthy of comment. It is believed that silt layers in clay will tend to spread out the load
more than the elastic theory indicates (for example see Taylor.,
1948, or C a s a g r a n d e and Fadurn, 1944). Therefore, vertical
stress profiles under the building were modified to conform approximately to the W e s t e r g a a r d theory (see T a y l o r , 1948) in view of the stratification of the soil. Use of the modified values reduced the computed settlements shown in Table 1 by about 20%. Silt layers would also permit lateral drainage for con- solidation and so allow more rapid settlement.
Point a b c (1 e
f
b
h ii
k I 11 z 11 P Bearing CapacityBearing capacity computations are complicated by the un- usual foundation outline of the building. It is possible, how- ever, to obtain approximate values for ultimate bearing capa- city by assuming various equivalent rectangular footings. The
following formulae ( T e r z a g h i , 1943) were used for this com-
putation : Cornpuled Selllemenl ( f e e l ) 0 0.56 0 1.56 0 1.06 1.19 1.26 3.40 3.41 0.47 0 0.70 0.20 0 Actual Bearbig press,re
>
4.0 1.0 1.5-3.7 1.5-3.7 Location Tower Area Square Footings Other Deep Footings All Shallow Footings(1) For local shear failure
Measurecl Selller~~errl ( f e e l ) 0.20 0.55 0.08 0.55 0.10 0.65 0.30 0.43 0.80 1.58 0.60 0.10 0.57 0.58 0.10 4 = c N c f Y D ~ N ,
where q = ultimate bearing capacity
c = cohesion
y = unit weight of soil
Df = depth of footing below adjacent surface
Nc = 5.7 for p = 0
N, = 1.0 for p = 0
where p = angle of internal friction;
(2) For general shear failure
M ~ I I ~ I ~ I ~ I I N
I
Local General Sltear Shear q1 = CN,' ~ Y D ~ N , , ' where N,' = 3.8 for p = 0 N i = 1.0 for p = 0. MaxirnrnnI
Local Geiteral Shear Sllear 3.5 3.6 2.6 1.7One-half the unconfined compressive strength was used for the value of cohesion. Maximum values were obtained using curve
3.9 4.7 3.5 3.3 4.9 4.8 3.8 2.5
"B" in Fig. 8 and minimum values were obtained using curve
" A
".
5.4
6.5 5.1 4.8
be seen from these values that all footings are safe from general shear failure where maximum values for cohesion are used. This is the most important observation because the ~naximum values for cohesion are the most probable values of the natural soil and it is also likely that this brittle soil would fail in general shear rather than local shear.
Special attention should be drawn to the bearing values under the tower. Although the footing pressures are assumed to be slightly more than 4 tons per square foot, they were probably somewhat greater than this at the extreme outside wall due to a shift in the centre of gravity as the tower tilted away from the main building. It is likely that the actual ulti- mate bearing capacity was nearly reached and that it was reasonably close to the computed value.
Of the other values in Table 2 it is sufficient to note that maximum values, assuming local shear, and minimum values based on average unconfined compressive strength were ex- ceeded without failure.
Discussion
This study has two purposes: first, to compare fullscale settlements with theoretical settlement computations and se- cond, to study the engineering properties of marine clay which occurs in Canada and which is probably similar to some marine clays in other countries. The second part of this study has
added some values to the meagre information already on re-
cord. The first purpose has been partly fulfilled. The actual settlement of the structure has been determined with reason- able accuracy although the type of settlement, whether elastic or plastic, or caused by consolidation of the soil is not known. Probably the total settlement is partly due to each cause.
From this study it can be stated that for this particular soil the theory of consolidation as interpreted through standard consolidation test results does not give reasonable estimates of settlement. Since it is believed that the elastic theory gives reasonable values for vertical stress distribution it is possible that either the test preconsolidation loads are too small, the test compression index is too large or the theory of consoli- dation does not apply for this soil. It is not possible on the basis of present information to determine the effect of each of these factors.
Modern engineering practice would have suggested several older traditional approach as compared with the present day
improvements in the foundation design for this building. First semi-theoretical design practices.
it would not be advisable to have footings on two levels. The
sub-basement could have conveniently extended over the whole Acknowledgments
-
area of the building, thus raising the weight of excavated soil
The work presented in this paper has been made possible to 60% of the total weight of the building. Second, no footing
through the co-operation and kind assistance of Mr. E. A.
pressures should have exceeded 2.0 tons per square foot. For
this structure a modern designer might have specified a floating Gardner, Chief Architect of the Federal Department of Public
Works and Dr. F. J. Alcock, Curator of the Museum and
slab foundation with enough rigidity to resist any differential
members of their staffs. movement. Friction piles are not suitable since the soil is ex-
Special mention should be made of the encouragement and tremely sensitive, particularly around elevation 185.0. Point
assistance given to the author by Mr. R. F. Legget, Director
bearing piles would be unduly expensive because adequate
of the Division of Building Research with whose permission
bearing is not reached above a depth of 100 feet. this paper is presented.
Conclusions
The study of the soil on which this structure is founded has shown that the prediction of settlements based on the con- ventional theory of consolidation would be considerably in error. The reason for this discrepancy has not yet been found. Comparisons of computed and actual ultimate bearing capa- cities show theory to be quite accurate in this case. The results also indicate that the soil strength in situ, particularly in the fissured zone, is appreciably greater than the strength of small samples.
In this analysis there is the advantage of retrospect and attempting to explain what has happened rather than trying to predict from limited evidence what will happen. Although the foundation has fulfilled its purpose better than would be expected, its performance has shown the disadvantages of the
References
Casagratide, A . (1948): Classification and Identification of Soils. Ameri- can Society of Civil Engineers, Transactions, vol. 113, pp. 901-991. Casagratide, A. and Fadrrt?l, R. E. (1944): Application of Soil Mechanics
in Designing Building Foundations. American Society of Civil Engi- neers, Transactions, vol. 109, pp. 383-490.
Jol~t~stotr, PV. A . (1917): Pleistocene and Recent Deposits in the Vicinity of Ottawa, with a Description of the Soils. Memoir 101, No. 84,
Geological Series, Government Printing Bureau, Ottawa, 69 p.
Ne~vtnark, N . M . (1942). Influence Charts for Computation of Stresses in Elastic Foundations. Engineering Experiment Station Bulletin, Series No. 338. University of Illinois, Urbana, Ill. 28 p.
Rutledge, P . C . (1944): Relation of Undisturbed Sampling to Labora- tory Testing. American Society of Civil Engineers, Transactions,
v. 109, pp. 1155-1216.
Taylor, D. PV. (1948): Fundamentals of Soil Mechanics. J. Wiley and Sons, New York, 700 p.
Terzaglri, K. (1943): Theoretical Soil Mechanics. J. Wiley and Sons, New York, 510 p.