Creation, validation, and implementation of a Highly Accelerated Life Testing (HALT) procedure to improve the reliability of printed circuit boards
Texte intégral
Figure

![Figure 4: - Life Cycle of electronic components in the absence of burn-in test [10]](https://thumb-eu.123doks.com/thumbv2/123doknet/14516324.530612/25.918.142.772.335.693/figure-life-cycle-electronic-components-absence-burn-test.webp)


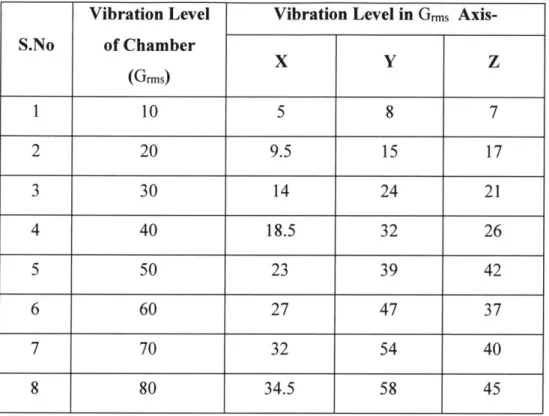
![Figure 28: Graphical representation of Vibrational variation at location ] on the PCB](https://thumb-eu.123doks.com/thumbv2/123doknet/14516324.530612/55.918.193.699.115.423/figure-graphical-representation-vibrational-variation-location-pcb.webp)

Documents relatifs
In addition, the MMP20 sequence of patient 2 displayed four other missense mutations of various functional weight when considering our evolutionary analysis (Figure 2,
On peut aussi remarquer de fa¸ con g´ en´ erale deux effets dans les approches LATIN 2-´ echelles lorsque la taille du probl` eme ` a grande ´ echelle croˆıt : le niveau d’erreur
within the simulation cell taken after 10 ns annealing at (a) T* = 0.50, showing tetra-Is, small <011> chains and {111} rod-like defects; and (b) T* = 0.79, showing
Data from 1,911 patients were collected from the data base: clinical type of Rett syndrome, genotype, age of onset, severity of epilepsy, and types of seizures.. Severity of epi-
To state FSCQ’s theorems, this paper introduces the Crash Hoare logic (CHL), which extends traditional Hoare logic with a crash condition, a recovery procedure, and logical
2 Overview of components emission drifts after accelerated life tests a LTOL and HTOL aging impact on emission level (mean drift for all samples) b LTOL and HTOL aging impact
R OBUST TEST PLAN BASED ON C OST PLANNING CRITERION The objective of the accelerated testing plan optimization is to determine the test plan parameters (stress levels, sample
Based on ADT, we propose a 5-step framework for the reliable lifetime prediction of SEM: (1) perform ADT with 64 (or 56) SEM samples tested under each of 6 different
