HAL Id: hal-03257300
https://hal.archives-ouvertes.fr/hal-03257300
Submitted on 15 Jun 2021
HAL is a multi-disciplinary open access
archive for the deposit and dissemination of
sci-entific research documents, whether they are
pub-lished or not. The documents may come from
teaching and research institutions in France or
abroad, or from public or private research centers.
L’archive ouverte pluridisciplinaire HAL, est
destinée au dépôt et à la diffusion de documents
scientifiques de niveau recherche, publiés ou non,
émanant des établissements d’enseignement et de
recherche français ou étrangers, des laboratoires
publics ou privés.
Copyright
and Controlling the Whining Noise
Alexandre Carbonelli, Emmanuel Rigaud, Joël Perret-Liaudet
To cite this version:
Alexandre Carbonelli, Emmanuel Rigaud, Joël Perret-Liaudet. Vibro-Acoustic Analysis of Geared
Systems-Predicting and Controlling the Whining Noise. Anton Fuchs; Eugenius Nijman; Hans-Herwig
Priebsch. Automotive NVH Technology, Springer, pp.63-79, 2016, 978-3-319-24055-8.
�10.1007/978-3-319-24055-8_5�. �hal-03257300�
Predicting and Controlling the Whining Noise
A. Carbonelli1, E. Rigaud, J. Perret-Liaudet
Abstract: The main source of excitation in gearboxes is generated by the meshing
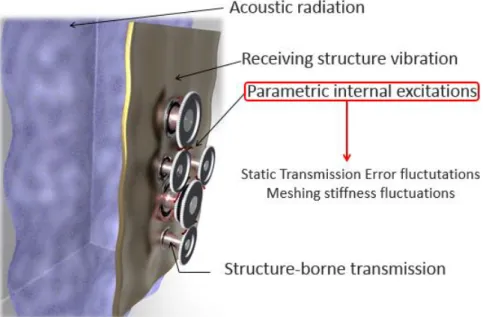
process. It is usually assumed that static transmission error (STE) and gear mesh stiffness fluctuations are responsible of noise radiated by the gearbox. They gener-ate dynamic mesh forces which are transmitted to the housing through wheel bodies, shafts and bearings. Housing vibratory state is directly related to the noise radiated from the gearbox (whining noise).
This work presents an efficient method to reduce the whining noise The two main strategies are to reduce the excitation source and to play on the solid-borne transfer of the generated vibration..STE results from both tooth deflection (depending of the teeth compliance) and tooth micro-geometries (voluntary profile modifications and manufacturing errors). Teeth compliance matrices are computed from a previous finite elements modeling of each toothed wheel. Then, the static equilibrium of the gear pair is computed for a set of successive positions of the driving wheel, in order to estimate static transmission error fluctuations. Finally, gear mesh stiffness fluc-tuations is deduced from STE obtained for different applied loads. The micro-ge-ometry is a lever to diminish the excitation. Thus, a robust optimization of the tooth profile modifications is presented in order to reduce the STE fluctuations.
The dynamic response is obtained by solving the parametric equations of motion in the frequency domain using a spectral iterative scheme, which reduces considerably the computation time. Indeed, the proposed method is efficient enough to allow a dispersion analysis or parametric studies. The inputs are the excitation sources pre-viously computed and the modal basis of the whole gearbox, obtained by a finite element method and including gears, shafts, bearings and housing.
All the different parts of this global approach have been validated with comparison to experimental data, and lead to a satisfactory correlation.
Keywords: vibro-acoustic, gear mesh dynamics, gear optimization, whining noise
1 Author, Vibratec, Ecully (France)
1. Introduction
Geared systems are the seat of vibrations induced by the meshing process. For this reason, a gearbox is an important source of noise and vibration in automotive industry. The gearbox internal sources of excitation are various. The main source corresponds to fluctuation of the static transmission error (STE) of the gear which transmits the drive torque [1-2]. STE corresponds to the difference between the actual position of the driven gear and its theoretical one.
𝑆𝑇𝐸(𝜃1) = 𝑅𝑏2. 𝜃2(𝜃1) − 𝑅𝑏1𝜃1 (1)
where 𝑅𝑏𝑗, is the base radius of gear 𝑗.
It is mainly due to voluntary (corrections) and involuntary (defects) geometrical deviations of the teeth at a micrometric scale and to elastic deformation of loaded teeth, wheel bodies and crankshafts. STE fluctuations also generates mesh stiffness fluctuations. Under operating conditions, the parametric excitations induce dynamic loads at the gear meshes, which are transmitted to the gearbox receiving structure via the wheel bodies, crankshafts and bearings, as presented in Figure 1. The vibra-tory state of the crankcase is the main source of the radiated noise [3].
STE fluctuations need to be minimized by introducing voluntary tooth micro-geometrical modifications in order to reduce the radiated noise. For this study, the selected optimization parameters for each gear pair are:
- the tip relief values 𝑋 of pinion and driven gear i.e. the amount of material remove on the teeth tip,
- the starting tip relief diameters 𝜙 of pinion and driven gear, - the added up crowning centered on the active tooth width 𝐶𝛽,𝑖/𝑗.
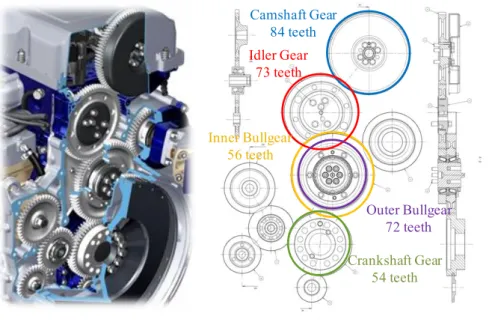
The optimization of tooth modifications in simple mesh gear system for a given torque has been studied by many authors [4-6] but the approach for multi-mesh gear systems optimization is still unusual [7]. The first part of this paper presents a com-plete optimization process for a truck timing cascade of gears displayed in Figure 2.
Figure 2: Studied gears for STE computation and optimization
In this study, the first cascade is designed with three helical gears and has 8 op-timization parameters (2 by gear, and 1 by mesh). The second cascade is designed with two gears and has therefore 5 optimization parameters. Moreover the modifi-cations made on teeth profile have to be satisfying for a wide torque range. That requires an efficient method as the number of possible solutions is extremely large, due to the combinatory explosion phenomenon. The Particle Swarm Optimization (PSO) [8] has been chosen because it is particularly efficient as it is an order 0 meta-heuristic, i.e. it not necessary to evaluate first derivatives of the function.
Furthermore, robustness of the obtained solutions has to be studied. Indeed, dis-persion of manufacturing errors generates a strong variability of the dynamic be-havior and noise radiated from geared systems (sometimes up to 10 dB [9 - 10]). A statistical study of solutions permits to have a good overview of how the solution
Camshaft Gear 84 teeth Idler Gear 73 teeth Inner Bullgear 56 teeth Outer Bullgear 72 teeth Crankshaft Gear 54 teeth
can be deteriorated when the manufacturing errors (dispersion over the optimization parameter values) and assembling errors (lead summed up and involute alignment deviations, respectively
f
H andf
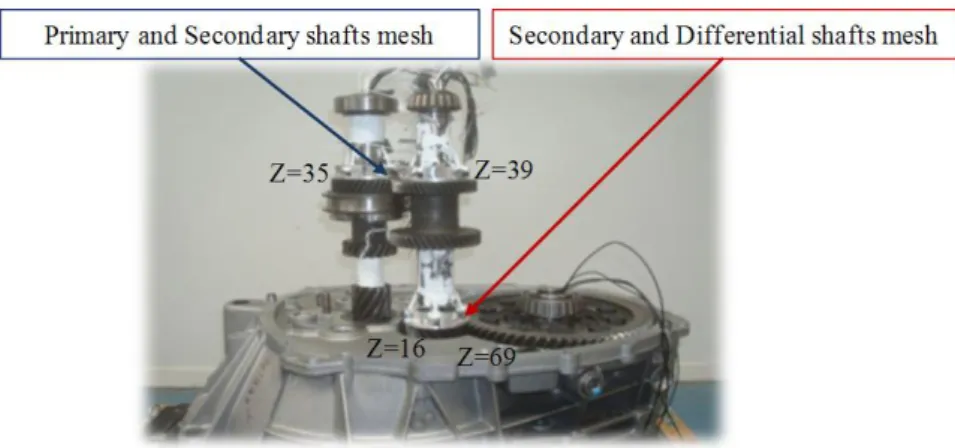
g) are considered.The dynamic response computation procedure is applied to an automotive gearbox displayed in Figure 3.
Figure 3: Studied gearbox for the dynamic response computation
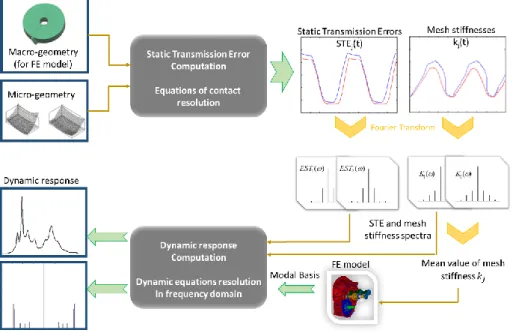
This computational scheme requires a finite element model of the complete gearbox in order to obtain its modal basis. The contact between the gears is modelled with a stiffness matrix linking the degrees of freedom of each pair of meshing gears. To achieve that, the mean value of the mesh stiffness is taken, leading to mean modal characteristics. The parametric mesh stiffness 𝑘(𝑡) isdirectly related to the applied torque T and the static transmission error 𝑆𝑇𝐸(𝑡) with:
𝑘(𝑡) =
1
𝑅
𝑏𝜕𝑇
𝜕𝑆𝑇𝐸(𝑡)
(2)The scheme uses then a powerful resolution algorithm in frequency domain to solve the dynamic equations with an iterative procedure [11 - 12]. The original spectral iterative method has been extended in order to take into account several parametric excitations [13]. In that case, there is a coupling between the excitations due to the stiffnesses fluctuations. The corresponding set of equations for 𝑚 meshes is then:
Mẍ + Cẋ + Kx + ∑ k
j(t)R
jR
Tjx
m j=1= ∑ k
jR
jSTE
j(t)
m j=1 (3)M, C, and K are respectively the global mass, damping and stiffness matrices of the system.
x the vector of the generalized coordinates of the system, ( ̇ ) stands for the time derivative.
Rj is a vector of macro-geometric coupling of the degrees of freedom of two
mesh-ing gears.
The final outputs are the housing vibration as a function of the frequency. The op-erating speeds corresponding to resonance peaks and vibration amplitudes of the housing characterize the whining noise severity. The process can be repeated for several applied torques and can be used to optimize the other gearbox components (for instance the geometry of the housing to minimize its vibration, stiffness of gear bearings…) or to test many different STE from different teeth geometry.
All the computational scheme steps are summarized in Figure 4.
2. Static transmission error computation and robust
optimization of tooth profile modifications
An optimization problem requires a correctly defined fitness function and an ap-propriate algorithm to be solved. This part describes the choices made to handle this problem considering all the difficulties. Moreover, the robustness study approach is also detailed.
Static transmission error computation
The method for STE calculation retained is classical [14-15]. Equations describ-ing contact between gears are solved for each meshdescrib-ing position, takdescrib-ing account of the elasto-static deformations and initial gaps between teeth surfaces.
Optimization fitness function establishment
The criterion retained to estimate one STE fluctuations is the peak-to-peak ampli-tude (STEpp). Considering that the modifications made have to reduce the STEpp for a given [Tmin-Tmax] torques range, the fitness function f is defined as the inte-gral of STEpp over this torques range approximated by a 3-points Gaussian quad-rature:
3 1)
(
2
1
)
(
)
(
max min i i pp i T T ppT
dT
a
STE
T
STE
T
p
f
(4)The torque distribution function p(T) is assumed uniform:
min max
1
)
(
T
T
T
p
.ai are the Gaussian weighting coefficients with the following values:
𝑎1= 𝑎3=0.5556 and 𝑎2=0.8888
Ci are the Gaussian points located in the following way:
5
3
1
2
2
5
3
1
2
min max 3 min max 2 min max 1T
T
T
T
T
T
T
T
T
For the first three-gears-cascade, the multi-objectives aspect is simply handled by considering:
3 1 ,73/56 73 / 83 , 56 / 73 / 84(
)
(
)
2
1
i i pp i pp iSTE
T
STE
T
a
f
(5)The second fitness function associated with the other meshing gears is then directly:
3 1 72 / 54 , 72 / 54(
)
2
1
i i pp iSTE
T
a
f
(6)Particle Swarm Optimization
The method is based on a stigmergic behavior of a population, being in constant communication and exchanging information about their location in a given space to determine the best location according to what is being searched. In this case, some informant particles are considered, which are located in an initial and random posi-tion in a hyper-space built according to the different optimizaposi-tion parameters. The best location researched is thus the combination of parameters which ensures the minimum value of the fitness function defined earlier. At each step and for each particle 𝑖, a new speed 𝑉𝑖(𝑡) and so a new position 𝑝𝑖(𝑡) is reevaluated considering:
- the current particle velocity 𝑉𝑖(𝑡 − 1),
- its current position 𝑝𝑖(𝑡 − 1) ,
- its best position 𝑝𝑖(𝑖𝑛𝑑.),
- the best position of neighbors 𝑝𝑔𝑙𝑜𝑏..
The algorithm working can be summarized to the system of equations (6). 𝑉𝑖(𝑡) = 𝜑0𝑉𝑖(𝑡 − 1) + 𝜑1𝐴1[𝑝𝑖(𝑖𝑛𝑑.)− 𝑝𝑖(𝑡 − 1)]
+ 𝜑2𝐴2[𝑝𝑔𝑙𝑜𝑏.− 𝑝𝑖(𝑡 − 1)]
𝑝(𝑡) = 𝑝𝑖(𝑡 − 1) + 𝑉𝑖(𝑡)
(6)
A1 and A2 are random vectors of numbers between 0 and 1 and the coefficients
𝜑𝑖 are taken following Clerc and Trelea [16 - 17] works:
𝜑0= 0.729 and 𝜑1= 𝜑2= 1.494 . Robustness statistical study
Let’s say that a solution S0 is determined by the PSO. The robustness study is
done using a Monte-Carlo simulation, i.e. 10000 others solutions are computed, chosen randomly in an hyperspace centered on the optimized solution parameters values, limited by the tolerances interval of each parameter and considering possible lead and involute alignment deviations. These 10000 results allow the establishment of the density probability function of each selected optimized solution. They also allow us to compute statistical variables such as mean value and standard deviation. For statistically independent variables, the theoretical convergence on these values is proportional to n-1/2, where n is the number of solutions computed. The industrial
should be taken uniform. The convergence has been tested and confirmed this con-vergence law. Therefore the number of samples for a Monte-Carlo simulation has been set to 10000 ensuring an error less than 1%.
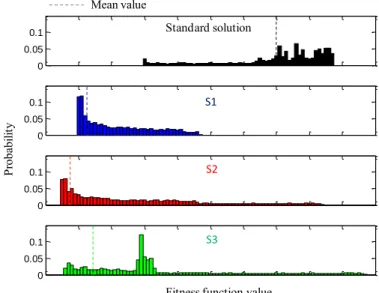
Figure 5 shows an example of probability density functions for different possible solutions. It illustrates how the optimized solution is selected. The solution S2 has a smaller mean value, but it is associated to a larger dispersion. The solution S1 appears to be the best compromise between the mean value and the deterioration capability of the solution.
Figure 5: Probability density functions for the standard solution and three selected optimized solutions for the three-gears-cascade
Results – Expected static transmission errors and actual ones
After considering the STEpp and its robustness, optimized solutions have been
retained for the first three-gears-cascade and for the second two-gears mesh. The evolution of the STEpp is calculated as a function of the applied torque for the
stand-ard and the optimized sets of gears. Some measurements have been done to deter-mine the actual teeth topologies, allowing the confrontation of the recommendations made and the tooth modifications obtained. This permits to underline the robustness study pertinence, especially in this study where the (confidential) tolerance intervals are of the same order of magnitude as the tooth modifications themselves.
Theoretical versus actual tooth topologies
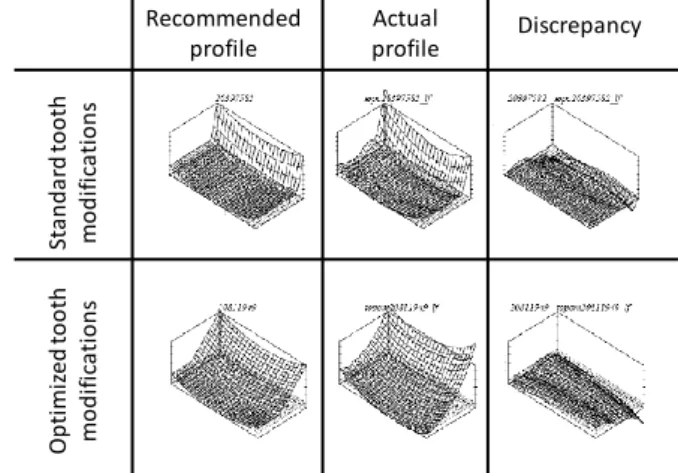
The topology measurements permit to compare the recommended tooth modifi-cations to the actual performed ones, for both standard (corrected but not optimized) and optimized tooth modifications. The whole data are presented in Figure 6 for the
0 1 2 3 4 5 6 7 8 9 10 0 0.05 0.1 0 1 2 3 4 5 6 7 8 9 10 0 0.05 0.1 0 1 2 3 4 5 6 7 8 9 10 0 0.05 0.1 0 1 2 3 4 5 6 7 8 9 10 0 0.05 0.1 fonction coût [µm] p (f ) Référence S1 S2 S3 Standard solution P roba bi lit y
Fitness function value Mean value
crankshaft gear. Figure 7 displays only the discrepancies between theoretical and actual tooth surfaces for the all the studied gear. The results plotted are the mean value of all teeth topologies for a given gear. The analysis of these topologies leads to the following observations:
- There are relatively important discrepancies between theoretical and actual teeth topologies.
- The largest discrepancies correspond to the idler and bull inner gears for optimized solutions.
- There are manufacturing errors which cannot easily be translated in terms of tip relieves and crowning.
Figure 6: Comparisons of theoretical and actual teeth mean topologies of the crank-shaft gear for standard and optimized solutions
Figure 7: Comparisons of theoretical and actual teeth mean topologies of the stud-ied gears for standard and optimized solutions
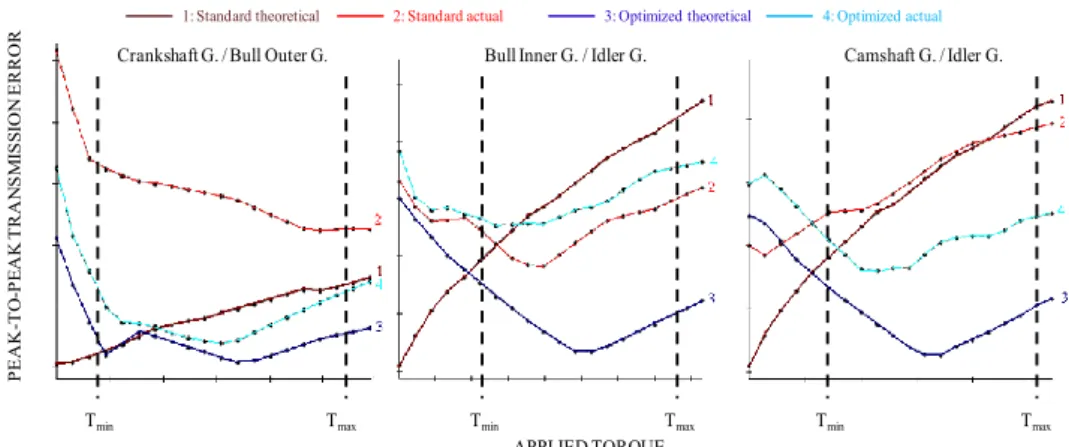
Figure 8 displays the peak-to-peak transmission errors for the three considered meshes. Two results are particularly relevant. The deterioration of theoretical con-figuration is coherent with the discrepancies presented in Figure 7: the Idler Gear / Bull Inner Gear mesh for the optimized tooth modifications is the mesh with the
Crankshaft gear tooth flank topology Recommended profile Actual profile Discrepancy Sta n d a rd to o th m o d if ic a ti o n s O p ti m iz ed to o th m o d if ic ati o n s Standard tooth modifications Optimized tooth modifications Crankshaft G. Z=54 Idler G. Z=73 Bull Inner G. Z=56 Bull Outer G. Z=72 Camshaft G. Z=84
largest discrepancies. Indeed the corresponding STEpp is worse than the standard
actual STEpp. For the other meshes, the curve indexed 2 and 4 shall be compared.
The robust optimization done is thus efficient as the STEpp is lower for optimized
solutions for the whole torque range.
Figure 8: Comparisons of theoretical and actual STEpp as a function of the applied
torque for the three meshes
Acoustic benefits of the optimization
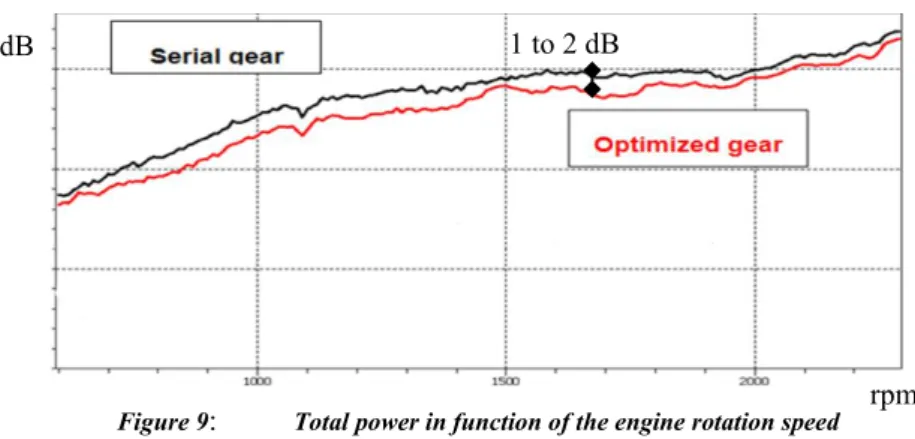
Both standard and optimized gears sets have been mounted on a thermal engine and the corresponding radiated noise has been measured. Results are plotted in Fig-ure 8. The benefit is less than expected but the operating torque in a little bit higher than Tmax and the complete timing system had to be considered (e.g. the oil pump
pinion is necessary for the engine oil supply). Nevertheless, the measurements show at least 1 dB of total power reduction, which is satisfying given that the levels (con-fidential) are initially not high, that only 5 among 10 pinions have been optimized and that all the other acoustic sources are present during the measurements. It is worth underlying that only the pinions have changed between the two different tests who gave the results of Figure 9 and that on some partial sound power measure-ments the gain was up to 4 dB. The satisfactory benefit of the optimization have led to making those optimized corrections as the new standard ones for Renault Trucks.
P E A K -TO -P E A K T R A N S M IS S IO N E R R O R
Crankshaft G. / Bull Outer G.
APPLIED TORQUE
Camshaft G. / Idler G.
Tmin Tmax Tmin Tmax Tmin Tmax
1: Standard theoretical 2: Standard actual 3: Optimized theoretical 4: Optimized actual
Figure 9: Total power in function of the engine rotation speed
3. Dynamic response computational scheme validation
The computation scheme has been validated step by step by comparison with extensive and complex measurements on a modified but representative automotive gearbox as presented in Figure 10.
Four quantities have been measured: the static transmission error fluctuation, the dynamic transmission error, housing vibration and whining noise. Accelerometers, microphones and optical encoders are used for that purpose. In this paper, the results are mainly focused on the housing vibration.
The measurements were performed at RENAULT’s workshop in Lardy in France, on the BACY acyclism test bench. An electrical motor drives the gearbox, while a braking torque simulates the reaction of the wheels. The rotation speed and the torque are also measured.
Figure 10: Step by step validation of the computation scheme. Intermediate quantities such as transmission errors, as well as housing dynamic vibration and noise response are compared.
rpm
The tuning of the assembled gearbox has not been done ideally because the ex-perimental modal analysis was not possible on the BACY test bench when a static torque is applied. Preloads effect on mesh and bearings stiffness’s are thus not taken into account and even if they may not be negligible [18].
Results from a former experimental modal analysis performed by Vibratec have instead been used. Measurements have been done with a static torque applied but the clamping conditions of the gearbox are different from the ones in the test bench BACY on which the vibration measurements have been done.
As some parts of the gearbox can show non negligible discrepancies over some frequency range, the final assembly is not completely able to describe accurately the dynamic behavior of the measured gearbox. But the results obtained are precise enough to validate the computational scheme.
Figure 11 displays the comparison between measured and computed transmis-sion errors. The mean value cannot be obtained by measurements, but the fluctua-tions, which are the most important data, can be compared. The peak-to-peak am-plitude is correctly estimated. The measurement of the transmission error is particularly complicated. The dispersion due to manufacturing errors and assem-bling errors can be large. Moreover, the micro-geometry should be accurately meas-ured tooth by tooth in order to have real tooth topologies. The agreement between measurements and computations is really satisfying.
Figure 11: Measured (left) and computed (right) static error transmission. Peak-to-peak values are compared for the validation (both scales are the same)
The Figure 12 shows a comparison of the housing vibration (dynamic accelera-tion) as function of the operating speed. The comparison is based on predominance of orders and modes, in terms of frequency and amplitude. The dominant orders and the frequency ranges exhibiting a dynamic amplification correctly determined.
Figure 12: Comparison of measured (left) and simulated (right) housing vibration as a function of the operating speed. The analysis highlights the principal orders and the
pre-dominant frequencies.
An order tracking has also been done in order to compare properly the vibration measurements with the computations.
The first and second orders of the two meshes have been considered (the first mesh corresponds to Z1/Z2=35/39. The second mesh corresponds to Z3/Z4=16/69 as specified in Figure 3). The acceleration of one housing point for the second order of the second mesh is displayed in Figure 13.
Meshing frequency [Hz]
Figure 13: Tracking of the second order of the second mesh. Dynamic response of a housing point in the normal direction. Red solid: measurements. Purple dashed: simulations.
The dynamic model has been tuned in different operating conditions explaining some non-negligible frequency shifts and modal response differences. However the
Gear order (Z*frotation) + harmonics
0.00 Hz 3500.00 REF_BV:+X (CH27) 0.00 3100.00 r p m T _ p r im a ir e ( T 1 ) -30.00 12.00 dB (m /s 2) 2/H z Frequency (Hz) M o to r re g im e ( rp m ) Frequency (Hz) Predominant modes 0 200 400 600 800 1000 1200 1400 1600 1800 -40 -30 -20 -10 0 10 20 30 A m p li tu d e (m /s 2) ,ordre 35 0 500 1000 1500 2000 2500 3000 3500 4000 -40 -30 -20 -10 0 10 20 30 ,ordre 35*2 100 200 300 400 500 600 700 800 -40 -30 -20 -10 0 10 20 30 A m p li tu d e [ d B ] (r e f: 1 m /s ²) Frequency (Hz) DIFF9Y ,ordre 69 0 200 400 600 800 1000 1200 1400 -35 -30 -25 -20 -15 -10 -5 0 5 10 Frequency (Hz) Calcul Mesures
agreement between the measurements and the computations remains satisfying for a predicting tool.
On the contrary to the measurements, the simulation can take into account the variability of the results. Extracted from teeth metrology, a dispersion study has been performed to determine the envelope of the dynamic response. As the teeth micro-geometric dispersion doesn’t follow a Gaussian law, the gear defects reparti-tion over the tolerance range has been considered uniform, which is a rather a pes-simistic situation. It is well known that the dispersion due to manufacturing and assembling errors can lead strong variability of the dynamic behavior and noise ra-diated for geared systems. A hundred of excitations have thus been computed and the corresponding responses are plotted in Figure 14 for both meshes and for the two first orders. Discrepancies can be observed due to a bad modal behavior repre-sentation at some frequencies. Nevertheless, the order of magnitude of the response is in a good agreement with the measurements. The dispersion for the first mesh is much higher than for the second mesh, and second orders are more sensitive to the dispersion than the first orders.
Figure 14: Quadratic mean value over 10 housing points order by order and mesh by mesh. Comparison between measurements and 100 dynamic responses generated randomly
according the gear defects dispersion.
0 500 1000 1500 2000 -40 -20 0 20 A m p lit u d e [ d B ] (r e f. 1 m /s ²) Ordre 1 (Primaire) 0 1000 2000 3000 4000 -40 -20 0 20 Ordre 2 (Primaire) 0 200 400 600 800 -40 -20 0 20 A m p lit u d e [ d B ] (r e f. 1 m /s ²) Fréquence excitatrice [Hz] Ordre 1 (Pont) 0 500 1000 1500 -40 -20 0 20 Fréquence excitatrice [Hz] Ordre 2 (Pont) Calcul Mesures 1st mesh, 1st order Frequency [Hz] 1st mesh, 2nd order
2nd mesh, 1st order 2nd mesh, 2nd order
Frequency [Hz]
Mean excitation Measurements 100 excitations
One of the main industrial concerns is to build a source noise hierarchy to deter-minate for instance which housing point has the highest vibration level, and which order is dominating.
Figure 15 displays the RMS value of the acceleration of some strategically cho-sen points on the housing, for both simulation and measurements. Considering these results, the computations and the measurements indicate the point n°2 is the less vibrating, and should therefore be used as an attachment point for to the rest of the structure. Once again, the frequency shifts due to a model tuning in different oper-ating conditions introduce some level discrepancies, but the hierarchy between the different points remains suitable as a predictive analysis tool.
Figure 15: RMS value of the acceleration of some housing points. Left: simulations. Right: measurements.
Conclusion
This paper presents a complete approach for whining noise prediction and mini-mization. First, an accurate procedure for computing static transmission error is used. That has been validated over more than 20 cases. The procedure takes into account multi-mesh gear systems and deals with a torque ranges efficiently. The robustness study is the major contribution, as it is crucial to consider the man-ufacturing tolerances to find the optimized solution which ensure the best gain. The measurements made on the optimized gears are very encouraging because they lead to a total power diminution of at least 1 dB, even if only 5 among 10 pinions have been optimized. It’s worth remembering that all the others acoustic sources were present (thermal engine, accessories…).
500 1000 1500 2000 2500 -20 -15 -10 -5 0 5 10 15 20
Engine rotation speed [rpm]
A c c e le ra ti o n R M S v a lu e [ d B ] (r e f. 1 m /s ²) Computations 500 1000 1500 2000 2500 -20 -15 -10 -5 0 5 10 15 20
Engine rotation speed [rpm]
A c c e le ra ti o n R M S v a lu e [ d B ] (r e f. 1 m /s ²) Measurements Point n°1 Point n°2 Point n°3 Point n°4 Point n°1 Point n°2 Point n°3 Point n°4
The benefit exhibited in the end is satisfying enough to decide to make the opti-mized corrections the new standard ones for the next Renault Trucks’ timing gear cascade.
The dynamic response of a geared system is computed using a spectral iterative scheme, which leads to computation times low enough to permit parametric or dis-persion studies. A complete method is proposed to predict whining noise severity, accounting for the scattering of the manufacturing data. The scheme is globally val-idated and can be used to optimize the current studied gearbox. The computations provide a good estimation of the vibratory response amplitude. They allow identi-fying the key parameters in order to minimize the whining noise for given function-ing configurations, the predominant orders, the critical operatfunction-ing speeds and the ac-curate hierarchy of these important data. A particular effort should be done to ensure a good numerical model tuning for the prediction remains satisfactory.
Acknowledgement
This work was supported by the french National Research Agency through the re-search project MABCA (ANR 08-VTT_07-02). The partners involved were VIBRATEC, LTDS-Ecole Centrale de Lyon, RENAULT and RENAULT TRUCKS. The authors want to thank especially J. Vialonga from Renault technical center of Lardy (France) and D. Barday from Renault Trucks for their scientific and technical supports and for the shared data.
The french National Research Agency has also supported through the joint labora-tory LADAGE (ANR-14-Lab6-003) issued from the collaboration between LTDS-Ecole Centrale de Lyon and VIBRATEC
References
[1] L.S. Harris, 1958, Dynamic loads on the teeth of spur gears. Proceedings of the Institution of Mechanical Engineers. 172, pp. 87-112.
[2] D. Remond, P. Velex, J. Sabot, et al., “ Comportement dynamique et acoustique des transmissions par engrenages”, Synthèse bibliographique. 1993.
[3] D.B. Welbourn, 1979 Fundamental knowledge of gear noise - A survey. Pro-ceedings of conf. on Noise and Vibrations of Engines and Transmissions.
C177/79, pp. 9-29.
[4] M.S.Tavavoli, and al. 1986, Optimum profile modifications for the minimiza-tion of static trans- mission errors of spur gears. Journal of Mechanisms Trans-missions and Automation in Design. 108, pp. 86-95.
[5] M. Beghini, and al. 2004 A method to define profile modification of spur gear and minimize the transmission error. Proceedings AGMA Fall Meeting.
[6] G. Bonori, M. Barbieri, F. Pellicano, 2008 Optimum profile modifications of spur gears by means of genetic algorithms. Journal of Sound and Vibration.
313, no. 3-5 pp. 603-616.
[7] A. Carbonelli, and al. “Particle swarm optimization as an efficient computa-tional method in order to minimize vibrations of multi-mesh gears transmis-sion”. 2011 Advances in Acoustics and Vibration, 2011.
[8] R.C Eberhart, J. Kennedy, 1995 A new optimizer using particle swarm theory. Proc. Sixth Intl. Symp. on Micro Machine and Human Science, IEEE Service Center, Piscataway, NJ. pp. 39-43.
[9] T. Nonaka, A. Kubo, S. Kato, T. Ohmori, “Silent gear design for mass produced gears with scratters in tooth accuracy”, ASME Proceedings of the International
Power Transmission and Gearing Conference, Scottdale, USA, Vol. 2, pp. 589-595, 1992.
[10] N. Driot, E. Rigaud, J. Sabot, J. Perret-Liaudet, “Allocation of gear tolerances to minimize gearbox noise variability”, Acustica united with Acta Acustica; Vol.87, 67-76, 2001
[11] J. Perret-Liaudet, “Etude des Mécanismes de Transfert entre l’Erreur de Trans-mission et la Réponse Dynamique des Boîtes de Vitesses Automobiles”, Thèse
de doctorat de l'Ecole Centrale de Lyon N°9207,” 1992.
[12] J. Perret-Liaudet, “An original method for computing the response of a para-metrically excitated forced system,” Journal of Sound and Vibration, vol. 196,
pp. 165-177, 1996.
[13] A. Carbonelli, “Caractérisation vibro-acoustique d’un cascade de distribution poids lourd”, Thèse de doctorat de l'Ecole Centrale de Lyon N°2012-34”, 2008. [14] E. Rigaud, D. Barday, 1998 Modeling and analysis of static transmission error of gears: effect of wheel body deformation and interactions between adjacent loaded teeth. Mécanique Industrielle et Matériaux. Vol. 51 Issue 2, pp. 58-60. [15] E. Rigaud, D. Barday, “Modelling and analysis of static transmission error. Ef-fect of wheel body deformation and interactions between adjacent loaded teeth”, 4th World Congress on Gearing and Power Transmission, Paris, Vol.3, 1961-1972, 1999.
[16] I.C. Trelea, “The particle swarm optimization algorithm: convergence analysis and parameter selection.” 2003, Information Processing Letters 85. no. 6, pp. 317-325.
[17] M. Clerc, “The swarm and the queen: towards a deterministic and adaptive par-ticle swarm optimization”. Proc. ICEC, 1999; Washington, DC. pp. 1951-1957. [18] M. Åkerblom, U. Sellgren, “Gearbox noise and vibration − influence of bearing
preload”, MWL, Department of Vehicle Engineering, KTH, SE–100 44 Stock-holm urn University, Auburn, Alabama 36849, USA.