HAL Id: hal-00533062
https://hal-brgm.archives-ouvertes.fr/hal-00533062
Submitted on 5 Nov 2010
HAL is a multi-disciplinary open access archive for the deposit and dissemination of sci-entific research documents, whether they are pub-lished or not. The documents may come from teaching and research institutions in France or abroad, or from public or private research centers.
L’archive ouverte pluridisciplinaire HAL, est destinée au dépôt et à la diffusion de documents scientifiques de niveau recherche, publiés ou non, émanant des établissements d’enseignement et de recherche français ou étrangers, des laboratoires publics ou privés.
Coupled large scale hydromechanical modelling for
caprock failure risk assessment of CO2 storage in deep
saline aquifers
Jeremy Rohmer, Darius Seyedi
To cite this version:
Jeremy Rohmer, Darius Seyedi. Coupled large scale hydromechanical modelling for caprock failure risk assessment of CO2 storage in deep saline aquifers. Oil & Gas Science and Technology - Revue d’IFP Energies nouvelles, Institut Français du Pétrole, 2010, 65 (3), pp.503-517. �10.2516/ogst/2009049�. �hal-00533062�
Coupled large scale hydromechanical modelling for
caprock failure risk assessment of CO
2storage in deep
saline aquifers
Analyse hydromécanique à grande échelle pour l’évaluation
du risque de fracturation de la couverture de stockage du
CO
2dans les aquifères profonds
Jeremy Rohmer1*, Darius M. Seyedi1
1
BRGM, Natural Risks and CO2 Storage Safety Division, 3, av. Claude Guillemin BP 36009, 45 060 Orléans
Cedex 2
e-mail: j.rohmer@brgm.fr, d.seyedi@brgm.fr
Résumé
Cet article présente une méthodologie de simulation hydromécanique à grande échelle pour évaluer le risque de fracturation des formations de couverture dans le contexte de stockage géologique de CO2 dans les aquifères profonds. Cette stratégie est basée sur le développement d‘un couplage externe entre un code de transport multiphasique (TOUGH2) et un code de calcul hydromécanique (Code_Aster). L‘outil développé nous permet de réaliser des simulations hydromécaniques couplées à l‘échelle régionale (étendue de 100 km). Différents mécanismes de dégradation mécanique de la couverture peuvent être vérifiés à l‘issu de ces simulations. Une stratégie par scénarios est également proposée afin de tenir compte de l‘influence des incertitudes des paramètres du modèle sur le risque de fracturation. Le cas de la couverture de l‘aquifère profond du Dogger dans le contexte du bassin de Paris est traité comme un exemple d‘application. La simulation est réalisée à grande échelle pour une injection de CO2 à un débit industriel (10 Mt/an). L‘estimation de l‘état des contraintes après 10 ans d‘injection est réalisée par le couplage séquentiel TOUGH2/Code_Aster. Deux modes de fracturation sont évalués, à savoir la création de fractures par traction et la réactivation par cisaillement de fractures pré-existantes. Un premier scénario de référence est défini en affectant aux différentes couches leurs propriétés moyennes. Une étude de sensibilité montre l‘importance de la définition de l‘état initial des contraintes et des propriétés hydrauliques du réservoir sur les modes de ruptures de la couverture. Sur cette base, un deuxième scénario est défini pour lequel les paramètres les plus sensibles sont pris dans leur configuration la plus « défavorable ». Aucun critère de rupture n‘est atteint pour les conditions de calcul considérées. Par ailleurs, l‘étude réalisée permet de mettre en avant trois aspects pour la gestion du risque : la pression maximale est atteinte rapidement après quelques années d‘injection, l‘extension latérale de la zone perturbée en pression est importante (> 50 km) et la zone la plus critique est celle « proche puits » (distance < 100 m) à l‘interface entre la couverture et le réservoir.
Abstract
This work presents a numerical strategy of large scale hydromechanical simulations to assess the risk of damage in caprock formations during a CO2 injection process. The proposed methodology is based on the development of a sequential coupling between a multiphase fluid flow (TOUGH2) and a hydromechanical calculation code (Code_Aster) that enables us to
perform coupled hydromechanical simulation at a regional scale. The likelihood of different caprock damage mechanisms can then be evaluated based on the results of the coupled simulations. A scenario based approach is then proposed to take into account the effect of the uncertainty of model parameters on damage likelihood. The developed methodology is applied for the caprock failure analysis of deep aquifer of the Dogger formation in the context of the Paris basin multilayered geological system as a demonstration example. The simulation is carried out at a regional scale (100 km) considering an industrial mass injection rate of CO2 of 10 Mt/y. The assessment of the stress state after 10 years of injection is conducted through the developed sequential coupling. Two failure mechanisms have been taken into account, namely the tensile fracturing and the shear slip reactivation of pre-existing fractures. To deal with the large uncertainties due to sparse data on the layer formations, a scenario-based strategy is undertaken. It consists in defining a first reference modelling scenario considering the mean values of the hydromechanical properties for each layer. A sensitivity analysis is then carried out and shows the importance of both the initial stress state and the reservoir hydraulic properties on the caprock failure tendency. On this basis, a second scenario denoted ―critical‖ is defined so that the most influential model parameters are taken in their worst configuration. None of these failure criteria is activated for the considered conditions. At a phenomenological level, this study points out three key aspects for risk management. The maximum overpressure is reached rapidly after a couple of years, the lateral extension of the ―overpressurized‖ zone induced by the injection is very large (> 50 km) and the most critical zone is the injection near zone (distance < 100 m) at the interface between the caprock and the reservoir layer.
Introduction
The gas injection modifies the reservoir pressure, and the effective stress field in the reservoir and caprock formations. The most important process in hydromechanical behaviour is a general reduction of effective stresses (soil mechanics convention), caused by the high-pressure injection of CO2 around the injection well.
Rutqvist and Tsang, (2002) showed, through a coupled hydromechanical simulation of CO2 injection into a reservoir capped by a single caprock unit, that the maximum overpressure that can be sustained is strongly dependent on the in situ stress state, including the difference in magnitude of the maximum and minimum principal stresses. In an extensional stress regime (h = 0.7v), reactivation of steeply dipping fractures is most likely to occur, whereas in a compressional stress regime (h = 1.5v), reactivation of shallowly dipping fractures is most likely, but at a higher injection pressure. Rutqvist and co-workers (2008) extended the simulation to a multilayered site through a two-dimensional plane-strain model and concluded that it is essential to have an accurate estimate of the three-dimensional in situ stress field to support the design and performance assessment of a geological CO2-injection operation. Soltanzdeh and Hawkes (2008a, 2008b) investigated the stress change and fault reactivation tendency within and surrounding reservoirs during fluid injection. Induced stress analysis is performed using Eshelby‘s theory of inclusions for a poroelastic material, and the concept of Coulomb failure stress change is implemented as a criterion for fault reactivation tendency. Their results demonstrate that, during fluid injection into a reservoir in an extensional stress regime, only faults located in rocks overlying and underlying the reservoir tend towards reactivation. In a compressional stress regime, fault reactivation is likely to occur within the reservoir.
In a more recent work, Vidal-Gilbert and co-workers (2009) presented a study on 3D geomechanical modelling for CO2 geologic storage into an oil field reservoir in the Paris Basin. In this work, the geomechanical analysis of the reservoir–caprock system was carried out as a feasibility study so that pressures resulting from reservoir simulations were
integrated as input for a geomechanical model in a ‗‗one way‘‘ coupling strategy. Their results show that the mechanical effects of CO2 injection do not affect the mechanical stability of the reservoir–caprock system for the studied injection scenario and the considered assumptions.
From a practical point of view, the safety study of a storage site consists, among others, in the evaluation of the sustainable injection pressure or flux, and the safety factor for a given injection rate. The objective of the present study is to provide a methodological framework and the necessary numerical tools that can be used to investigate the effects of CO2 injection in deep geological formations on its mechanical response, with a particular attention paid to the risk of mechanical damage in the caprock using coupled large scale hydromechanical simulations. In this view, a large-scale hydromechanical simulator is developed to calculate the effective stress change in the storage complex due to injection process. This simulator is based on the sequential coupling of two existing well-established codes. Two main failure mechanisms are considered, namely tensile fracturing and shear slip reactivation of cohesionless pre-existing fractures. Note that large faulted areas have not been directly addressed. However, the developed simulator can be used to obtain effective stress change around an existing fault. The fault stability can then be examined by specific fault models. The developed procedure is applied to a representative potential site in the Dogger aquifer of the Paris Basin (Brosse et al., 2007 and Grataloup et al., 2009) to illustrate all the steps. A vertical injection well is considered. The three-dimensional effects are taken into account through an axisymmetric model that enables us to have a more realistic representation of the injection operation comparing to a 2D model. A complete hydromechanical model is considered for the whole site (reservoir, caprock, underburden and overburden). A large scale finite element model based on the geological structure of the Paris basin is constructed. The developed hydromechanical simulator is used to model the hydromechanical impact of CO2 injection on the effective stress field in the reservoir and its surrounding rocks. The risk of caprock damage is then studied for CO2 injection at a regional scale in the context of the Paris basin case. A scenario based approach is proposed using a sensitivity analysis to take into account the effect of the uncertainty of model parameters on damage possibility. This study will provide a basic understanding of the large-scale flow, pressure and mechanical changes in response to industrial-scale CO2 injection into a laterally open saline aquifer, and will help us to underline key aspects, that should be considered for site specific risk assessment analysis of potential storage sites. Note, however, that the example application is conducted to illustrate all steps of the proposed approach and the capacity of the developed tools. Some input parameters are thus chosen from literature or similar sites and the results must be considered only in a qualitative manner.
1.
Large scale hydromechanical simulator for modelling local stress field
modification
Coupled thermo–hydro–mechanical (THM) processes under multiphase flow conditions play an important role in a number of underground applications such as nuclear waste disposal in geological media, geothermal energy extraction, enhanced recovery from oil and gas reservoirs, and underground storage of gas (e.g. Rutqvist et al., 2002). Numerical modelling of CO2 injection integrity and performance must also consider coupling of geochemistry, geomechanics, fluid and heat flow, and transport. Therefore, a coupled thermo–hydro– mechanical-chemical (THMC) simulator is ideally required for analysis of these problems. However, there is (to the authors‘ knowledge) no single computer code that performs large-scale coupled THMC analysis in geological media.
In the present article, we will limit our investigation to hydromechanical effects of CO2 injection on the stress field in isothermal conditions. The effects of chemical reactions
between injected CO2 and geological formations are not covered by the present study. Two existing well-established codes, each specialized to a few of the above processes, are coupled to potentially cover all processes, which are important to the hydromechanical response of CO2 injection.
TOUGH2 (Pruess, 1999), a THC code, and Code_Aster (EDF, 2008), a general thermo-hydromechanical code, are linked using sequential execution and data transfer. The TOUGH2 code solves coupled problems of multiphase, multicomponent fluid flow in geological system. A sequential coupling between TOUGH2 and FLAC3D (from Itasca) is already used by (Rutqvist et al., 2002) for modelling hydromechanical aspects related to geological storage of CO2.
Code_Aster is a general purpose thermo-mechanical finite element code developed by EDF and can also handle coupled thermo-hydromechanical coupling in porous media. However, the gas phase is limited to perfect gases and CO2 in supercritical state can not be modelled by THM modulus of Code_Aster. A fully coupled HM code can obtain more accurate results but such simulations are always very computer time consuming. A sequential coupling of two codes can enable us to perform large scale simulations in a reasonable time.
The developed coupled large scale hydromechanical simulator can take into account the effect of the mechanical behaviour on the hydraulic properties of the media. Furthermore, it allows us to perform coupled hydromechanical analysis on much larger models comparing to 3D simulators through axisymmetric modelling. This aspect is necessary for accurate simulation of injection process in open deep aquifers and allows the correct definition of boundary conditions. Moreover, hydromechanical coupling are considered in the whole model and not only in the reservoir and its adjacent layers.
1.1. Sequential coupling of TOUGH2 and Code_Aster
1.1.1. TOUGH2
TOUGH2 (Pruess, 1999) is a well-established code for geohydrological analysis with multiphase, multicomponent fluid flow and heat transport. The numerical method for fluid flow simulations is based on the integral finite difference method for space discretization (Narasimhan and Witherspoon, 1976). An implicit time-weighting scheme is used for the flow and transport equations. The multiphase fluid-flow simulation was conducted with the fluid property module ECO2N (Pruess, 2005), which contains a comprehensive description of the thermodynamic and thermophysical properties of water–NaCl–CO2 mixtures needed for analysis of CO2 storage in brine saturated formations.
1.1.2. Code_Aster
The Code_Aster is a finite element thermo-hydromechanical calculation code. The mechanical analysis was conducted with the THM module (e.g. Chavant et al., 2002), which is designed in particular for fully saturated rock and soil mechanics with thermomechanical and hydromechanical interactions.
1.1.3. Coupling of TOUGH2 and Code_Aster
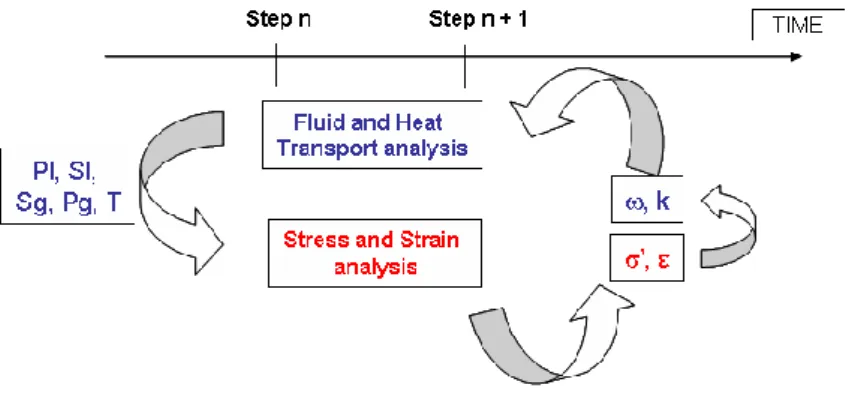
TOUGH2 and Code_Aster are linked using sequential execution and data transfer through nonlinear coupling functions. Figure 1 gives a schematic view of the sequential coupling. At the step n, the total pore pressure P in the whole geological medium is calculated from liquid pressure Pl, liquid saturation Sl, gas pressure Pg and gas saturation Sg:
g l l lP S P S P (1 ) (1)
The total pressure is then transferred to the mechanical code which gives the effect on the effective stress components ‘ and the strain ε through the theory of fully saturated porous media (see equation 3). These results are used to assess the changes in hydraulic properties (porosity and permeability k) through empirical non linear functions. A commonly used coupling relationship corresponds to the decreasing power law introduced for example by David and co-workers (2001) and reads as follows:
m m k k 0 0 0 0 (2)
where {0 , k0} and { , k} correspond respectively to the initial and the final hydraulic properties, is the porosity change due to volumetric strain and m is the porosity sensitivity exponent, which can span a large spectrum of values, between 1 and 25. The higher values correspond in general to rocks with high porosity.
Modified hydraulic properties are then used as input parameters for step n+1. One can notice that the thermo- mechanical coupling can be implemented following the same principle.
[Figure 1 about here]
2.
Caprock failure tendency assessment
Many laboratory experiments have shown that the pore-pressure P has different effects on deformation and failure of the fluid fully or partially saturated porous solid (e.g. Terzaghi, 1943, Skempton, 1961, Coussy, 1995). Both theoretical and experimental studies have shown that failure is controlled by the effective stress ‘, which can be defined as follows (e.g. Biot, 1941). ij ij ij bP ' (3)
where is the Kronecker symbol (ij=0 if ij and ij=1 otherwise), b the Biot‘s coefficient and
the total stress.
Various authors (e.g. Streit and Hillis, 2004 ; Rutqvist et al., 2007, Seyedi et al., 2009, Vidal-Gilbert et al., 2009) have shown a general reduction of the effective stress due to gas injection. Such changes might lead to caprock failure and thus to the creation of potential flow paths for the CO2 to migrate towards the surface i.e. to a tremendous diminution of caprock integrity. Two main mechanical failure mechanisms might occur during CO2 injection:
1. Tensile fracturing
2. Shear slip of pre-existing fractures.
The occurrence of each mechanism strongly depends on the effective initial stress state and its evolution due to gas injection. The maximum sustainable injection pressure must be chosen as to prevent both caprock failure mechanisms. It is worth noting that the hydromechanical behaviour of faults is not directly addressed in the present study. However, as a first order assumption, the fault stability can be also checked by the second criterion. A safety factor can be added to define the injection pressure based on the maximum sustainable injection pressure as a design parameter for the storage site (e.g. Rutqvist et al., 2007).
2.1. Tensile fracturing
The potential for tensile failure is usually investigated under the assumption that a tensile fracture could develop when the minimum effective stress ‘3 becomes negative (soil
mechanics convention) and its absolute magnitude exceeds the rock matrix tensile strength (denoted T). The tensile failure criterion is defined as follows.
0 3 ' T (4)
In a risk management study, the rock matrix tensile strength is usually assumed to be null (as a conservative assumption).
2.2. Shear slip of pre-existing fractures
The potential for shear slip along pre-existing fractures is investigated under the conservative assumption that a fracture could exist at any point of the studied zone with an arbitrary orientation following the approach introduced in (Rutqvist et al., 2007). For such a case, the shear slip failure criterion (i.e. Mohr Coulomb criterion, e.g. Morris et al., 1996) can be written in terms of the fracture internal friction angle ‘ and of the fracture cohesion c‘. In a Mohr diagram, this criterion is represented by a line (see Figure 2 B).
' ) ' tan( 'n c (5)
The cohesion of fractures is always small and can be neglected in a risk assessment study. The shear stress is the stress component, which acts along the fracture plane (see Figure 2 A). It is written using the principal stress components as follows:
) 2 sin( ) ( 5 . 0 13 (6)
where θ is the angle of the fault plane with the maximum principal stress direction. The normal effective stress ‘n is the stress component, which acts normal to the fracture plane (see Figure 1 A). It is written using the effective stress components as follows:
) 2 cos( ) ( 5 . 0 ) ( 5 . 0 1' 3' 1' '3 ' n (7)
[Figure 2 about here]
The shear fracture failure mechanism can be illustrated in the Mohr diagram (Figure 2 B). Assuming a homogeneous increase of the pore pressure in the rock sample, the effective stress components are reduced, implying a translation of the Mohr circle by a magnitude corresponding to the overpressure P. This might lead to the reactivation of the fracture (dashed Mohr circle, Figure 2 B). It is worth noting that shear fracturing of intact rock is not explicitly considered.
3.
Application to Paris basin case
3.1. General description
The Paris basin is a multilayered system, which consists of several layers of permeable brine-water formations (denoted ―aquifers‖). Based on the geological model constructed in the PICOREF project (Brosse et al., 2007 and Grataloup et al., 2009), a total number of five aquifer layers have been taken into account, namely (from the soil surface): the chalk aquifer of the Upper Cretaceous geological unit, the sandstone aquifer of the Albian geological unit, the carbonate aquifer of the Lower Cretaceous geological unit, the carbonate aquifer of the Oxfordian and Kimmeridgian geological units and the targeted carbonate aquifer of the
Dogger geological unit. The tertiary formations have not been taken into account. Clay and shale layers of low permeability interlace these formations (denoted ―aquitard‖).
The objective is to study the mechanical behaviour of the interface between the Dogger reservoir and its caprock layer (i.e. the Callovian and Oxfordian formation). Table 1 summarizes these assumptions. The depth and thickness values are based on the mean values, which can be found in the Paris basin (Grataloup et al., 2009). See Figure 3 for a schematic view of the model.
[Table 1 about here] [Figure 3 about here]
3.2. Geometry, boundary and initial conditions
An axisymmetric model is used to take into account three dimensional aspects of the injection from a vertical well. The use of axisymmetric model enables us to consider a very large lateral extension allowing an accurate representation of hydraulic boundary conditions. The used model extends vertically from the ground surface to a depth of 2250 m, and horizontally around 100 km to simulate laterally infinite conditions. The injection wellbore represents the symmetry axis (see Figure 3). A refinement of the mesh has been introduced in the injection zone with a minimum mesh cell of 50 cm. At the bottom and lateral boundaries, flow and normal displacements are fixed.
Temperature and pressure initial condition have been chosen after Rojas et al. (1989) so that the temperature gradient is 0.041 °C/m and the hydraulic pressure gradient is 0.09924 bar/m. At the caprock – Dogger formation interface at 1550 m depth, the temperature reaches around 65°C for an initial pore pressure of 166 bars. Salinity in the Dogger reservoir ranges from moderate (5 g of NaCl per 1000 g of water in the Southern part of the basin) to high values (35 g of NaCl per 1000 g of water in the Southern part of the basin).
The ratio between the initial horizontal and vertical stress is evaluated in the Geocarbone – Integrity project (Fleury, 2007) based on the deep boreholes studies in the Paris Basin. This parameter ranges from 60 to 80 %, which is in good agreement with the study of Cornet and Burlet (1992).
3.3. Hydraulic and multiphase transport properties
3.3.1. Relative permeability and capillary pressure model
Multiphase transport properties are described using the Van Genuchten formulation (Van Genuchten, 1980).
Relative permeability for the liquid phase is defined as follows:
2 / 1 * * 1 1 S S klr (8)where S* (Sl Slr) (1 Slr), klr the relative permeability of the liquid phase, Sl the liquid phase saturation, Slr the residual liquid phase saturation and a non-dimensional characteristic parameter of the law.
2 ^ 2 ^ 1 1 S S kgr (9) where ( ) (1 ) ^ gr lr lr l S S S S
S , klr the relative permeability of the gaseous phase and Sgr the residual liquid phase saturation.
Capillary pressure Pcap is calculated by the following expression:
* 1 1 0 S 1 P Pcap (10)where P0 is the air entry pressure in Pa.
3.3.2. The Dogger aquifer
Rojas and co-workers (1989) and more recently the PICOREF project (Brosse et al., 2007 and Grataloup et al., 2009) have shown that the targeted reservoir formation (i.e. The Upper Dogger formation) presents a very complex hydraulic behaviour due to its spatial variability. The choice has been made to model the Dogger aquifer in a three layered system (see Figure 4) with a high-productive layer (corresponding to the oolitic and bioclastic limestone) surrounding by two less-productive layers (respectively corresponding to the Comblanchian formation at the top and to a heterogeneous formation that can be found at the bottom of the Dogger aquifer). The global hydraulic transmissivity of the Dogger formation reaches a mean value of 38.1 D.m (Rojas et al., 1989) with a standard deviation of 23.5 D.m. The global thickness reaches 150 m. The intrinsic permeability of the high productive layer is then assumed to reach 705 mD with a productive thickness of 40 m. The less productive layers are assigned a 90 mD intrinsic permeability with a thickness of 30m and 80m. The Dogger formation is characterized by a dual porosity system. In this context, a simple assumption is made by affecting a homogeneous porosity value in the whole Dogger formation i.e. 15% corresponding to the mean value proposed in (Rojas et al., 1989). These assumptions are summarized in Figure 4.
[Figure 4 about here]
The Dogger multiphase transport properties (namely relative permeability and capillary pressure) are poorly referenced. An analogue rock formation is used corresponding to the Lavoux limestone (Andre et al., 2007). The Van Genuchten‘s model is used for the capillary pressure function and the liquid phase relative permeability model, whereas the relative permeability of the gaseous phase is better represented by a fourth-degree polynomial function (Andre et al., 2007) to fit the results of laboratories analyses performed by IFP (French Institute of Petroleum).
3.3.3. The Caprock layer
This formation is similar to the argillaceous rocks of the Callovian and Oxfordian geological unit, which can be found in the East of France (Bure, Haute-Marne, France). This formation has been chosen as a host medium for a potential underground nuclear waste storage site. Hydraulic properties have been chosen in agreement with the studies of (ANDRA, 2005) and with the physical analyses carried out in the Geocarbone-Integrity project (Fleury, 2007). Intrinsic permeability value is 0.05 µD and the total porosity is 5 %. Multiphase transport properties are based on the IFP laboratories analyses carried out on the samples representing the top of the Dogger formation of an oilfield located 100 km south east of Paris (Charmottes).
Air pressure entry ranges from 20 to 80 bars with a residual liquid saturation ranging from 10 to 30 %. Van Genuchten‘s parameter is chosen as 0.329 (ANDRA, 2005).
3.3.4 Other layers
The hydraulic properties of other layers are chosen from literature. In cases that any data does not exist, the hydraulic properties of an analogue layer are used. Table 2 summarizes the references on which the selected values (Table 3 and 4) are based.
[Table 2 about here]
3.4. Mechanical properties
An isotropic linear elastic behaviour characterized by the Young‘s modulus and the Poisson‘s ratio is assumed for the rock matrix. For the Dogger aquifer (upper and lower parts), the mechanical properties have been estimated based on the analyses carried out on the Lavoux limestone in Geocarbone Injectivity project (Bemer and Lombard, 2007), which are in agreement with the assumptions made in the PICOREF project based on (Vidal-Gilbert et al., 2009). The Biot‘s coefficient is chosen equal to 1.0.
The elastic properties of the argillaceous rock of the Callovian and Oxfordian geological unit can be found in (Freissmuth, 2002), which gives a Young‘s modulus ranging from 2.3 to 11.0 GPa and a Poisson‘s ratio ranging from 0.17 to 0.40. The median of these values have been chosen. The Biot‘s coefficient is chosen equal to 0.60 (Bounenni, 2002 in agreement with Vidal-Gilbert et al., 2009). The mechanical properties of the interlacing clay and shale layers are assumed to be identical to the caprock formation.
Concerning upper aquifer formations, the chosen elastic properties are based on the large scale hydromechanical model established in the PICOREF project to simulate CO2 injection in the oil depleted reservoir of Saint Martin de Bossenay in the South East of the Paris Basin (Vidal-Gilbert et al., 2009). The Biot‘s coefficient is chosen equal to 1.0. Table 3 and 4 summarize the layer properties assumptions for the Paris Basin case.
[Table 3 and 4 about here]
3.5. Modelling assumptions
Fleury and co-workers (2009) have measured CO2 pore diffusivity around 1.E-10 m²/s (25 °C). A similar value has been used in the long term study of (Gaus et al., 2005) showing that such phenomenon is very slow with limited impact on the caprock integrity. In this context, CO2 pore diffusivity has not been taken into account in the present study.
The supercritical CO2 is assumed to be injected at the same temperature as the host rock i.e. the isothermal conditions are considered. Acid based degradation experiments have been conducted in the framework of Geocarbone Injectivity project (Bemer and Lombard, 2007) with rock samples of the Charmottes site. Due to important scatter in the obtained results, no conclusion has been drawn from this study. In the lack of any available data, the chemical effects have not been taken into account.
Conventional coupling relationships between hydraulic properties and mechanical phenomena (e.g. David et al., 2001) are based on changes in volumetric strain. The pore pressure build-up during CO2 injection process increases the volumetric strain. Pore void volume (i.e. porosity) increases as well and this leads to the increase of the intrinsic permeability. Increasing the permeability slows down pore pressure increase and its impact on the effective stress changes comparing to the case where mechanical effect on hydraulic properties is not taken into
account. For illustration purpose of such a process, a one dimensional axisymmetric hydromechanical model is defined. Supercritical CO2 is injected at a rate of 10 kg/s in a 1 km large reservoir layer, whose material properties and initial conditions correspond to the assumptions of (Andre et al., 2007). The profile of the injection induced overpressure (defined as the difference between the final and the initial pore pressure) is assessed after 2 years of injection. Figure 5 shows the comparison between the results of a hydromechanical model taking into account the mechanical effect on hydraulic properties by means of the coupling relationship of David et al., 2001 (with porosity sensitivity exponent m = 5) and of a hydromechanical model without the mechanical effect. It can be seen that the pore pressure amplitude is higher in the case without the mechanical effect (with a difference of about 1 bar for the considered assumptions), which will amplify the effective stress decrease.
[Figure 5 about here]
These results are consistent with the conclusions of previous works (e.g. Rutqvist and Tsang, 2002, Blaisonneau et al., 2007).
On this basis, mechanical effects on hydraulic properties are not considered in the present application example. This assumption simplifies the sequential coupling procedure between TOUGH2 and Code_Aster. Firstly, two different mesh grids can be used for the hydraulic and mechanical models. A linear interpolation method is then used to transfer the total pressure field from the hydraulic mesh grid to the mechanical mesh grid. Secondly, the extension of the ―overpressurized‖ zone in the hydraulic analysis determines the extension of mechanical mesh grid i.e. the distance at which the system can be considered at the initial state and thus the distance at which lateral displacements are blocked.
Finally, spatial variability of both hydraulic and geomechanical properties is not taken into account. Each layer is modelled by an idealized homogeneous horizontal layer.
4.
Modelling scenario
Two modelling scenarios have been defined. The first one deals with ―normal‖ conditions considered as ―reference scenario‖. A second scenario is then considered as a critical scenario based on a sensitivity analysis on the input parameters.
4.1. ―Reference‖ scenario n°1
A first scenario is defined to be used as a ―reference‖ case based on the properties assumptions described above. CO2 is injected at the supercritical state at the mass rate of 320 kg/s corresponding to an annual rate of 10 Mt/y into the Dogger formation at depth 1650 m. This flux corresponds to the maximum injection rate evaluated for the Paris basin (Brosse et
al., 2007). The injection has been modelled over a period of 10 years followed by a storage
period of 10 years.
4.1.1. Gas saturation field
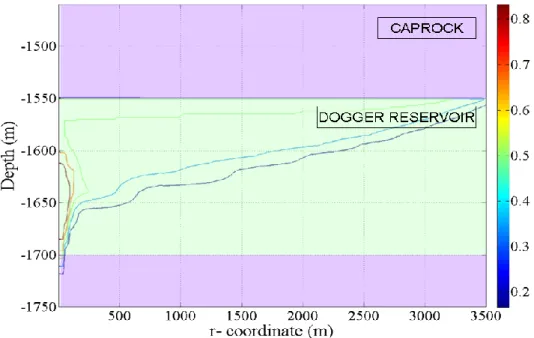
Figure 6 gives the gas saturation field after 10 years of injection (the wellbore is on the left side). The caprock layer fulfils its seal role as the CO2 plume is stopped at the interface between the caprock and the reservoir layer. CO2 accumulates at the interface with no penetration in the caprock layer after 10 years of injection. The maximum lateral extension of the CO2 bubble is about 3 km as shown in Figure 6.
The storage period has been simulated over a period of 10 years. Under buoyancy effect, the CO2 bubble extends laterally with an extension of 3.5 km (see Figure 7).
[Figure 7 about here]
4.1.2. Overpressure evolution
The Overpressure is defined as the difference between final and initial pore pressure. As shown by effective stress governing equation (see equation 3), the overpressure has a direct impact on the effective stress state and thus on the caprock failure tendency.
[Figure 8 about here]
Figure 8 gives the overpressure field in the system. The maximum overpressure is reached in the injection near zone, namely 34 bars. The ―overpressurized‖ zone extends more laterally than vertically. The overpressure is less than 1 bar for a vertical extension of 40 m, whereas it is less than 1 bar for a horizontal extension of nearly 60 km. At this distance, the system can be considered at the initial pressure and it determines the minimum extension of the mechanical model (see section ―Modelling assumptions‖). Figure 9 presents the extension (Log scale) of the overpressure at the interface between the caprock and the reservoir layer. The maximum lateral extension of the ―overpressurized‖ zone is then estimated at about 100 m. This is the most critical zone. The results are consistent with the conclusions of other authors (e.g. Rutqvist et al., 2007).
[Figure 9 about here]
The evolution of overpressure at the interface in the injection zone is presented in Figure 10. Three regimes can be distinguished. Firstly, the overpressure reached more than 90 % of the maximum overpressure after 2 years of injection, i.e. 20% of the injection period. Reservoir pressure increases less than 10 percent during 8 remaining years (i.e. 80% of the injection period). During the storage period (after 10 years), the overpressure quickly decreases to about 50 % of the maximum overpressure after 2 years of storage. This pressure recovery leads to a decrease of the caprock failure risk during the storage period. It is worth noting that time dependent behaviour of the rock is not taken into account in this analysis.
The obtained results show that the end of the injection period, when reservoir pressure is near to its highest level, can be considered as the critical period from a mechanical point of view. Moreover, a possible damage of the caprock in this period may provide higher risk, i.e. higher potential leakage rate due to the pressure gradient.
[Figure 10 about here]
4.1.3. Tensile fracturing tendency
The stress state evolution is analyzed in a Mohr diagram. Figure 11 shows the evolution of the stress state during the injection period. Both principal effective stresses (minimum and maximum) decrease rapidly after 2 years of injection, then the evolution slows down. This is linked with the overpressure evolution. After 10 years of injection, the minimum effective stress reaches 17 MPa for an initial effective stress of 18.35 MPa. During the injection period, the stress state remains in compression that prevents the tensile failure of the caprock layer.
4.1.4. Shear slip risk of pre-existing fractures
Let us consider that cohesionless fractures exist in the cap rock. These fractures might be reactivated following a shear failure mechanism (Mohr Coulomb criterion). In the Mohr diagram, the stress states during injection are compared to the shear reactivation criterion for cohesionless fractures. Two different values for the internal friction angle are considered namely, 20° and 30°. Neither of these criteria is reached for the reference scenario.
[Figure 11 about here]
4.2. Critical scenario n°2
There is a large uncertainty due to the lack of knowledge of the different formation layers. The hydromechanical model is very computer time consuming (more than 24 hours of simulation for a period of 10 years of injection) and thus a classical uncertainty analysis (e.g. Monte-Carlo analysis), which requires numerous simulations (typically more than 2500) seems not to be feasible. To deal with the uncertainties, a conservative approach consisting in identifying the most influential model parameters and assigning them their most critical values is proposed. This will constitute the critical scenario n°2.
4.2.1. Sensitivity analysis
A ―one factor at a time‖ sensitivity analysis (e.g. Campolongo et al., 2000) is conducted to evaluate the weight of each parameter on the damage tendency of caprock. It consists of varying each input parameter separately and to measure its effect on the output. Each input parameter is alternatively assigned its lower and upper values, whereas the other input parameters are fixed to their mean values as defined in the reference case scenario n°1. The tested parameters are reservoir hydraulic transmissivity (TRES), caprock intrinsic permeability (kCAP), caprock elastic properties (Young‘s modulus ECAP and Poisson‘s ratio CAP), and the initial stress state represented by K0 (ratio between initial total horizontal and vertical stresses). Table 5 summarizes the lower and upper bounds assumed for each input parameter.
[Table 5 about here]
Two output indicators are tested in the injection zone (radial distance < 100m) at the interface between the caprock and the reservoir layer (depth = -1550m) at the end of the injection period (10 years), namely the tensile fracturing tendency measured by the minimum effective stress ‘3 and the shear slip tendency of a cohesionless pre existing fracture measured by the ratio between the shear stress and the mean effective stress ||/‘m (e.g. Rutqvist et al., 2007). Figure 12 shows that the initial stress state and the reservoir hydraulic transmissivity have the greatest impact on the stress component ‘3 comparing to the other input parameters. They can be considered as the key parameters for tensile fracturing risk. The smallest value of ‘3 corresponds to the highest tensile fracturing tendency. Thus, the lower values of the key parameters are considered in the critical scenario.
[Figure 12 about here]
Similarly, Figure 13 shows that the initial stress state K0 has the greatest impact on the ||/‘m ratio comparing to the other input parameters. The shear slip tendency of a cohesionless pre-existing fracture increases when the ||/‘m ratio is high. As a result, the smallest initial stress ratio K0 corresponding to the highest ||/‘m ratio is considered. This result is consistent with
various hydromechanical studies (e.g. Sibson, 2003, Rutqvist et al., 2007, Seyedi et al., 2009).
[Figure 13 about here]
4.2.2. Definition of the critical scenario n°2
On the basis of the previous sensitivity analysis, the critical scenario n°2 is defined so that the initial stress ratio K0 = 0.6 and the reservoir hydraulic transmissivity is 14.6 D.m. Besides, the Biot‘s coefficient for the caprock layer is chosen to be equal to 1.0 in order to maximise the coupling effect of the hydraulic phenomena on the mechanical response.
4.2.3. Overpressure evolution
The overpressure is analyzed at the interface between the caprock and reservoir layer in the injection zone (see Figure 14). The maximum overpressure reaches about 70 bars, which corresponds to almost twice of the built overpressure in the ―reference‖ scenario n°1.
[Figure 14 about here]
4.2.4. Tensile fracturing tendency
The stress sate evolution is analyzed in a Mohr diagram (see Figure 15). The stress state remains in compression with a minimum effective stress of 10.2 MPa.
[Figure 15 about here]
4.2.5. Shear slip of pre-existing fractures
The stress state is compared to the shear reactivation criterion of a cohesionless pre-existing fracture with internal friction angles of respectively 15°, 20° and 30°. None of these criteria is reached. However the safety margin for the internal friction angle equal 15° is very small. The most critical orientation angle of a cohesionless fracture with internal friction angle of 15° reaches 50°.
5.
Discussion and concluding remarks
The present work deals with mechanical changes induced in the reservoir and the caprock due to CO2 injection. A sequential coupling between two specialized and well-established calculation codes is developed. It enables us to perform the very large scale hydromechanical simulations. This kind of simulations are necessary to evaluate the hydromechanical risks for a given storage site and to calculate the safety factors for a given injection scenario. Two geomechanical risks have been considered, namely the tensile fracturing and the shear slip reactivation of cohesionless pre-existing fractures. The performance of the developed methodology is demonstrated through an application case of CO2 storage in the geological context of Paris basin. The presented analysis is based on the available data. Many parameters are driven from literature or assumed due to a lack of field data. Note that the example application is conducted to illustrate all steps of the proposed approach and the capacity of the developed tools and the results must be considered only in this manner.
The influence of the various sources of uncertainties is estimated through a sensitivity analysis, which leads to the identification of the most influential input parameters on both failure mechanisms. On this basis, two configuration scenarios have been defined: a reference
scenario, for which the most likely values of the input parameters are considered and a critical one, for which the key parameters, namely the initial stress ratio and the reservoir hydraulic transmissivity take their most critical values (i.e. the lowest). The effects of the heterogeneity of hydraulic and mechanical parameters are neglected in the present study. Furthermore, the mechanical impact of the presence of a faulted area has not been modelled. Both represent key aspects for further research works.
However, the hydromechanical simulations of the CO2 injection in the Paris basin case provide a basic understanding of the large-scale flow, pressure and mechanical changes in response to industrial-scale CO2 injection into a laterally open saline aquifer. This underlines several key aspects, which should be considered for a site-specific modelling of CO2 storage candidate sites. For the given parameters and considered scenarios:
The overpressure is maximum in the injection zone with a distance inferior to 100 m from the injection wellbore. This zone can be considered as the most critical part of the system. Beside this distance, the overpressure decreases significantly ;
The lateral extension of the ―overpressurized‖ region is large (more than 50 km). This aspect should be taken into account when considering potential flow leakage trough abandoned wells or existing faults ;
The vertical extension of the ―overpressurized‖ region remains small without affecting the upper aquifer formations. For the properties assumptions, the caprock layer fulfils its role as the sealing layer and there is no gas penetration in the caprock ;
The increase in the pressure at the interface between the caprock and reservoir layer is very quick: after 2 years, it has reached more than 90 % of the maximum overpressure. After this period, the stress state evolves slowly as the overpressure evolves slowly as well ;
During the storage period, the pressure decreases rapidly i.e. 50 % during the first year of storage. This pressure recovery prevents the caprock failure risk during the storage period ;
Tensile fracturing mechanism is not activated for considered injection scenarios and chosen material properties. However, this failure mechanism can be activated for high injection pressure levels ;
This study has shown that a shear slip reactivation of pre-existing cohesionless fractures might be possible but for very low friction angle (less than 15°). One may notice that a commonly used value is 30° (e.g. Rutqvist et al. 2007), but note that due the presence of argillaceous minerals in the caprock matrix, the friction angle may be smaller (e.g. Handin, 1969).
Acknowledgements
The work presented in this article has been supported by the French Research National Agency (ANR) through the CO2 Capture and Storage-2005 program during ―Geocarbone-Intégrité‖ project under grant number ANR-05-CO2-007. We would like to thank the two anonymous reviewers for their detailed and constructive reviews. We also thank Alberto Pereira for useful technical contributions.
References
Andra (2005) Synthèse Argile : Evaluation de la faisabilité du stockage géologique en formation argileuse. 241 pages (in french).
Andre, L., Audigane, P., Azaroual, M., Menjoz, A. (2007) Numerical modeling of fluid–rock chemical interactions at the supercritical CO2–liquid interface during CO2 injection into a carbonate reservoir, the Dogger aquifer (Paris Basin, France). Energy Conversion and Management, 48, 6, 1782-1797.
Audigane, P., Gaus, I., Czernichowski-Lauriol, I., Pruess, K., Xu, T. (2007) Two-dimensional reactive transport modeling of CO2 injection in a saline aquifer at the Sleipner site, North Sea. Am. J. Sci., 307, 7, 974-1008. Bemer, E., Lombard, J.M., (2007) Caractérisation expérimentale de l'évolution des propriétés géomécaniques de
roches carbonatées sous l'effet d'une altération géochimique homogène. Colloque ANR 2007, Pau, France. Biot, M. A., (1941) General theory of three dimensional consolidation. Journal of Applied Physics, 12, 155-164. Blaisonneau, A., Andre, L., Audigane, P. (2007) Modelling of the hydromechanical impact on the reservoir
properties during supercritical CO2 injection. 1st french-german symposium on geological storage of CO2, Potsdam, Germany.
Bounneni, A. (2002) Etude experimentale de l‘effet de l‘endommagement sur la permeabilite des roches, Phd
Thesis, ENPC (in french).
Brosse, E., Hasanov, V., Bonijoly, D., Garcia, D., Rigollet, C., Munier, G., Thoraval, A., Lescanne, M. (2007) The PicorefProject: Selection of geological sites for pilot CO2 injection and storage in the Paris Basin. 1st
french-german symposium on geological storage of CO2, Postdam, Germany.
Campolongo, F., Kleijnen, J., Andres, T. (2000) Screening methods in Sensitivity Analysis. in Sensitivity
Analysis, A. Saltelli, K. Chan, and M. Scott, Eds. John Wiley and Sons Publishers.
Chavant, C., Granet, S., Le Boulch, D. (2002) Modelling of a nuclear waste disposal: numerical and practical aspects. Biot conference on poromechanics II, Rotterdam, the Netherlands.
Cornet, F.H. and Burlet, D. (1992) Stress field determinations in France by hydraulic test in borehole. Journal of
geophysics research, 97, 8, 11829-11849.
Coussy, O. (1995) Mechanics of Porous Continua (2nd edn), Wiley, Chichester, UK.
David, C., Menendez, B., Zhu, W., Wong, T.F. (2001) Mechanical compaction, microstructures and permeability evolution in sandstones. Phys Chem Earth, Part A: Solid Erath and Geodesy, 26, 1-2, 45-51.
EDF (2008) Code_Aster, Code d'Analyses des Structures et Thermomécanique pour Etudes et Recherches, http://www.code-aster.org, EDF R&D.
Fleury, M., Berne, P., Bachaud, P. (2009) Diffusion of dissolved CO2 in caprock. Energy Procedia, 1, 1, 3461-3468.
Fleury, M. (2007) The GeoCarbone-Integrity program: evaluating sealing efficiency of caprocks for CO2 storage, 1st french-german symposium on geological storage of CO2, Potsdam, Germany.
Freissmuth, H. (2002) The influence of water on the mechanical behaviour of argillaceous rocks. Phd Thesis, ENSMP (in french).
Gaus, I., Azaroual, M., Czernichowski-Lauriol, I. (2005) Reactive transport modelling of the impact of CO2 injection on the clayey cap rock at Sleipner (North Sea). Chemical Geology, 217, 3-4, 319– 337.
Grataloup, S., Bonijoly, D., Brosse, E., Garcia., D., Hasanov., V., Lescanne, M., Renoux., P., Rigollet C., Thoraval., A. (2009) PICOREF: A site selection methodology for saline aquifer in Paris Basin. Energy
Procedia, 1, 1, 2929-2936.
Handin, J. (1969) On the Coulomb-Mohr failure criterion. J. Geophys. Res., 74, 22, 5343–5348.
Itasca Consulting Group (1997) FLAC 3D, Fast Lagrangian analysis of continua in 3 dimensions. Version 2.0. Five volumes. Minneapolis, Minnesota, Itasca Consulting Group.
Jost, A., Violette, S., Gonçalvès, J., Ledoux, E., Guyomard, Y., Guillocheau, F., Kageyama, M., Ramstein, G., Suc, J.-P. (2007) Long-term hydrodynamic response induced by past climatic and geomorphologic forcing: the case of the Paris basin, France. Physics and Chemistry of the Earth, 32, 1-7, 368-378.
Morris, A., Ferril, D.A., Henderson, D.B. (1996) Slip tendency analysis and fault reactivation. Geology, 24, 3, 275-278.
Narasimhan, T.N., Witherspoon, P.A.. (1976) An integrated finite difference method for analyzing fluid flow in porous media. Water Resour Res, 12, 1665-1675.
Pruess, K. (2005) ECO2N—a TOUGH2 fluid property module for mixtures of water, NaCl, and CO2. Lawrence Berkeley National Laboratory Report LBNL-57952
Pruess K, Oldenburg, C.M., Moridis, G.J. (1999) TOUGH2 user‘s guide, version 2.0. Lawrence Berkeley National Laboratory Report LBNL-43134, Berkeley, CA, USA.
Raoult, Y. (1999) La nappe de l'Albien dans le bassin de Paris: de nouvelles idées pour de vieilles eaux, Phd
Thesis, Paris VI university, (in french).
Rojas, J., Giot, D., Le Nindre, Y.M., Criaud, A., Fouillac, C., Brach, M. (1989) Caracterisation et modelisation du reservoir geothermique du Dogger, bassin parisien, France. Technical Report CCE, EN 3G-0046-F(CD), BRGM R 30 IRG SGN 89 (in french).
Rutqvist J, Brikholzer JT, Tsang CF. (2008) Coupled reservoir-geomechanical analysis of the potential for tensile and shear failure associated with CO2 injection in multilayered reservoir-caprock systems. Int. J. Rock
Mechanics & Mining Sciences, 45, 2, 132-143.
Rutqvist, J., Birkholzer, J., Cappa, F., Tsang, C.-F. (2007) Estimating maximum sustainable injection pressure during geological sequestration of CO2 using coupled fluid flow and geomechanical fault-slip analysis.
Energy Conversion and Management, 48, 6, 1798-1807.
Rutqvist, J., Wu, Y.-S., Tsang, C.-F., Bodvarsson, G. (2002) A modeling approach for analysis of coupled multiphase fluid flow, heat transfer, and deformation in fractured porous rock. Int. J. Rock Mechanics &
Mining Sciences, 39, 429-442.
Rutqvist, J. and Tsang, C.-F. (2002) A study of caprock hydromechanical changes associated with CO2 injection into a brine aquifer. Environ. Geol., 42, 2-3, 296-305.
Seyedi, D., Ducellier, A., Foerster E., Guy, N., Hild, F., Rohmer, J. (2009) Coupled hydromechanical modeling for the study of integrity and safety of geological storage of CO2. Energy Procedia, 1, 1, 2541-2548.
Sibson, RH. (2003) Brittle-failure controls on maximum sustainable overpressure in different tectonic stress regimes. Bull. Am. Assoc. Petrol. Geol., 87, 6, 901–908.
Skempton, A.W. (1961), Effective stress in soil, concrete and rocks, in Pore Pressure and Suction in Soils, Butterworths, London, UK.
Soltanzadeh H. and Hawkes, C.D. (2008a) Semi-analytical models for stress change and fault reactivation induced by reservoir production and injection. J. Petroleum Science & Engineering, 60, 71-85.
Soltanzadeh, H. and Hawkes, C.D. (2008b) Assessing fault reactivation tendency within and surrounding porous reservoirs during fluid production injection. Int. J. Rock Mechanics & Mining Sciences, (in press).
Streit, J.E., Hillis, R.R. (2004) Estimating fault stability and sustainable fluid pressures for underground storage of CO2 in porous rock. Energy, 29, 9-10, 1445–1456.
Terzaghi, K. (1943), Theoretical Soil Mechanica, John Wiley and Sons, New York, USA.
Van Genuchten, M.T. (1980) A closed-form equation for predicting the hydraulic conductivity of unsaturated soils. Soil. Sci. Soc. Am. J., 44, 892–898.
Vidal-Gilbert, S., Nauroy, J.-F., Brosse E. (2009) 3D geomechanical modelling for CO2 geologic storage in the
LIST of TABLES
Table 1: Formation layer description in the Paris basin case
Description des couches dans le bassin de Paris
Layer Lithology Geological unit Thickness (m) Depth (m) Hydrostratigraphy
N°1 Chalk Upper
Cretaceous
500 500 Semi permeable
N°2 Clay and Shale Albian and Cenomanian
60 560 Low permeable
N°3 Sandstone Albian 100 660 High permeable
N°4 Clay and Shale Lower
Cretaceous and Purbeckian
200 860 Low permeable
N°5 Limestone Thitonian 150 1010 High permeable
N°6 Shale Kimmeridgian 150 1160 Low permeable
N°7 Limestone Oxfordian and
Kimmeridgian
300 1460 High permeable
N°8 Clay and Shale Oxfordian and Callovian
90 1550 Low permeability
N°9 Limestone Upper Dogger 150 1700 High permeable
N°10 Limestone (tight) Lower Dogger 150 1850 Semi to low permeable
N°11 Clay Lias 400 2250 Low permeable
Table 2: References and natural analogue layers for material properties Références et analogues naturels utilisés pour le choix des propriétés des matériaux
Layer name Multiphase transport properties Reference Dogger formation
(lower part)
Natural analogue of the Lavoux limestone except for the air entry pressure, which is assumed to reach 10
bars
Andre et al., 2007
Interlacing clay and
shale As Dogger caprock
IFP works (Fleury, 2007) Chalk aquifer The classical Van Genuchten‘s model (Raoult et al., 1999) Sandstone aquifer hypothesis of the Sleipner model Raoult et al., 1999 / Audigane et al., 2007 Carbonate aquifers
Natural analogue of the Lavoux limestone and the classical Van Genuchten‘s model for gaseous phase
Andre et al., 2007 Ajost et al. 2007
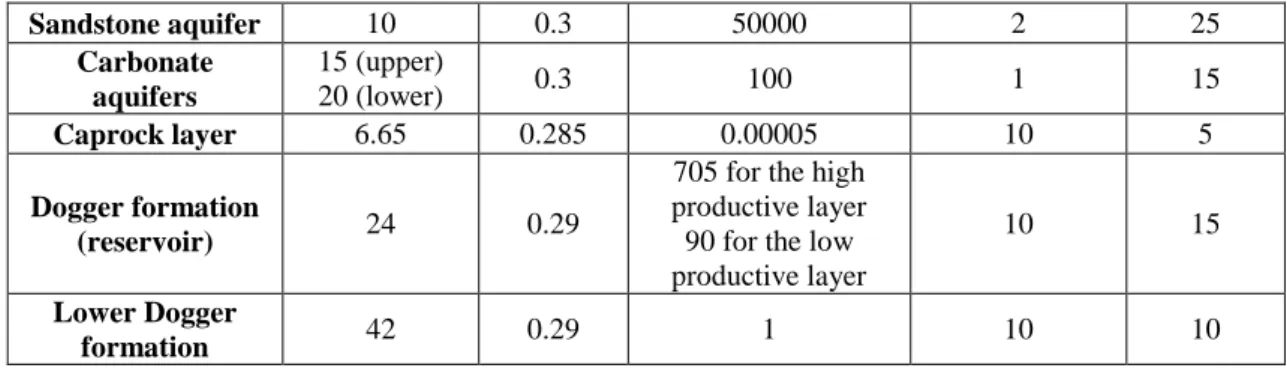
Table 3: hydromechanical properties for formation layers in the Paris basin case
Propriétés hydromécaniques des couches du basin de Paris
Layer Young Modulus [GPa] Poisson ratio [-] Intrinsic permeability [mD] Ratio between horizontal and vertical permeability Porosity [%] Chalk aquifer 5 0.3 1 1 30
Clay and Shale
Sandstone aquifer 10 0.3 50000 2 25 Carbonate aquifers 15 (upper) 20 (lower) 0.3 100 1 15 Caprock layer 6.65 0.285 0.00005 10 5 Dogger formation (reservoir) 24 0.29
705 for the high productive layer 90 for the low productive layer
10 15
Lower Dogger
formation 42 0.29 1 10 10
Table 4: Relative permeability and capillary pressure model
Modèle de perméabilité relative et de pression capillaire
Layer Van Genuchten’s parameter Residual liquid saturation [%] Residual gas saturation [%] Air entry pressure [bars] Carbonate aquifers
and Chalk aquifer 0.600 20 5 0.54
Sandstone aquifer 0.750 1.5 20 0.0358
Clay and Shale
interlacing layers 0.329 30 5 50
Caprock layer 0.329 30 5 80
Reservoir layer 0.600 20 5 0.54
Lower Dogger
formation 0.600 20 5 10
Table 5: Definition of the input parameters lower and upper bounds for the sensitivity analysis
Définition des plages de variation pour les paramètres d’entrée de l’analyse de sensibilité
Imput parameter Symbol Unit Lower bound Upper bound Reservoir hydraulic transmissivity TRES [D.m] 38.1-23.5=14.6 38.1 Caprock intrinsic permeability kCAP [mD] 0.00005 0.001
Poisson’s ratio CAP [-] 0.17 0.40
Young’s modulus ECAP [GPa] 2.3 24
LIST of FIGURES CAPTIONS
Figure 1: Schematic view of sequentially linking specialized codes respectively in fluid and heat transport analysis (TOUGH2 from LNBL) and stress and strain analysis (Code_Aster from EdF)
Vue schématique du couplage séquentiel entre le code de calcul de transport multiphasique TOUGH2 de LNBL et celui hydromécanique Code_Aster de EdF
Figure 2: A) Stress components acting on a fracture plane in a rock sample, B) change in the stress state due to increase of the pore pressure in the Mohr diagram
A) Définition des contraintes agissant sur une fracture dans un échantillon de roche, B) modification dans le diagramme de Mohr de l’état des contraintes résultant de l’augmentation de la pression de pore
Figure 3: Schematic view of the Paris basin hydromechanical model (lateral and vertical dimensions are not at scale)
Vue schématique du modèle du basin de Paris (échelle latérale et verticale ne sont pas identiques)
Figure 4: Schematic view of the Dogger reservoir
Figure 5: Comparison of pore pressure profile between a one dimensional axisymmetric hydromechanical model (based on Andre et al., 2007) taking in to account the mechanical effect on hydraulic properties (coupling relationship of David et al., 2001), straight black line, and a model without such mechanical effect (dashed red
line).
Comparaison entre les profiles de pression de pore d’un modèle axisymétrique unidimensionnel (basé sur Andre et al., 2007) prenant en compte l’impact des phénomènes mécaniques sur les propriétés hydrauliques (relation
de couplage de David et al., 2001), ligne noire en trait plein, et un modèle sans l’effet mécanique, ligne rouge hachurée.
Figure 6: Gas saturation field after 10 years of injection
Figure 7: Gas saturation field after 10 years of storage
Champ de saturation en CO2 après 10 ans de stockage
Figure 8: Overpressure field (bars) after 10 years of injection
Figure 9: Overpressure evolution along the interface between caprock and reservoir layer (depth = -1550m)
Evolution de la surpression le long de l’interface couverture – réservoir
Figure 10: Overpressure evolution in the injection zone (distance <100m from the injection wellbore) at the interface between the caprock and the reservoir layer (depth = -1550m) in the injection zone (radial distance
<100m) during the injection period (year 1 to 10) and during the storage period (year 11 to 20)
Evolution de la surpression dans la zone d’injection (distance <100m depuis le puits) à l’interface entre la couverture et le réservoir (profondeur = -1550m) dans la zone d’injection (distance radiale < 100m) pendant
Figure 11: Evolution of effective stress state (Mohr diagram) at the interface between the caprock and the reservoir layer (depth = -1550m) in the injection zone (radial distance <100m) during injection and comparison
with shear reactivation criteria
Evolution de l’état des contraintes effectives (diagramme de Mohr) à l’interface entre la couverture et le réservoir (profondeur = -1550m) dans la zone d’injection (distance radiale < 100m, pendant la période
d’injection et comparaison avec les critères de réactivation par cisaillement de fractures
Figure 12: Influence of the input parameters on the minimum effective stress (the tensile fracturing tendency measureat the interface between the caprock and the reservoir layer (depth = -1550m) in the injection zone
(radial distance <100m), at the end of the injection (10 years)
Influence des paramètres d’entrée sur la contrainte effective minimale à l’interface entre la couverture et le réservoir (profondeur = -1550m) dans la zone d’injection (distance radiale < 100m, à la fin de
Figure 13: Influence of the input parameters on the ratio between the shear stress and the mean effective stress (measuring the shear slip tendency of a cohesionless pre existing fracture) at the interface between the caprock and the reservoir layer (depth = -1550m) in the injection zone (radial distance <100m) at the end of the injection
(10 years).
Influence des paramètres d’entrée sur le ratio entre la contrainte de cisaillement et la contrainte effective moyenne à l’interface entre la couverture et le réservoir (profondeur = -1550m) dans la zone d’injection
(distance radiale < 100m), à la fin de l’injection (10 ans).
Figure 14: Comparison between the overpressure evolution between the « reference scenario n°1 (straight black line) and the « critical » injection n°2 (dashed black line) at the interface between the caprock and the reservoir
layer (depth = -1550m) in the injection zone (radial distance <100m), during the injection period.
Comparaison entre l’évolution de la surpression du scénario dit de « référence » (trait plein) et celui dit « critique » (en pointillés) à l’interface entre la couverture et le réservoir (profondeur = -1550m) dans la zone
Figure 15: Comparison between stress states after 10 years of injection for reference scenario n°1 (Mohr circle in blue) and for critical scenario n°2 (Mohr circle in red) at the interface between the caprock and the reservoir
layer (depth = -1550m) in the injection zone (radial distance <100m)
Comparaison de l’état des contraintes après 10 ans d’injection entre le scénario dit de « référence » (cercle de Mohr en bleu) et celui dit « critique » (cercle de Mohr en rouge) à l’interface entre la couverture et le réservoir