HAL Id: hal-01392627
https://hal.archives-ouvertes.fr/hal-01392627v2
Submitted on 10 Jan 2017HAL is a multi-disciplinary open access archive for the deposit and dissemination of sci-entific research documents, whether they are pub-lished or not. The documents may come from teaching and research institutions in France or abroad, or from public or private research centers.
L’archive ouverte pluridisciplinaire HAL, est destinée au dépôt et à la diffusion de documents scientifiques de niveau recherche, publiés ou non, émanant des établissements d’enseignement et de recherche français ou étrangers, des laboratoires publics ou privés.
Microfluidic platform for optimization of crystallization
conditions
Shuheng Zhang, Charline Gerard, Aziza Ikni, Gilles Ferry, Laurent Vuillard,
Jean Boutin, Nathalie Ferte, Romain Grossier, Nadine Candoni, Stéphane
Veesler
To cite this version:
Shuheng Zhang, Charline Gerard, Aziza Ikni, Gilles Ferry, Laurent Vuillard, et al.. Microfluidic platform for optimization of crystallization conditions. Journal of Crystal Growth, Elsevier, 2017, 472, pp.18-28. �10.1016/j.jcrysgro.2017.01.026�. �hal-01392627v2�
1
Microfluidic platform for optimization of crystallization conditions
Shuheng Zhang1, Charline J.J. Gerard1, Aziza Ikni1, Gilles Ferry2, Laurent M.
Vuillard2, Jean A. Boutin2, Nathalie Ferte1, Romain Grossier1, Nadine Candoni1,
Stéphane Veesler*1
1
CINaM - CNRS, Aix-Marseille Université, Campus de Luminy, Case 913, F-13288 Marseille Cedex 09 fax : +334 91418916, email : [email protected]
2
Institut de Recherches SERVIER, 125, chemin de ronde, F-78290 Croissy-sur-Seine.
Abstract
We describe a universal, high-throughput droplet-based microfluidic platform for crystallization. It is suitable for a multitude of applications, due to its flexibility, ease of use, compatibility with all solvents and low cost. The platform offers four modular functions: droplet formation, on-line characterization, incubation and observation. We use it to generate droplet arrays with a concentration gradient in continuous long tubing, without using surfactant. We control droplet properties (size, frequency and spacing) in long tubing by using hydrodynamic empirical relations. We measure droplet chemical composition using both an off-line and a real-time on-line method. Applying this platform to a complicated chemical environment, membrane proteins, we successfully handle crystallization, suggesting that the platform is likely to perform well in other circumstances. We validate the platform for fine-gradient screening and optimization of crystallization conditions. Additional on-line detection methods may well be integrated into this platform in the future, for instance, an on-line diffraction technique. We believe this method could find applications in fields such as fluid interaction engineering, live cell study and enzyme kinetics.
A2. Growth from solutions; A.2 Single crystal growth; B.1 Biological macromolecules; B1. Lysozyme
Introduction
Over the past few decades, the science of crystallization has attracted vast interest and found widespread applications in both industrial and scientific fields. In all these fields, obtaining suitable quality crystals involves the major challenge of monitoring and controlling the crystallization process. For instance, the optics industry requires large single crystals. In pharmaceutical industry, crystallization is employed as a simple and efficient process of purification, separation and final manufacturing of active pharmaceutical ingredients (APIs). Therefore, final product quality (bioavailability, processability and patient security) is highly correlated with crystal properties (polymorphism, crystal size distribution, crystal habit, morphology). For structural biologists attempting to solve three-dimensional structures of biological macromolecules including proteins via X-ray crystallography, the decisive and rate-limiting step is obtaining diffraction-quality crystals. However, producing suitable crystals is not an easy job. Crystallization is complex and influenced by many parameters (pH, temperature, and types of buffers, salts and crystallization agents), especially for biomolecules
2
like proteins. Because nucleation is of a stochastic nature, it is necessary to perform a large number of experiments in order to obtain reliable data[1]. Furthermore, no current theories are available to predict in which environment or under what conditions a new protein can be successfully crystallized. Problems in producing suitable crystals can be tackled following two steps: screening for favourable crystallization conditions in the phase diagram and subsequent optimizing of crystal growth by developing a specific kinetic path in the phase diagram. This contrasts with common practise mainly based on trial and error where a vast quantity of conditions are screened, a lengthy and wasteful procedure. As a result, there is a genuine need for improved techniques (of screening and optimization) for automating, miniaturizing and high-throughput crystallization approaches.
In recent years, research advances in high-throughput crystallization trials involving multiple operations such as mixing, analysis, separation[2] have led to achievements in protein crystallization. These state-of-the-art trials are generally based on two categories of techniques. The first category is the high-throughput robotic techniques which rely on automated liquid-handling techniques integrated with micro or nanoliter dispensers and fluidic circuits[3]. Crystallization robots, such as Impax 1–5/Oryx-6, Cyberlabs C-200 and Mosquito® Crystal, enable initial crystallization screening by testing numerous crystallization parameters with up to 105 crystallization trials per day and very low consumption of materials[4] (as little as 10nL per trial). However, these robotic systems require substantial dedicated space and generally a high investment, making them inaccessible to most crystallization laboratories. Moreover, the highly interconnected fluidic circuits lead to an accumulation of particles, which makes maintenance cumbersome, involving breaking the circuit and routing the plug out of the system[5]. The second category is microfluidic techniques, i.e. the control and manipulation of flows to sub-millimeter scale using miniaturized devices called lab on chip (LOC)[6]. Unlike high -throughput robots, microfluidic chips are applied in both fast screening and optimization stages of protein crystallization studies, via the integration of traditional protocols of protein crystallization[7] such as free interface diffusion (FID)[8], counter-diffusion[9], vapour diffusion[10] and microbatch[11]. Microfluidic technology has been applied to protein crystallization either through flow-based or droplet-based microfluidics.
Flow-based microfluidic techniques generally refer to liquid-handling methods using specially designed microchannels, valves, or chambers. A good example is the technique developed by Hansen et al., which integrates the FID method into a chamber-and-valve-based microfluidic chip using silicone elastomer sealed to an etched glass substrate[3, 12]. This microfluidic chip includes up to 480 reaction units. Each simple reaction unit includes three pairs of microwell chambers, with well-defined volumes, where fluid contact is controlled with a central interface valve, allowing the protein and precipitant solutions to mix by FID. Another technique based on the FID method is that of Du et al., called the « SlipChip® »[13]. In a slipchip®, protein and precipitant solutions are loaded respectively in the microwells of the bottom plate and in the channels of the top plate. Then fluid contact between the microwells and the channels is enabled simply by slipping the top and bottom plates so that the two solutions diffuse one into another. In a third technique, Sauter et al. developed a microfluidic chip to crystallize biomolecules in microchannels by counter-diffusion (CD), with direct analysis of crystals by X-ray diffraction[14]. This chip consists of a set of parallel microchannels arranged in a tree-like
3
network where the root-side connects to the protein solution and the branch-side connects to the precipitant. The geometry of the channels was chosen to ensure that crystallization occurs in a convection-free environment. With solutions diffusing gently through the channels, a supersaturation gradient is established. Thus crystal size distribution is observed at the end of the experiment: with amorphous precipitation or microcrystallites seen on the root side, due to the higher protein concentration, and diffraction-quality crystals of sufficient size seen on the branch side.
Droplet-based microfluidic techniques for crystallization are generally miniaturized versions of microbatch, i.e. simply mixing protein solution with precipitants, buffers or crystallization agents inside droplets generated in oil[15]. Various droplet systems have been developed for crystallization studies, combined with different crystallization techniques. For example, Ildefonso et al. used the double-pulse method to study nucleation kinetics using PDMS chips[16]. Gerdts et al. integrated the seeding technique into droplet methods and produced diffraction-quality crystals[17]. These droplet-based microfluidic methods have been proven to provide the advantages of high-throughput, low sample and reagent consumption, rapid mixing and minimal cross-contamination.
However, despite the spectacular achievements in protein crystallization made through these microfluidic techniques several drawbacks remain:
1. These microfluidic chips rely mainly on microfabrication technologies such as soft-lithography, high-resolution stereolithography and 3D print techniques. Although these technologies are well-developed, microfabrication processes can be expensive and time-consuming, requiring specialist infrastructure and expensive handling. 2. Currently used chip materials such as silicone and glass[18] hydrogels[19] and elastomers[20, 21] are not fully compatible with all crystallization solvents. For example, PDMS, the most frequently used material, is not compatible with organic solvents such as acetone. In addition, solvent evaporation due to the permeability of the polymer need to be taken into account. 3. Single design leads to unchangeable geometry of channel networks, making it complicated to alter the setup. Thus the current microfluidic systems are less accessible to non-specialists. 4. Liquid-handling at microfluidic scale is very sensitive to liquid properties such as flow viscosity and surface tension. Hence, system calibration is obligatory for each working fluid and can be very difficult when handling liquids with high viscosity (i.e. PEG) or low surface tension (i.e. detergent used for solubilization of membrane protein). This is also the main reason why most of the current droplet methods rely on surfactant use. However, the problem with using surfactants is their possible interference with protein molecules, which affects the crystallization process.
Our objective is to develop and validate a universal droplet-based microfluidic platform for crystallization, for both screening and optimization. Such a platform should cover all applications and be able to address all possible challenges in crystallization studies, such as compatibility with all solvents, ease of use, low cost, flexibility, etc. Here we describe in full the design, validation and application of our platform. In Materials and Method, we describe the four separate components of this platform: droplet factory (mixing and generation), on-line characterization (droplet size, frequency and chemical composition), incubation and
4
observation. Results and Discussion is divided into three parts. The first discusses the control of stability and reproducibility of droplets using hydrodynamic law and off-line characterization techniques. The second discusses the development of the on-line characterization module and corresponding measurements, particularly of droplets composition. The third describes an application of high-throughput screening and optimization by a fine tuning of concentration is demonstrated.
Materials and methods
Protein solutions. Hen-egg white lysozyme (14.6 kDa, pI = 11.2) was purchased from Sigma (batch 057K7013 L 2879) and used without further purification. Lysozyme purity was checked by molecular sieving. A suitable amount of lysozyme was dissolved in pure water (ELGA UHQ reverse osmosis system) to obtain the stock solutions required. A 1.4 M NaCl solution was also prepared. The different solutions were buffered with 80 mM acetic acid, adjusted to pH = 4.5 with NaOH (1 M), and filtered through 0.22 μm Millipore filters. The pH was checked with a pH meter (Schott Instrument, Prolab 1000) equipped with a pH microelectrode. Lysozyme concentrations were checked by optical density measurements (Biochrom, Libra S22) using an extinction coefficient of 2.64 mL cm−1 mg−1 at 280 nm. In all the crystallization experiments hereafter, the NaCl concentration was fixed at 0.7 M at pH = 4.5. Pentaethylene Glycol Monodecyl Ether (C10E5 – Anatrace) a non-ionic detergent was used as a solubilizing agent in the crystallization experiments with lysozyme, mimicking crystallization of membrane proteins. Aqueous solutions for mixing and fine-gradient tests. Aqueous solutions are prepared for tests of mixing and fine gradient. Food dyes (~2%, blue dye, Vahiné E102 and yellow dye, Vahiné E133) are added to deionized water for visualization purposes. The extinction coefficients of the food dyes are unknown. However, by performing the absorbance spectrum of mono-dyed solutions, we observe that maximum absorption for the yellow and blue dyes occurs respectively at 430nm and 631 nm. Consequently, the evolution of the respective maximum absorption represents the evolution of the concentration of respective food dyes for mixing and fine-gradient tests.
Continuous phases: We used FMS oil (Hampton Research) for dye solutions and Fluorinated oil FC-70 (Hampton research, FluorinertTM) for protein solutions. These oils show no or very low miscibility with dye and protein solutions and good wettability with Teflon.
Microfluidic platform
The development and optimization of the whole microfluidic system are based on the notion of modular microfluidics so that microfluidics becomes more accessible to all users, even non-specialists. This idea is analogous with the concept of breadboards in the electronic industry[22, 23], discrete components that can easily be assembled, replaced or removed in a plug-and-play mode. This offers several advantages over traditional methods with respect to system cost, planning, evolution and maintenance. Hence, to construct such a modular platform for crystallization, two principles are respected. The first principle consists in using separate micro-junctions to assemble the microfluidic circuit, including the droplet factory and storage chip[24]. The second principle consists in building the whole platform for crystallization with
5
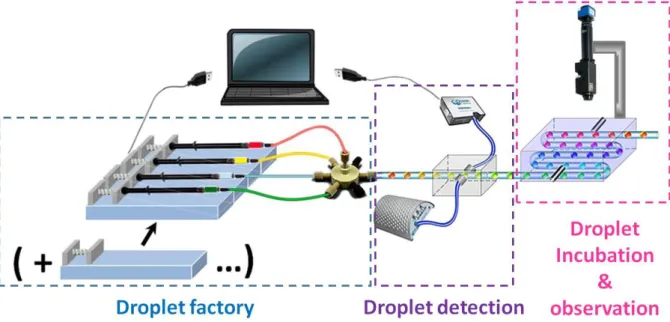
modular sub-functions, including droplet generation, characterization, incubation and observation. The different parts of the microfluidic platform are presented in figure 1.
Fig. 1 Schematic illustration of the entire microfluidic platform.
Droplet factory.
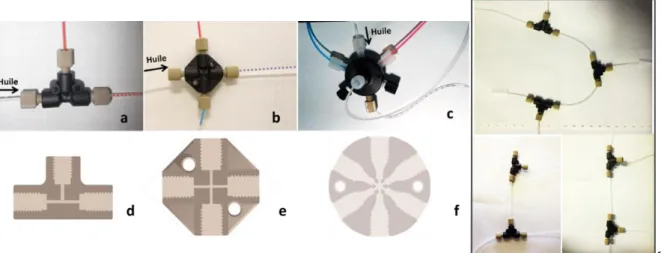
PEEK & Teflon microfluidic junction. The droplet factory is built using commercially-available PEEK junctions and Teflon tubing (IDEX Health and Science), initially designed for high-performance liquid chromatography (HPLC) systems. These two materials were previously tested in our group[25] and proved to be compatible with almost all solvents, showing excellent resistance and no solvent evaporation. This is a real benefit, especially when dealing with organic solvents that are problematic for frequently-used silicone-based microfluidic chips[25]. The PEEK & Teflon droplet factory are of a circular cross-section affording hydraulic resistance up to 10-fold lower than commonly-used rectangular cross-section microfluidic set-ups[26]. The different geometries of the droplet factory such as T-, cross- and multiport-junctions (Fig. 2a-f) enable us to generate droplets in oil either by injecting one dispersed phase or by mixing several dispersed phases (crystallization solutions) into droplets. Moreover, using separate microfluidic junctions provides a great deal of flexibility and scalability by creating new geometries combining several junctions according, to experimental requirements (Fig. 2g). Droplet size can be controlled as low as several nano-liters by changing flow-rates or inner diameters of microfluidic junctions (from 1mm to 100µm).
6
g
Fig. 2 Pictures and diagrams of the microfluidic junctions (a) T-junction, (b) cross- junction, (c) 7-port junction. (d), (e) and (f): Corresponding diagrams of inner geometries of (a), (b) and (c) (From IDEX Health and Science catalogue). (g) An example of flexibility in creating new geometries by regrouping microfluidic junctions.
Programmable syringe pumps. Dosing rates of syringes containing oil and dispersed phases are controlled precisely and steadily (as low as 0.01µL/s), without any pulses, by a programmable pump system (neMESYS, cetoni GmbH). This pump system can also be programmed to create a tuneable flow-rate gradient from several µL/s to µL/h. This flow-rate gradient will finally be transformed to a concentration gradient among droplets. Figure 3 shows the generation of a droplet array with a concentration gradient. According Candoni et al.[27], droplet size and frequency are controlled by both total flow-rate and flow-rate ratio. Hence, in order to keep size and volume constant among all droplets in the array, we keep the flow-rate of the oil and the sum of the flow-rates of all the dispersed phases constant. It is important to use a constant crystallization volume because volume affects nucleation[28].
Fig.3 (a) Illustration of a gradient of flow-rates programmed using “neMESYS” interface. Droplets are formed by mixing two dispersed flows (D1 and D2) into oil. Q-D1, Q-D2 and Q-Oil refer to the flow-rates of the dispersed
phases 1, 2 and the oil, respectively. Scale bar is 300µL/h. (b) Partial demonstration of concentration gradient among droplets formed by the flow-rates in (A).
7
Off-line and on-line characterization of droplets
Direct UV-Vis absorbance spectroscopy is considered universally applicable in the analysis of bio-macromolecule samples. Nevertheless, the application of this analytical technique in microfluidic systems is very challenging due to the reduced scale of the optical path involved[29]. Consequently, it is crucial to implement convenient sampling methods as well to optimize measurements. In this study, both off- and on-line characterization techniques were developed.
Firstly, we performed the time-consuming and difficult task of “off-line” characterization to test the “dosing rate – droplet” synchronization and the feasibility of the fine-gradient experiment. The idea is to fish out each droplet using a pipette and measure its chemical composition with the Nanodrop® spectrometer. The correspondence between the gradient of the dosing rates and the chemical composition in droplets is checked. Although the off-line measurements are rough, they provide us with important data for fine-gradient screening and optimization.
The on-line characterization module is divided into two general parts – the in-line miniaturized analytical instruments and the in-line sampling cell (“SC” in Fig.4).
- The in-line analytical instruments are selected for overall modular system design, including (1) a light source (“LR” in Fig.4, DT-MINI-2-GS, Ocean optics) with a bandwidth of 215–2500 nm; (2) a UV-Vis-NIR spectrometer (USB2000+, Ocean optics) with a spectral range of 190-2300nm; and (3) a software interface (OceanView, Ocean optics) that allows in-situ analyses.
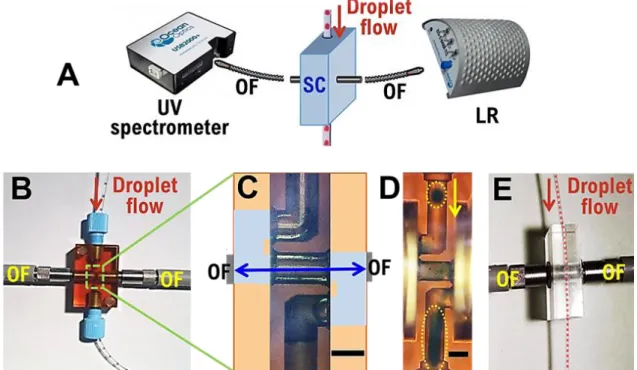
- The sampling cell allows the outlets of the microfluidic device to be connected to the UV-Vis instruments using optical fibres (“OF” in Fig.4, 400µm ID, QP400-1-UV-VIS, Ocean optics). Both commercial and home-made tailored UV sampling cells are tested, by either collecting droplets from the microchannels for measurements (the commercial UV flow-cell) or detecting droplets directly within the microchannels (the home-made tailored UV SC). The commercial UV flow-cell (SMA-Z-Cell-2.5, FIAlab) has a Z-shaped inner flow path with 2.5mm optical path length (see the blue double arrow in Fig.4C). With the outlet tubing of the microfluidic junction connecting to the flow-cell, the droplet flow travels through the inner flow path. Two optical ports enable the flow-cell to be connected to the light source and spectrometer with the optical fibres and thus droplets to be detected. Although the flow-cell was initially intended for classical flow injection analysis[30], unfortunately, it was not suitable for the detection of a biphasic flow (of droplets) due to the extreme complication of liquid handling when dealing with individual crystallization solutions. Droplets, which are spherical when they enter the UV flow-cell, collapse in the Z-shaped channel and wet the inner channel wall (Fig. 4D). There are several explanations for this: the surface roughness of the inner channel and/or the high shearing stress and/or the hydraulic resistance due to the Z geometry. The home-made and specially-designed UV cell, home-made of PMMA (Poly(methyl methacrylate)), consists of an inner channel of 1.57mm diameter made by mechanical excavation and which acts as a tubing holder, and two junctions for the connection of optical fibres with
8
no special adjustment for coupling tube to optical fibres. Thus the UV cell is able to combine the tubing carrying the circulating droplets with the optical fibres. The center of the microfluidic tubing is perfectly aligned with the centers of the optical fibres. Thus, instead of fishing droplets out of the tubing for sampling, the UV cell enables direct absorbance measurements within the tubing. The tubing wall material is transparent enough under UV light. Thus, allowing real-time, in-situ spectral analysis of droplets is possible: absorbance at one or several wavelengths can be recorded. Hence, the evolution of the chemical composition can be analyzed using Beer-Lambert’s law.
Fig. 4 (A) Schematic illustration of on-line droplet characterization module with sampling cell (SC), optical fibers (OF) and Light source LR; (B) commercial UV flow-cell with (C) Z-shaped inner flow path with 2.5mm optical path length and (D) with droplets of dyed water in oil collapsing (circle in dotted line) when passing in the Z-shaped channel (inner diameter of 750µm); (E) home-made UV cell to insert tubing of 1.5mm outer diameter in a channel of 1.57mm diameter.
Droplet incubation and observation
Droplets are sealed in the original Teflon tubing which is then placed and incubated within a tubing-holder water bath (ANACRISMAT) (Fig. 5). Up to thousands of droplets can be incubated using this tubing holder. With matching optical indexes of tubing and water, the water bath also provides the advantage of facilitating observation of the crystallization event[31]. A flow of dry air can be incorporated in the cover of the tubing holder to avoid condensation when working with low crystallization temperature (yellow arrows in Fig. 5A). Observation of droplet evolution is carried out using a digital camera with various zooms (Opto GmbH) attached to a XYZ motorized arm (ANACRISMAT). Thus, this camera can be programmed to memorize the position and focusing of each droplet. Finally, the camera takes photos of each droplet with a pre-set time interval.
9 Fig. 5 Photos (A & B) and diagram (C) of the thermostatted tubing holder using water bath (± 0.1°C). Blue areas in (A) are tubing connections.
Results and discussion
Control of droplet size and frequency.
In this study, droplet size is characterized with L/W (L, droplet length and W, channel width) and droplet frequency with f (number of droplets per cm) or fD (number of droplets per second).
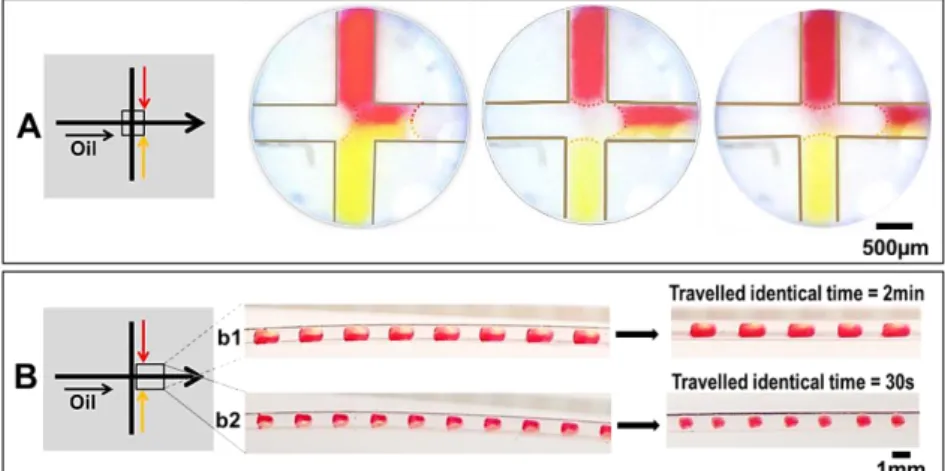
Fig. 6A shows an example of droplet generation by mixing two aqueous solutions facing each other in a cross-junction. The dispersed flows meet and are mixed at the moment when droplets are formed and released into the microfluidic channel by the flow of oil. Thus no accumulation of particles due to precipitation is observed within the channel. As a result, using cross- or multiport junctions to form droplets by injecting several dispersed phases can avoid problems such as channel clogging. Compared to the commonly used premixing method, this method of direct mixing within microfluidic junction provides is preferable for screening at high-supersaturation conditions, where precipitation is frequently produced.
Fig. 6 (A) Generation of droplet by injecting two aqueous solutions facing each other in a 500µm ID cross-junction. (B) Diffusion time of circulating droplets generated by mixing two aqueous solutions in a 1mm ID channel. (b1) 2 minutes for elongated droplets with L/W> 2, (b2) 30 seconds for drops with 1≤L/W≤2.
The interface between these two dispersed solutions is observed when the drop is formed (Fig. 6A). In our experiments, as the flow is laminar and convection-free due to negligible gravity, mixing proceeds solely by diffusion at the interface.
10
Mixing time inside droplets is described by tmix = stl2/2D, where stl (m) is the striation length, correlated with the channel width in this study, and D (m2.s−1) the diffusion coefficient[32]. Mixing in droplets after their break-up is accelerated by droplets twirling[33] with the continuous flow, solely when droplets are spherical. Figure 6B shows the mixing time observed for droplets of different lengths, circulating within a 1mm ID channel. Obviously, droplet size is a crucial parameter, as we observe that the elongated droplets require a mixing time 4-fold longer than the spherical ones. Hence, droplet size should be matched to specific purpose:
- In elongated droplets, a sufficiently long diffusion time and a convection-free medium yield optimal crystal quality.
- Small droplets with complete and rapid mixing ensure reaction conditions in nucleation screening. However, droplets smaller than the channel width (inner diameter) are mobile in the tubing and risk to coalesce.
Another crucial factor is droplet frequency. Relatively low fD (number of droplets per s -1) is required to reduce droplet coalescence and contamination in case of precipitation. However, in high-throughput gradient screening and optimization trials, the formation of a large number of droplets in long tubing is also required, with high values of f (number of droplets per cm). This is very challenging because droplets are unstable and tend to collapse while circulating in long tubing, due to the non-negligible hydraulic resistance.
Thus droplet characteristics are to be optimized to attain appropriate droplet mixing time, low mobility and low contamination. When dealing with new molecules or solvents in droplet microfluidic studies, the first question to be asked is, how can droplet characteristics (i.e., droplet size, frequency and chemical composition) be predicted with operational parameters such as flow-rates or velocities? In other words, what flow-rates should be applied in order to obtain the droplet characteristics of interest? The operational parameters are flow-rates of continuous and dispersed phases, which we represent with flow velocities vD and vC (flow velocity of dispersed and continuous flows, respectively). However, when dealing with new crystallization solutions in droplet generation experiments, flow properties (i.e. viscosity, interface tension between crystallization solution and oil) also need to be re-evaluated or measured. Hence, we take these flow properties into account by describing the capillary number, 𝐶𝑎 =𝜇×𝑣
𝛾 , where µ and v are the dynamic viscosity ( kg·m
−1·s−1) and the velocity (mm/s) of the continuous flow, and γ the interfacial tension (kg/s2) between the continuous and dispersed flow. To summarize, in our experiments, operational parameters are flow-rate ratios vD/vC, total flow-rates vTOT (vTOT = vD+vC) and capillary numbers Ca.
In a previous study in our group, Candoni et al. investigated the hydrodynamic effects of operational parameters (i.e., vD/vC, vTOT et Ca) on droplet generation regimes and characteristics for PEEK & Teflon circular-channel systems with experiments and simulations, using T-junctions[27]. Empirical relations were determined to define the operating range that ensures homogeneous droplets of ethanol in FC70 oil. In this study, these results are used as an operating protocol of droplet generation without using surfactant. We select a continuous and
11
a dispersed phase, and a droplet size and use the empirical relation to define the operating parameters. This method proves efficient for new solutions.
First, droplets need to be produced in a steady regime. According to Candoni et al., droplet regime behaviour is qualitatively similar for similar values of Ca in both simulations and experimental observations (Fig. 7A)[27]. Squeezing and dripping regimes (Fig. 7 A1 and A2), observed at Ca≤0.2, have proved to be steady regimes with low risk of droplet coalescence. By contrast, a jetting regime, observed at Ca>2 and highly related to vTOT (Fig. 7 A3 and A4), needs to be avoided: in this regime we observed high droplet mobility in the tubing and thus coalescence. Consequently, in order to produce the steady droplet regime, the viscosity and velocity of the continuous flow first need to be adjusted to maintain Ca smaller than 0.2. For oil with a given high viscosity, a steady regime can be defined at a range of low values of vC. This range of vC leads to a large range of vTOT (according to vD), that we call range I.
Fig. 7 (A) Droplet regimes observed at various Ca in channels with inner diameter of 500µm. (A1) and (A2 ) are the simulation and the experimental observation of the squeezing regime, respectively. (A3) and (A4) are the simulation and the experimental observation of the jetting regime, respectively. (B) Plots of droplet size (L/W) (B1) and droplet frequency (fD) (B2) versus (vD/vC) for given vTOT in a 500µm ID channel after[27].
The next step is to tune L/W and fD (number of droplets per s-1), with the operating flow-rates inside the range I of vTOT. Fig. 7B1 represents L/W versus (vD/vC) for given values of vTOT. At a given value of vTOT, the values of L/W increase linearly yet very slightly with the values of vD/vC. Obviously, however, these linear fitting curves of L/W depend more on vTOT. Similar correlation is observed for fD, which is correlated to the previously mentioned droplet frequency f (number of droplets per cm). However, it is interesting to note that the linear fitting curves of fD versus vD/vC show a more increasing trend than those of L/W versus vD/vC. We refer to the scaling law and these linearity correlations in the operating method in a droplet trial. First, we run an experiment with vTOT within range I. Then the value of vTOT is adjusted according to droplet shape observed. After a suitable droplet size is obtained, fD is to be adjusted with vD/vC according to the curve in Fig. 7B2, keeping vTOT constant.
12
Off-line droplet chemical composition
The feasibility of the fine-gradient experiment is firstly verified by the off-line characterization method using aqueous solutions of food dyes. A set of droplets is formed by mixing two food dye solutions (blue and yellow) using the 7-port junction (Fig. 8A). The FMS oil is injected continuously with a constant flow-rate of 4000µL/h. The food dye solutions are injected in Y direction. Unutilized ports of the junction are closed with plugs. The total flow-rates of the two to-be-mixed flows are set constant as well (500µL/h). In a first step, a gradient of chemical composition within droplets is accomplished with only one variation of flow-rate for each aqueous flow. All droplets formed are collected manually and the relative absorbance at 430nm (for blue dye) and 631nm (for yellow dye) are analyzed. We compare the evolution of both values of absorbance within droplets with the utilized flow-rate gradient in Fig. 8B. The evolution of both absorbance values is highly consistent with the programmed flow-rates for both dispersed flows. Nevertheless, as soon as the flow-rate switches to the second value, we observe a stabilization zone for the absorbance expressed within droplets. This stabilization zone is highly synchronized with the rates of both dispersed phases. No matter what flow-rates we apply, the width of the stabilization zone remains the same (~ 25 droplets), showing that the equilibration time (~ 20s) remains the same. However, we also observed that this equilibration time decreases with the inner diameter of the microfluidic junction. In a second step, another profile of progressive flow-rate gradient is achieved with multiple repeated cycles. We compare the evolution of the chemical composition within droplets with the gradient of flow-rates in Fig. 8C. The measurements of droplet chemical composition are correctly estimated by this method. However, the results provide a clear indication that the gradient of chemical composition within droplets is well correlated with the flow gradients of both dispersed phases. Thus, fine gradient screening is achievable using this microfluidic platform.
13 Fig 8 Comparison of the evolution of chemical composition within droplets and the gradient of flow-rates. (A) Diagram ofthe 7-port junction with 2 closed ports. (B) Droplets formed by a gradient with only one variation of flow-rates for both dispersed phases and (C) Droplets formed by a flow-rate gradient with multiple repeated cycles.
Real-time, in-situ UV monitoring of droplet characteristics
The real-time, in-situ UV monitoring of droplet chemical composition is achieved with our platform, utilizing the home-made UV cell. Droplets of lysozyme solution are used as model system. Here, again, no surfactant is added to the protein solution, the spherical shape of the droplets confirms there is no strong adsorption of protein at the interface between oil and protein solution. Parameters of measurements are optimized (integration time, boxcar width, scans to average, etc.) according to the flow-rate in order to achieve a good signal: noise ratio. Real-time absorbance at 280nm is recorded for droplet assays within 500µm and 1mm ID tubings (Fig. 9). Since neither the tubing wall nor oil absorbs at 280nm, the measurements of absorbance are calibrated with tubing filled with oil alone. Real-time signal of the absorbance remains zero when no droplets pass through the optical fibres. The transit of one droplet across the optical fibres results in one peak in the profile of real-time absorbance. Hence, transits of a sequence of droplets correspond to a sequence of peaks (Fig. 9A1 and B1).
14 Fig. 9 Real-time recordings of absorbance at 280nm for different droplet assays. (A1) Droplets of lysozyme solution (13.97 mg/mL) within 500µm ID channel. Integration time is 80ms. (B1) Droplets of lysozyme solution (8.12 mg/mL) within 1mm ID channel. Integration time is 35ms. (A2) and (B2) are enlarged recordings of (A1) in 12.8 −15.7 s and (B1) in 562.8 −566.2 s.
Peak maximum occurs at the moment when the center of the droplet is exactly aligned with the UV beam center. At that moment, the droplet diameter corresponds to the hypothetical optical length (that is to say tube inner diameter). Thus, droplet concentration can be measured. Peak width and peak amplitude correspond to droplet size and relative concentration, respectively. Droplet spacing as well as frequency, i.e. number of droplets per second (f), number of droplets per centimeter (fD), can be analyzed with peak spacing and frequency, respectively. Table 1 shows the results of droplets properties obtained from peak properties of droplet assays in Figure 9. The measured lysozyme concentrations Cmeasured deviate by 6.1% and 7.6% from the real droplet concentrations for 500µm and 1mm ID tubing, respectively. This is due to the deviation between hypothetical and real optical lengths. Actually, the real optical length is always smaller than the hypothetical one (tubing ID), since the droplets do not fill the zone where the UV beam passes through the tubing because the droplets are surrounded by a film of oil and the tubing has a circular section rather than a square one.
15 Tab 1. Analysis and calculation of peak and droplet properties based on analyse of 60 and 113 droplets for 500µm and 1mm ID channel (absorbance at 280nm). Peak properties analyzed: average of amptitude (h), width (t') and spacing (E). Calculation of droplet properties: measured lysozyme concentration (Cmeasured), length (L) and
frequency (f and fD). With vTOT the total flow-rates.
Peak & droplet
properties Units ID 500µm 1mm h a.u. 1.73±0.01 2.04±0.02 E s 0.64±0.06 0.62±0.07 t' s 0.56±0.03 1.02±0.07 VTOT mm/s 2.12 1.77 Cmeasured mg/mL 13.11 7.50 L mm 0.78 1.09 f droplets/cm 5.10 3.54 fD droplets/s 0.83±0.06 0.60±0.05
However, Cmeasured is very useful to indicate the gradient of droplet chemical composition. We therefore used the on-line UV monitoring module to re-characterize the same gradient droplet assay as in Figure 8B (with only one variation of flow-rates). We compare results of the on- and off-line characterization of absorbance at 631nm in Figure 10. Herein, we are not able to analyze the droplet concentration because we do not know the extinction coefficient of the food dye. Nevertheless, the evolutions of droplet concentration are identical for on- and off- line characterization.
Fig.10 Comparison of on- and off-line characterization of absorbance at 631nm within 1mm ID tubing. Droplets are formed using the same flow-rates described in Fig 8B. Integration time is 20ms.
The on-line characterization of a progressive concentration gradient is carried out with the real-time UV monitoring module, by generating droplets of lysozyme with gradients from 3 to 27mg/mL, using 9 steps of 3mg/mL each, within 1mmID tubing using a cross-junction. Two dispersed flows, lysozyme (30mg/mL) and buffer solution (sodium acetate, pH=4.5), are
-50 0 50 100 150 200 250 300 350 400 450 0.0 0.2 0.4 0.6 0.8 1.0 On-li ne Ab sorba nce a t 6 31 nm (a. u. ) Time (s) On-line characterisation 0 10 20 30 40 50 60 70 80 0.0 0.1 0.2 0.3 0.4 0.5 Off-line characterisation Off-li ne Rel at ive a bsorb an ce
16
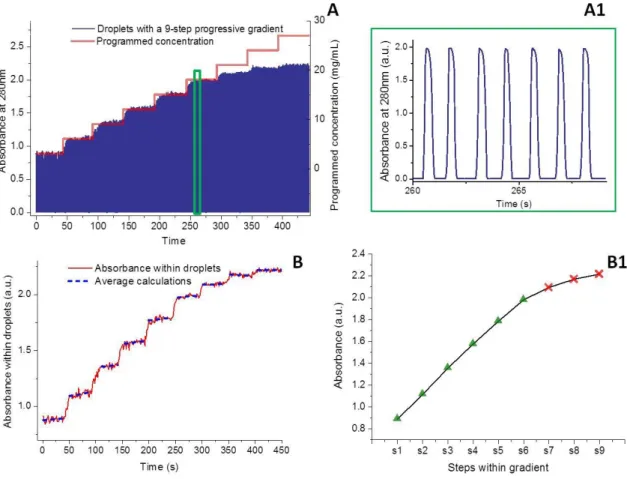
mixed into droplets. Figure 11A compares the programmed concentrations and the online absorbance recording results. We found that the online monitoring results of relative absorbance within droplets are well correlated to the programmed concentrations from 0 to 300s, which correspond to the concentration range of 3-18mg/mL. For high concentrations of lysozyme (from 300s or 21mg/mL), the absorbance measurements are saturated. With data treatment and calculations of the average absorbance within each step, we found that the evolution of absorbance within droplets is linear up to step 6 (18mg/mL). This is in accordance with the linear behaviour given by Beer-Lambert’s law at low concentrations (Fig.11B and B1). The measuring range could be enlarged by using optical fibres with smaller diameters, reducing droplet diameter and working with other tubing wall material (optical properties and thickness of tubings).
Fig. 11 On-line characterization for the droplet assay of lysozyme solutions with a progressive 9-step concentration gradient from 3 to 27mg/mL. (A) Comparison of the programmed concentration gradient and the results of the on-line absorbance recordings. (A1) is enlarged recordings of (A) in 260-268s (green rectangle). (B) On-on-line recording of absorbance within droplets, after data processing of (A). (B1) Evolution of average absorbance within each step of the flow-rate gradient.
17
Fine-gradient screening and optimization of crystallisation conditions
As we have mentioned, one of the toughest issues in droplet microfluidic experiments is the precise handling of solutions with various physico-chemical properties, i.e., viscosity, interface energy, wettability to the tubing wall. Thus, our platform needs to meet more challenging situations of liquid handling and fluidic environment such as membrane proteins. Membrane proteins require agents of crystallization and detergents to solubilize in water. Therefore, we first used lysozyme as model protein (not as complex as membrane proteins) to demonstrate the handling of solutions of viscous precipitants (PEG 5k) and detergent (C10E5) and the feasibility of our platform for fine-gradient screening and optimization.
Preliminary screening is carried out using the microbatch method[11]. To that end, two parameters were varied: concentration of lysozyme from 5 to 40mg/ml, percentage of PEG 5k from 5 to 20%. It should be noted that the detergent concentration was maintained constant at 0.08%
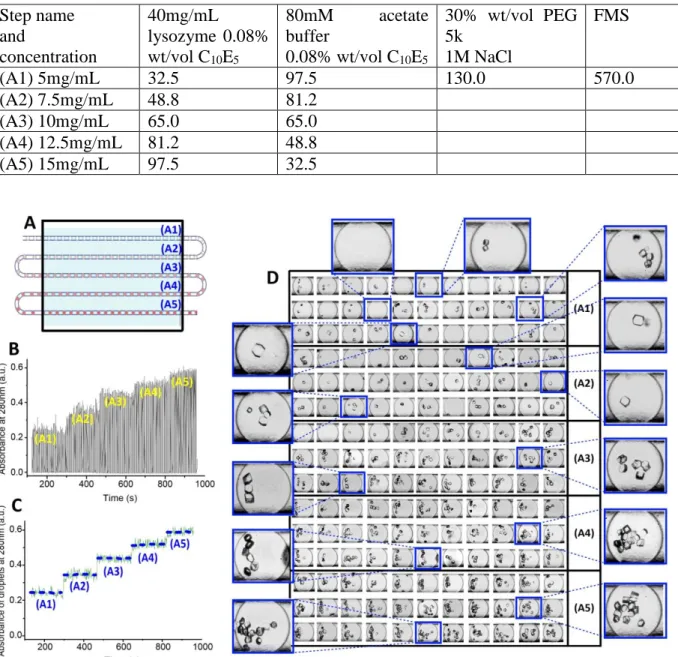
This preliminary screening establishes a large range of potentially optimal conditions (5-15mg/mL lysozyme, 15% wt/vol PEG 5k, 0.5M NaCl, 0.08% wt/vol C10E5) that lead to high quality crystals. Subsequent gradient optimization is carried out with our droplet microfluidic platform within the optimal conditions range established by the microbatch method (Fig.12A). 500µm ID tubing and 7-port junction are used. The dispersed phases are introduced into the three side channels and the continuous phase is injected into the central channel. The operating parameters were selecting using the correlation of fig.7B1 assuming that the effect of the input flowrate in the three side channel for dispersed phase is equivalent to the sum of the input flowrates in a single channel. Experimental operating parameters are given in Tab.2. The parameters that can be varied are the concentrations of the ingredients composing the crystallization solution. We set up the fine gradient by using the approach in which one single parameter, protein concentration in this case, is fine-tuned and indexed at one time. Screening of various parameters could be achieved subsequently. A 5-step concentration gradient of the lysozyme (5-15mg/mL) is set up by keeping the concentration of PEG 5K and C10E5 constant. This 5-step gradient leads to an approximate total of 200 droplets in tubing of 2m approximate length. The whole droplet trial was set up within 1h, consuming solely 50µL of lysozyme substrate solution. Since all droplets are optimized using the hydrodynamic operating method described above, they have identical sizes, frequencies, spacing, etc. Consequently, varying only one ingredient in the same volume of crystallization solution leads to comparable and precise mapping in the crystal phase diagram. Real-time monitoring of droplets is carried out at the same time as droplet formation (Fig.12B&C). Droplet incubation and in-situ observation are accomplished after 24h of incubation at 20°C (Fig.12D). We carefully determined the crystal morphogram and mapped out the transition from mono- to multi-nucleation of crystals for increasing protein concentrations. For instance, mononucleation leads to the growth of large single crystals (>50µm) (insert in Fig.12DA1, A2 and A3). We also observed an increasing number of crystallized droplets with increasing protein concentration. This fine-gradient optimization provides us further optimal conditions (7.5mg/mL lysozyme, 15% wt/vol PEG 5k, 0.08% wt/vol C10E5) that lead to high quality crystals.
18 Tab 2. Flowrate of the different solutions (µL/h)
Step name and concentration 40mg/mL lysozyme 0.08% wt/vol C10E5 80mM acetate buffer 0.08% wt/vol C10E5 30% wt/vol PEG 5k 1M NaCl FMS (A1) 5mg/mL 32.5 97.5 130.0 570.0 (A2) 7.5mg/mL 48.8 81.2 (A3) 10mg/mL 65.0 65.0 (A4) 12.5mg/mL 81.2 48.8 (A5) 15mg/mL 97.5 32.5
Fig. 12 Fine-gradient optimization of lysozyme crystallized in aqueous solutions of PEG 5k (15% wt/vol), 0.5 m NaCl and C10E5 (0.08% wt/vol). 5 steps of lysozyme concentration are (A1) 5mg/mL, (A2) 7.5mg/mL, (A3) 10mg/mL, (A4) 12.5mg/mL and (A5) 15mg/mL. 500µm ID tubing and junction is used. (A) Schematic illustration of droplets formed by the gradient used. (B) Online recording of absorbance at 280nm. (C) Data treatment of (B), which is the online recording of absorbance within droplets. (D) Mapping of crystal morphogram using the 5-step fine gradient (A1-A5).
19
Conclusion
In this paper, we described a universal, high-throughput droplet microfluidic platform for crystallization. The platform offers four modular functions – droplet formation, on-line real-time UV characterization, incubation and observation. First, we validated the generation of droplet arrays with a concentration gradient in continuous long tubing without using surfactant. We controlled droplet properties (size, frequency and spacing) in long tubing by using the hydrodynamic operating method previously described[27]. Our droplet platform successfully handles the complicated chemical environment of membrane proteins and is therefore likely to perform well in other circumstances. We validated the platform for fine-gradient screening and optimization of crystallization conditions. Using only 10µL of a substrate solution, a fine-gradient screen of up to 200 trials can be set up to sample concentration conditions over a 6-fold range by one single operator within one hour. The optimized conditions could be scaled up to obtain larger crystals for structure determination with XRD study. In addition, we expect other on-line detection methods to be integrated into this platform in the future, for instance, on-line diffraction technique. We believe this method could find applications in various fields such as fluid interaction engineering, live cell study, enzyme kinetics.
Acknowledgments
We thank the Institut de Recherche Servier and ANR BAcMolMot (ANR-14-CE09-0023-03) for financial support. We thank T. Bactivelane (CINaM), M. Lagaize (CINaM) and M. Audiffren (ANACRISMAT) for technical assistance. We thank Marjorie Sweetko for English revision.
References
[1] Z. Hammadi, R. Grossier, S. Zhang, A. Ikni, N. Candoni, R. Morin, S. Veesler, Localizing and inducing primary nucleation, Faraday Discussions, 179 (2015) 489-501.
[2] Leng J., Salmon J.B., Microfluidic crystallization, Lab on a Chip, 9 (2009) 24-34.
[3] C. Hansen, S.R. Quake, Microfluidics in structural biology: smaller, faster… better, Current Opinion in Structural Biology, 13 (2003) 538-544.
[4] R.C. Stevens, High-throughput protein crystallization, Current Opinion in Structural Biology, 10 (2000) 558-563.
[5] K.C. Bhargava, B. Thompson, N. Malmstadt, Discrete elements for 3D microfluidics, Proceedings of the National Academy of Sciences, 111 (2014) 15013-15018.
[6] M. van der Woerd, D. Ferree, M. Pusey, The promise of macromolecular crystallization in microfluidic chips, Journal of Structural Biology, 142 (2003) 180-187.
[7] Candoni N., Grossier R., Hammadi Z., Morin R., Veesler S., Practical Physics Behind Growing Crystals of Biological Macromolecules Protein & Peptide Letters, 19 (2012) 714-724.
[8] F.R. Salemme, A free interface diffusion technique for the crystallization of proteins for X-ray crystallography, Archives of Biochemistry and Biophysics, 151 (1972) 533-539.
[9] F. Otálora, J.A. Gavira, J.D. Ng, J.M. García-Ruiz, Counterdiffusion methods applied to protein crystallization, Progress in Biophysics and Molecular Biology, 101 (2009) 26-37.
[10] A. McPherson, The Growth and Preliminary Investigation of Protein and Nucleic Acid Crystals for X-ray Diffraction Analysis, in: Methods of Biochemical Analysis, John Wiley & Sons, Inc., 2006, pp. 249-345.
20 [11] N.E. Chayen, P.D. Shaw Stewart, D.M. Blow, Microbatch crystallization under oil — a new
technique allowing many small-volume crystallization trials, Journal of Crystal Growth, 122 (1992) 176-180.
[12] C.L. Hansen, E. Skordalakes, J.M. Berger, S.R. Quake, A robust and scalable microfluidic metering method that allows protein crystal growth by free interface diffusion, Proceedings of the National Academy of Sciences, 99 (2002) 16531-16536.
[13] W. Du, L. Li, K.P. Nichols, R.F. Ismagilov, SlipChip, Lab on a Chip, 9 (2009) 2286-2292.
[14] K. Dhouib, C. Khan Malek, W. Pfleging, B. Gauthier-Manuel, R. Duffait, G. Thuillier, R. Ferrigno, L. Jacquamet, J. Ohana, J.-L. Ferrer, A. Theobald-Dietrich, R. Giege, B. Lorber, C. Sauter, Microfluidic chips for the crystallization of biomacromolecules by counter-diffusion and on-chip crystal X-ray analysis, Lab on a Chip, 9 (2009) 1412-1421.
[15] Ildefonso M., Revalor E., Punniam P., Salmon J.B., Candoni N., Veesler S, Nucleation and
polymorphism explored via an easy-to-use microfluidic tool, Journal of Crystal Growth, 342 (2012) 9-12.
[16] Ildefonso M., Candoni N., Veesler S., Using microfluidics for fast, accurate measurement of lysozyme nucleation kinetics, Cryst. Growth Des., 11 (2011) 1527-1530.
[17] C.J. Gerdts, V. Tereshko, M.K. Yadav, I. Dementieva, F. Collart, A. Joachimiak, R.C. Stevens, P. Kuhn, A. Kossiakoff, R.F. Ismagilov, Time-Controlled Microfluidic Seeding in nL-Volume Droplets To Separate Nucleation and Growth Stages of Protein Crystallization, Angewandte Chemie International Edition, 45 (2006) 8156-8160.
[18] G.M. Whitesides, The origins and the future of microfluidics, Nature, 442 (2006) 368-373. [19] D.J. Beebe, J.S. Moore, J.M. Bauer, Q. Yu, R.H. Liu, C. Devadoss, B.-H. Jo, Functional hydrogel structures for autonomous flow control inside microfluidic channels, Nature, 404 (2000) 588-590. [20] M.A. Unger, H.-P. Chou, T. Thorsen, A. Scherer, S.R. Quake, Monolithic Microfabricated Valves and Pumps by Multilayer Soft Lithography, Science, 288 (2000) 113-116.
[21] J.C. McDonald, G.M. Whitesides, Poly(dimethylsiloxane) as a Material for Fabricating Microfluidic Devices, Accounts of Chemical Research, 35 (2002) 491-499.
[22] K.A. Shaikh, K.S. Ryu, E.D. Goluch, J.-M. Nam, J. Liu, C.S. Thaxton, T.N. Chiesl, A.E. Barron, Y. Lu, C.A. Mirkin, C. Liu, A modular microfluidic architecture for integrated biochemical analysis,
Proceedings of the National Academy of Sciences of the United States of America, 102 (2005) 9745-9750.
[23] P.K. Yuen, SmartBuild-A truly plug-n-play modular microfluidic system, Lab on a Chip, 8 (2008) 1374-1378.
[24] V. Trivedi, A. Doshi, G.K. Kurup, E. Ereifej, P.J. Vandevord, A.S. Basu, A modular approach for the generation, storage, mixing, and detection of droplet libraries for high throughput screening, Lab on a Chip, 10 (2010) 2433-2442.
[25] M. Ildefonso, N. Candoni, S. Veesler, A Cheap, Easy Microfluidic Crystallization Device Ensuring Universal Solvent Compatibility, Organic Process Research & Development, 16 (2012) 556-560. [26] H. Bruus, Governing Equations in Microfluidics, in: Microscale Acoustofluidics, The Royal Society of Chemistry, 2015, pp. 1-28.
[27] S. Zhang, C. Guivier-Curien, S. Veesler, N. Candoni, Prediction of sizes and frequencies of nanoliter-sized droplets in cylindrical T-junction microfluidics, Chemical Engineering Science, 138 (2015) 128-139.
[28] Hammadi Z., Candoni N., Grossier R., Ildefonso M., Morin R., Veesler S., Small-volumes nucleation, C. R. Physique, 14 (2013 ) 192-198.
[29] J.P. Lafleur, D. Snakenborg, S.S. Nielsen, M. Moller, K.N. Toft, A. Menzel, J.K. Jacobsen, B. Vestergaard, L. Arleth, J.P. Kutter, Automated microfluidic sample-preparation platform for high-throughput structural investigation of proteins by small-angle X-ray scattering, Journal of Applied Crystallography, 44 (2011) 1090-1099.
[30] P.J. Kitson, M.H. Rosnes, V. Sans, V. Dragone, L. Cronin, Configurable 3D-Printed millifluidic and microfluidic 'lab on a chip' reactionware devices, Lab on a Chip, 12 (2012) 3267-3271.
21 [31] S. Zhang, N. Ferté, N. Candoni, S. Veesler, Versatile Microfluidic Approach to Crystallization, Organic Process Research & Development, 19 (2015) 1837-1841.
[32] J.D. Tice, A.D. Lyon, R.F. Ismagilov, Effects of viscosity on droplet formation and mixing in microfluidic channels, Analytica Chimica Acta, 507 (2004) 73-77.
[33] J.D. Tice, H. Song, A.D. Lyon, R.F. Ismagilov, Formation of Droplets and Mixing in Multiphase Microfluidics at Low Values of the Reynolds and the Capillary Numbers, Langmuir, 19 (2003) 9127-9133.