COST EFFECT OF UNIQUELY DESIGNED COMPONENT CHOICES OVER THE PRODUCT LIFE OF A WORKSTATION
by
Anne Paige Di Censo
B.S., Electrical Engineering, Suffolk University B.S., Mathematics, Suffolk University
Submitted to the Department of Electrical Engineering and Computer Science and to the Sloan School of Management
in Partial Fulfillment of the Requirements for the Degrees of Master of Science in Electrical Engineering
and
Master of Science in Management at the
Massachusetts Institute of Technology June 1997
@ Massachusetts Institute of Technology, 1997
Signature of Author 2
Departn( nt of Electrical Engineering Sloan School of Management
Certified by
-r/ John Tsitsiklis
Professor of Electrical Engineering Thesis Supervisor Certified by , 0' Lawrence M. Wein -Professor of Management Accepted by Au ur C. Smith, C)hai an
Committee on Graduate Students, Electrical Engineerin aud Comput*/Sci ce
Accepted by
Jeffrey 4. 4s, Associate Dean Sloan Master's ilnt'Bchelor's Programs
COST EFFECT OF UNIQUELY DESIGNED COMPONENT CHOICES OVER THE PRODUCT LIFE OF A WORKSTATION
by
Anne Paige Di CensoSubmitted to the Department of Electrical Engineering and Computer Science and to the Sloan School of Management
on (date)
in Partial Fulfillment of the Requirements for the Degrees of Master of Science in Electrical Engineering
and
Master of Science in Management
ABSTRACT
A problem currently facing Hewlett-Packard Company's (HP) Computer Systems Organization is whether
the workstation business at HP should be a value-add or commodity business as the personal computer and
workstation businesses collide. Traditionally, the workstation business has found competitive advantage through its use of internally produced, unique components which optimize product performance due to component interplay. By taking as an example one recently released configuration of a low-range workstation product, material costs,
infrastructure costs, and other costs that permeate the supply chain are examined to determine the impact of such choices on supply chain costs and break-even revenue.
Unlike many organizations where the component choices are driven from research and development, many of these choices are driven from marketing research. Thus, choices which seem to start out as a marketing "wish-lists" turn into choices which involve great cost impacts over the life of the product, and sometimes the life of the product family. By tracing the cost impact of internally designed components, especially where industry standard component choices could have been made, we can determine an estimate of the complete cost implications as opposed to material cost alone.
In this thesis, an analysis of the current cost per manufactured workstation, or cost per box, is first
determined. Parameters affecting the cost of components where industry standard or platform leveraged components could be used but are not is then determined. A cost per box analysis is conducted to ascertain the projected
percentage cost savings which would have been realized had the industry standard or platform leveraged commodity been used. Finally, a projected revenue break-even volume is determined for each of the scenarios analyzed. All data have been disguised to protect Hewlett-Packard Company.
The thesis is divided into four chapters. In the first chapter, the problem is introduced. In the second chapter, the modeling techniques used are presented. In the third chapter, various scenarios are presented, explained, and analyzed. In the fourth chapter, conclusions are given, as are recommendations for further study.
Supervisors:
Lawrence M. Wein, Professor of Management John Tsitsildis, Professor of Electrical Engineering
ACKNOWLEDGMENTS
The author gratefully acknowledges the support and resources made available through the
Leaders for Manufacturing Program, a partnership between MIT and major U.S. manufacturing companies. This study would not have been possible without the learning and support I received through the LFM program and my classmates.
Special thanks and appreciation are extended to Brenda Cianci, my internship supervisor at HP, and Larry Wein and John Tsitsiklis, my advisors, for their support and guidance
throughout my internship and beyond.
I wish to acknowledge the access and commitment to this project provided by Hewlett-Packard Company. Everyone I interacted with at HP contributed to my appreciation of the environment and the challenges presented. In particular, I would like to thank the following people at HP for their constant support: the SWIIM team, Mimi Kehoe, Tony Barton, Danielle DeWitt, Drew Doherty, Andy Dubuque, Ed Feitzinger, Diana Garcia, Chuck Hayes, Les
Hoogeveen, Vic Hudson, Nicole Koch, Jim LaRivee, Mike Lessard, Dan McAllif, Tom Merrow, Jim Miller, Gordon Simpson, Mary Suthers, and Paul Tanner.
TABLE OF CONTENTS
ABSTRACT ... 3 ACKNOWLEDGMENTS ... 5 LIST OF ILLUSTRATIONS ... 9 I. INTRODUCTION ... 11 BACKGROUND ... ... 111... STATEMENT OF THE PROBLEM ... 12SIGNIFICANCE OF THE PROBLEM ... 15
OBJECTIVES OF THE INVESTIGATION... 20
SCOPE AND LIMITATIONS OF THE PROJECT ... ... . 20
ASSUMPTIONS AND DEFINITIONS .. ... ... 21
Assumptions ... 21
Definitions ... 22
METHODS AND MATERIALS FOR INVESTIGATION ... . 24
PREVIEW OF THE REST OF THE REPORT ... ... 24
CHAPTER SUMMARY ... 24
II. MODELING ... 27
WHAT DO WE HAVE TO WORK WITH?... ... 27
OVERVIEW OF MODEL BUILDING ... 29
Major elements ... 29
Resolving Leveraged Components ... 31
DESCRIPTION OF ELEMENTS ... 32
Infrastructure Costs... 32
Inventory Holding Cost ... 34
After Production Support Costs... 38
Material Cost ... 41
Transportation Cost ... 41
Supplier Costs... 41
M anufacturing C osts... 43
COMPILATION OF THE MODEL ... 44
Platform Leveraged and Industry Standard Calculations ... ... 44
SCENARIO BUIL DING.. ... 45
Scenarios... ... ... .. ... 45
CHA PTER SUM M ARY ... ... 46
III. THE RESULTS ... 49
EXAMPLE OF COSTS FOR I/O PCA CHOICES ... 49
MATERIAL COST FOR CURRENT, INDUSTRY STANDARD AND PLATFORM L E V E R A G ED ... 52
SIGNIFICANT INFRASTRUCTURE COSTS ... ... 54
SIGNIFICANT SCENARIOS ... 55
RISK POOLING ADVANTAGES ... 59
WHAT DID NOT HIT THE RADAR: OTHER CONSIDERATIONS ... 63
CHAPTER SUM M ARY ... 66
IV. CONCLUSIONS AND RECOMMENTATIONS ... 67
SO, WHAT DOES THIS MEAN? ... 67
RECOMMENDATIONS FOR FURTHER ANALYSIS ... 69
APPENDICES ... ... 71
RA W D A TA RESU LTS ... 71
RAW M OD EL NUM BERS ... 72
ASSUMPTIONS - DETAILED ... 79
BIBLIOGRAPHY ... 83
LIST OF ILLUSTRATIONS
FIGURE 1 STAGES OF WORKSTATION LIFE: CONCEPTION TO AFTER END OF LIFE ... 16
FIGURE 2 MODELING FLOW CHART OF COST EFFECTS ... ... 28
FIGURE 3 LIST OF COMPONENTS WHICH COULD BE CHANGED TO INDUSTRY STANDARD OR LEVERAGED ACROSS PLATFORMS ... 29
FIGURE 4 HIERARCHY OF COST CATEGORIES ... ... 30
FIGURE 5 MATERIAL DEMAND FOR FIELD MATERIAL USAGE ... 39
FIGURE 6 CARRYING COST FOR SUPPLY MATERIALS ORGANIZATION... 40
FIGURE 7 SCENARIO RECONCILIATION OF INFRASTRUCTURE COST CHANGES ... 46
FIGURE 8 COST EFFECT OF DECISION TO UNIQUELY DESIGN I/O PCAS FOR APOLLO WORKSTATION 51 FIGURE 9 POTENTIAL MATERIAL COST SAVINGS PER COMPONENT ... . 52
FIGURE 10 CURRENT COMPONENT COST CATEGORIES ... ... 53
FIGURE 11 PROPOSED COMPONENT COST CATEGORIES ... ... 53
FIGURE 12 SCENARIO COST SAVINGS ... ... 55
FIGURE 13 TOTAL POTENTIAL SAVINGS OVER THE LIFE OF THE PRODUCT ... 56
FIGURE 14 METHOD FOR DETERMINING THE MAGNITUDE OF SAVINGS SEEN BY THE COMPANY ... 57
FIGURE 15 VOLUME DIFFERENCE FOR INDUSTRY STANDARD WITH CONSTANT GROSS MARGIN ... 58
FIGURE 16 REVENUE DIFFERENCE FOR INDUSTRY STANDARD WITH CONSTANT GROSS MARGIN... 59
FIGURE 17 COMBINED COMPONENTS ... 60
FIGURE 18 EXAMPLE OF DEMAND VARIABILITY... 61
FIGURE 19 EFFECT OF RISK POOLING TWO COMPONENTS ON DEMAND FLUCTUATIONS ... 62
I. INTRODUCTION
BACKGROUND
Hewlett-Packard Company (HP) currently manufactures workstations which, like all workstation manufacturers, are internally designed and unique to the OEM (Original Equipment Manufacturer). The research contained in this thesis was provided by the researching the workstation manufacturing in the United States, specifically in Exeter, New Hampshire, with Marketing and Development located in Chelmsford, Massachusetts and Fort Collins, Colorado. Additional background was obtained from HP's server manufacturing in Roseville, California, and corporate resources in Palo Alto, California.
Hewlett-Packard moved their U.S. based workstation manufacturing to Exeter, NH after acquiring Apollo Computer in 1990. A significant amount of work has been done in Exeter to optimize manufacturing processes. As a result, the actual final assembly and test of the
workstation entails minimal direct labor and minimal direct cost. In tandem, much effort has been expended on optimization of their supply chain. Work in the supply chain optimization continues, as does in manufacturing, but the major impact difficulties in these areas have been solved and the more complex issues are now being studied. It became apparent to selected management at HP that the cost of materials and material holding is the next area where relatively low effort levels can reward the company with substantial cost reduction benefits.
The cost of components is increasingly important in the workstation industry, whereas it was not a major concern only a few years ago. When looking at the changing nature of the workstation industry, it is apparent that within the next three to four years, there will be
significant shake-ups in the areas of standardized components, performance considerations, and margins which can be realized from workstation sales. Currently, unlike the personal computer industry, there is little which is common from one manufacturer to the next. There is no
standardized processor, graphics platform, or operating system, though components such as hard drives, CD ROMs, monitors, and power supplies are extremely similar from one OEM to the next. The differences between these components from one manufacturer to the next could be simple such as different colored plastics or interconnects, or as complex as having all
components except small chips unique from one manufacturer to the next. With the more complex items, similar structure and internal components may be seen from one manufacturer to the next, allowing the part to pass for industry standard. Since there is no true standard, we define "industry standard" as a component using standard technology with minimal tooling,
development, and cost incurred by the supplier due to unique OEM design. When looking at Hewlett-Packard Company's workstation manufacturing business, there has been extensive work
in the areas of manufacturing cycle time, delivery performance, supply chain maintenance, and, of course, component interconnect performance due to product design. The area which has been brushed aside during these other optimization efforts is material cost and an effort to use either industry standard components or components they currently are sourcing for other workstation designs.
STATEMENT OF THE PROBLEM
As more components move toward industry standard, HP must choose between a philosophy endorsing purchase of off-the-shelf, or industry standard, components or endorsing internally designed unique components. Currently, the rhetoric points toward procurement of
industry standard components but the culture of the company leans toward uniquely designed parts. While this is fundamentally a make versus buy decision, the benefits and drawbacks of each choice are not well known. Considerable academic research has been conducted in the area of component sourcing decisions (Kumpe, et. al., 1988., Prahalad, et. al., 1990., Ulrich, 1993., Venkatesan, 1992., Welch, et. al., 1992., Whitney, 1988.). Literature supports the premise that a component should be designed and manufactured in-house if some characteristic of the
component adds significant value to the company, or if the component performance or
manufacturing processes offer the company a competitive advantage. In short, if designing and manufacturing a component adds competitive advantage, then part fabrication should be kept in-house, otherwise it should be outsourced. As Whitney emphasizes, though, there is no simple cost analysis way of looking the make versus buy decisions (Whitney, 1988). The decisions must be constantly reviewed and revised based on standards in the market and the competence of the OEM, as well as the suppliers.
There is a movement within the workstation industry, which is struggling to establish standards as to the components used within the workstation, the processor necessary to control the workstation, and software - both operating systems and applications. This push is driving down the price of the workstations, putting a squeeze on the 40% plus gross margins typical for the industry. As margins continue to shrink and as the performance of outside competitors, especially Sun Microsystems, Intel, and Microsoft, continues to increase rapidly, costs associated with workstation manufacturing will need to decline.
While a move toward industry standard components is necessary for maintaining its future competitive advantage, Hewlett-Packard faces a major challenge in altering the mindset of
the development and marketing teams who define component choice. Unique components are designed such that the interconnect between all of the components improves, which in turn boosts the performance of the entire workstation system. The major drawback is cost. Added dollars in terms of development, material purchase price, and inventory holding, to name a few, beg the reader to ask whether the interconnect and component improvements truly boosts performance enough so that the average consumer is lured into purchasing this workstation. Also, it can be argued that similar performance can be achieved using industry standard components in an altered configuration.
A cost analysis case study was performed on HP's Apollo 260 low-end workstation from a materials point of view in order to capture the true cost which is added to the workstation over the life of the product due to using uniquely designed components. Below is a description of the project, the research methods and models used, results obtained, additional concerns which do not appear in the cost calculations, lessons learned, and recommendations. Areas investigated include material cost of the major sub-assemblies of the workstation, infrastructure necessary to support these components, supplier maintenance, inventory, development, manufacturing, quality and testing. The major sub-assemblies include monitors, mass storage, chassis / mechanical assembly, power supply, graphics cards, central processing unit, I/O interface cards, memory, hardware, labels / packaging, and cables / connectors.
Each of the major sub-assemblies was placed in one of three categories: unique internally designed components which are used solely in the Apollo 260 workstation (unique), uniquely designed components which are leveraged across the Apollo family of workstations and other families (platform leveraged), industry standard components based on the definition given earlier
(industry standard). Note that if a component is industry standard and leveraged across multiple platforms, it is considered to be industry standard.
Various scenarios were developed by moving fewer than the maximum projected available components from uniquely designed to either industry standard or platform leveraged components. The expected goal of this analysis is to understand the cost / performance trade-off in workstation designs. In short, is the extra cost worth the increased performance or ease of design / manufacturability that was realized through the current component choice? In order to get a true benchmarking of the costs differences, development and marketing decisions were not considered. The main reason is that the marketing and development teams have well-analyzed
reasons for making the choices they did based on the metrics which guided them. This study is
not intended to question their decisions, but rather to take a look at how those decisions drove cost throughout the life of the processor platform. Consequently, the view of this project is from a manufacturing / order fulfillment perspective, and should not be used in any way to analyze the decision quality of HP's marketing and development groups. In this thesis, data has been
disguised in order to protect the interests of Hewlett-Packard Company.
SIGNIFICANCE OF THE PROBLEM
First, it is necessary to understand the culture of Hewlett-Packard as well as the path a workstation takes through its life. Hewlett-Packard was founded as an engineering company and has found its niche by offering high quality, technically advanced products geared to meet the needs of engineers and scientists. In the 1980's, HP began to offer consumer driven products, but held on to the importance of designing superior products.
Due to the culture of HP, the voice of the customer, and satisfying the customer's latent needs is paramount in the conception and design specifications of products. Therefore, it is not surprising that most of the product constraints and performance characteristics are determined by the Marketing department. After the product performance and appearance metrics have been determined, the project is then handed off to the development stage. Development takes a number of forms in any complex product, including system development as well as component development. The definition of the components and the system is determined concurrently, but the development of the components is done individually, then brought together into a prototype product.
Marketing Component Manufacturing SMO
defines Development full volume materials support of
characteristics defines component production product after end of life architecture
System New Product Introduction AMMO
Development defines manufacturing production of product defines system processes brings product toward end of life
architecture into production
Figure 1 Stages of workstation life: conception to after end of life
Before the workstation is released for a system qualification, each of the internal components must go through electrical, mechanical, safety, or other distinct qualifications. As the system is brought together, it is handed off to the New Product Introduction (NPI) groups who work closely with development, marketing, and manufacturing to insure that everyone is satisfied with the product, i.e., that all constraints have been satisfied. The system, through the NPI team, is
sent through system qualifications and brought into full production within each of the
manufacturing facilities world wide. As the workstation nears end of life, and volumes decrease, production is moved into AMMO, a low-volume, job shop environment which is similar to the
mainline manufacturing in process. After end of life, the Supply Materials Organization (SMO) takes responsibility of the workstation, spare parts, and servicing of its installed base for a period of five years after the last workstation is produced.
Though the marketing functions determine product performance and constraints,
development determines the material cost, which currently comprises between 80% and 85% of the total costs over the life of the workstation family. There is a separate development team working to design each workstation family at HP. So, the team developing Family A may not come in close contact with the team concurrently developing Family B. This may be where a disconnect occurs with the use of platform leveraged components, as each team is designing their own unique parts to optimize performance of their particular platform. Also, each development team is measured, as a financial bottom line, on the manufacturing cost of the workstation. They are given a dollar figure, estimated as the manufacturing cost of the system, and instructed to stay below that amount. As long as they have developed a workstation with a projected material cost below this figure, they have satisfied their metric. Development teams are not focused on the costs of all systems, supply chain complexity, or the possibilities that they may have been able to
develop a box which would cost half of the projected amount, if some of the constraints were relaxed. In short, the people who have the biggest hand in determining the final cost of the workstation platform over its life are not measured in any way that may push to focus on these costs or to reduce the costs. In addition to the straight material cost, there are many infrastructure costs which are driven by, and measured on, the material cost. The big hitters in infrastructure which is driven by material include Field Engineering, Supply Maintenance Organization (the after-sales support division for Hewlett-Packard), inventory holding, material engineering, and procurement.
Along with these cost impact areas, any engineering decision which does not take advantage of industry standard or platform leveraged components affects a myriad of functions throughout the life of the product. Many of these functions are listed below:
* Planning and Documentation: As the number of distinct part numbers increases, personnel necessary to support inventory management, manufacturing processes, bill of materials management, and manufacturing planning schedules increases.
* Procurement: The time necessary to manage supplier relations for a uniquely designed component is greater that that for an industry standard component. Similar to the planning function, the number of distinct part numbers forces an increase in headcount to support the purchase of the components.
* Test: Test routines must be developed for each component which is offered in the
workstations. If a component is used in more than one workstation, the same test programs may be used for both systems. If, however, components in each workstation are unique, a separate testing code must be developed to support each of the unique components. In the case of the testing function, it does not matter whether the component was internally designed or purchased off-the-shelf.
* Tooling: For any new component which is designed, appropriate tooling must be developed for use by the suppliers. This additional tooling adds cost to the components, whether the cost is rolled into the component price or is charged to the workstation manufacturer separately.
* Qualifications: Material qualifications must be performed on three levels: component, interconnect, and system. If one part is leveraged between systems, the component
qualifications do not need to be duplicated. If two parts are leveraged between systems, the interconnect qualifications between these two parts does not need to be duplicated.
Qualifications add cost in engineer's time and the cost of the component. As parts are going through qualification, their cost could be as high as four times the cost during full-volume manufacturing.
* Delivery performance, Assurance of Supply, Re-work, Obsolescence Exposure, Cycle Time: Each time a component is added to the system, especially if it is uniquely designed, risks as to the above mentioned performance metrics increase.
* Inventory Levels, Risk Pooling: When components are used in one workstation, rather than in many workstations, inventory levels must rise in order to maintain the same desired service level to the manufacturing floor. Consequently, risk pooling which could be taken advantage of in order to further reduce inventory stock levels would not be available if components were not platform leveraged.
* AMMO (low volume /job shop): As the workstation approaches the end of its production life, it is moved to a low volume, job shop area called AMMO. In order to maintain delivery levels which will satisfy customers, components needed to produce all workstation families for the shift must be available. As the number of platform leveraged components decreases, the amount of material on the floor must increase. Along with added difficulties in the manufacturing process due to increased material, the risk of damage to the inventory increases as more is placed on the job shop floor.
* Failure Rates: Uniquely designed components will typically have higher failure rates toward
the beginning of their life. As the supplier works down the learning curve and corrects the causes of the failure rates, or the designers find it necessary to re-design the component, the failure rates may equal or exceed those of industry standard components. However, if the components are not leveraged across multiple platforms, it is likely that the product's end of life will come before the failure rates are adequately reduced.
* Spare Parts Support and Field Support: All components must be held in support inventory for a number of years after production ends on the workstation. Non-leveraged components cause higher inventory and reduce opportunities for risk pooling of material.
OBJECTIVES OF THE INVESTIGATION
The basis of this research is focused on answering the following two questions:
4 What volume increment is necessary to cover the cost of using unique, non-platform
leveraged components in the workstation design?
* What cost reductions could HP make while maintaining the same operating profit if a larger
percentage of industry standard components were used in place of unique, non-platform leveraged parts?
SCOPE AND LIMITATIONS OF THE PROJECT
This project studies the costs associated with the Apollo 260 workstation produced by Hewlett-Packard throughout the life of the workstation, including all infrastructure necessary to support the development, manufacture, and field support of the workstation and the materials
necessary in constructing the workstation. Scenarios outlining the possibilities for materials choices in the workstation if either industry standard or platform leveraged components had been used and associated cost savings which could have been realized are contained herein.
This project is a post-mortem study. The changes suggested cannot be directly implemented by HP. It is the hope of the author that the lessons learned from past materials choices, and outlined in this study, will be of benefit to HP in their future workstation designs.
As this project looks at the life of one low-range workstation produced by Hewlett-Packard's Exeter, NH manufacturing division, it is in scope limited. First, the study is not intended to give an accurate description of total costs which could be saved on each workstation processor platform, but rather areas which can be significantly improved, using the cost savings for the Apollo 260 as an example of the possible scale of cost savings. Second, the project is limited in that it does not fully consider the strategic decisions and their effect in the design stages of the workstation. The majority of the limitations are listed in the following section.
ASSUMPTIONS AND DEFINITIONS
Assumptions
The major assumptions are listed below, with the balance of detailed assumptions listed in the appendix:
* The volume of workstations sold over the life of the product does not change in any scenario. This protects the outline of the project in its efforts to de-couple findings from marketing and forecasting concerns.
* The volume over the product life is assumed to be 20,000 units, which is consistent with historical and currently forecasted demand of similar level products.
* The product life of the Apollo workstation is 18 months, which is consistent with typical
product life in the workstation industry at the time of this study.
* The connect rates for components as they stand at the time of this study is assumed to be the
constant average over the life of the product. Since the Apollo 260 is in full production mode at this time, the connect rates currently utilized are extremely close to life averages.
* The percentage of Hewlett-Packard's world wide workstation infrastructure costs allocated to the Apollo 260 are equal to the percentage of the processor's volume as compared with HP's world wide workstation volume.
* The percentage of components used in Apollo compared to other workstations is constant
over the life of the processor.
Definitions
* AMMO: Low volume and job shop assembly and test area. * Box: Another term for one workstation.
* Component: Major sub assembly of a workstation.
# Connect rate: The average number of systems built which contain the given component. For
example, for the Apollo 260 a floppy drive has a connect rate of 0.27. Thus, 27% of the Apollo 260 workstations built over a given period of time will contain a floppy drive.
+ CSO: Computer Services Organization. * FAST: Final Assembly and Test.
+ Industry standard: A component is considered to be industry standard if it employs standard technology with minimal tooling, development, and cost for the supplier due to unique
requirements, and requires minimal development time for the manufacturer.
* MRP: Materials Resource Planning system - an inventory, order, and manufacturing planning software.
* OEM: Original Equipment Manufacturer + PCA: printed circuit board assembly
* Platform leveraged: A component is considered platform leveraged if exact part number is used for more than one product family, and the component is not considered to be industry standard.
* SMO: Support Materials Organization.
* SPaM: Strategic Planning and Modeling team.
* SWIIM: Strategic Worldwide Initiative Integration Management team. SWIIM performs long range planning analysis for WSY.
METHODS AND MATERIALS FOR INVESTIGATION
In order to research the components, their costs, and issues relating to whether or not they are industry standard or platform leveraged, interviews with approximately 120 HP employees including commodity buyers, strategic planners, manufacturing, quality, and planning personnel, and engineers working with new products and current products were conducted. Benchmarking and verification was determined through conversations with corporate procurement engineers. HP's scenario planning team, SWIIM, and scenario modeling team, SPaM, were utilized to help in developing models and analyzing information. Models developed by SPaM, SWIIM, and SMO were leveraged for this study and integrated into a self-designed modeling structure.
PREVIEW OF THE REST OF THE REPORT
This thesis is divided into four chapters. In the first chapter, the problem has been introduced. In the second chapter, description around the modeling techniques used are
presented. In the third chapter, various scenarios are presented, explained, and analyzed. In the fourth chapter, conclusions are given, as are recommendations for further study.
CHAPTER SUMMARY
As Hewlett-Packard's Workstation manufacturing division (WSY) moves into the future with its workstation manufacturing, a serious look has to be taken at the costs incurred through design of unique components. By the turn of the century, it is expected that the face of the workstation industry will change substantially, due to new entrants driven by Intel and Microsoft, and profit margins will decrease as workstations become more modular and commoditized. In
order to capture the lifetime costs associated with internally developing unique components as opposed to using off-the-shelf industry standard parts or even leveraging components designed for other models within their workstation portfolio, one low-end recently released workstation was examined, the Apollo 260. It will be shown in the remainder of this thesis that
approximately $27.1 million (10% of the lifetime costs for the processor platform) could have been saved by utilizing available industry standard components.
II. MODELING
WHAT Do WE HAVE TO WORK WITH?
The main goal of the Workstation division (WSY) at Hewlett-Packard is to increase operating profit. As the margins in the workstation industry decrease, increasing operating profit will become vital. Currently, the operating profit of WSY is similar to the profit realized by the
PC division of HP, even though the gross margins in workstations is magnitudes greater than
what is seen in personal computers. In order to scope the costs which cut into the operating profit, and to look for avenues to increase the profitability of WSY, two routes were examined: the cost of material for the Apollo 260 workstation, and the infrastructure necessary to support those parts. Comparisons were made with scenarios in which a larger number of parts were industry standard or platform leveraged. On the material side, the fewer components which are industry standard or leveraged, the farther out on a limb HP places itself in terms of demand variability of the components, lead time variance, part cost, risk pooling of material, forecast error, cost of quality, and transportation costs, among others. Each of these areas increases the material cost of sales and increases inventory write-offs due to obsolescence, scrap, defects, and inventory shrinkage, thus cutting into the operating profit which could be realized. Looking down the infrastructure path, non-industry standard and non-platform leveraged components increase the number of parts to be supported, the number of suppliers, and the number of processes, including part life support, necessary to maintain manufacturing continuity. Consequently, more people, and thus a larger infrastructure, is necessary to support the
*
Intvenory
jWrite-offs
Figure 2 Modeling flow chart of cost effects
This suggests that increasing industry standard or platform leveraged parts would in turn increase operating profit. What remains is to determine how to capture and classify the effects of these component changes, and how much additional operating profit could be realized through such changes.
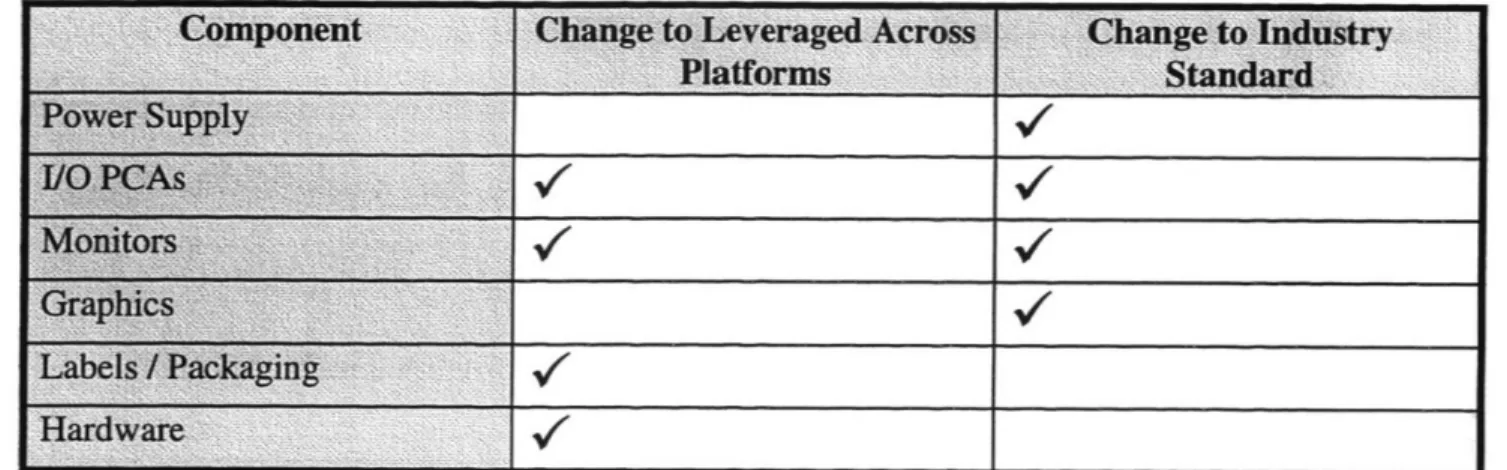
First, it is necessary to examine the component currently used in the Apollo 260. There are a number of components within the Apollo 260 which are not currently industry standard, but where industry standard components do exist which could be utilized by HP without decreasing their competitive advantage. Components which fall into this category include the power supply, I/O PCAs, monitors, and graphics. Likewise, there are components which are not currently
leveraged across platforms which could be with future designs. Falling into this category include
I/O PCAs, monitors, labels / packaging, and hardware.
# Part Numbers # Suppliers # Processes
(including part
life support) • : #4Industry Std Parts# Platform Leveraged Parts # Configurations . :-Forecast Error Cost of Quality Transportation Cost . . ... ....ii jiiii:: i:. ... :
r'
00-I Variability ime >st olingI
I---I
Component Change to Leveraged Across Change
to
IndustryP*r S mpl Plastforms Standard
G3raphkics
Labels / Packaging
/
Hardware
V
Figure 3 List of components which could be changed to industry standard or leveraged across platforms
OVERVIEW OF MODEL BUILDING
In order to better capture the costs associated with using components which are not industry standard or platform leveraged, it was necessary to obtain current costs within eight basic areas, as well as how those costs would change if industry standard or platform leveraged parts had been chosen in the design of the workstation. Microsoft Excel was used for this model. The remainder of this chapter is devoted to a description of the eight areas within infrastructure, inventory holding, and material costs, development of the model used to evaluate total cost over the life of the processor, and scenarios considered to determine the impact on cost had alternate material choices been made.
Major elements
Eight major elements of cost exist within the development of the model used:
Infrastructure, Inventory, After Production Support, Material, Transportation, Supplier, Quality, and Manufacturing. While detailed cost categories exist within most of these larger categories,
the extent to which each effects the total cost of the system varies greatly. The following section describes in detail the composition of cost drivers, as well as specific modeling used within each of the elements. The chart below defines the hierarchy of cost categories which are explained throughout the remainder of the chapter. Many of the lowest level cost categories were omitted from this chart for clarity, though all cost categories considered are listed in the Appendix.
Figure 4 Hierarchy of cost categories
The highest level is to consider the total, burdened cost of the workstation throughout the product's life. Digging down one level, we can divide the burdened cost into two categories: (1) materials cost, which is comprised of the bill of materials cost for producing the workstation in full-production mode, and (2) infrastructure and inventory costs, which capture the indirect costs associated with the workstation over the processor's life as it is supported by HP. Infrastructure costs can be broken down into strict infrastructure costs, such as development and production
costs, as well as transportation costs, cost of quality, and after production support costs. Within each of these areas further detail can be defined.
Resolving Leveraged Components
For accurate modeling of the components and processes which affect the cost of the workstation, it was necessary to detach the costs associated with the Apollo 260 from the total cost of given functions and component procurement without altering dynamics of the system. For example, if we were to determine the costs associated with developing a new power supply and attributed the total development cost to the Apollo 260, even though the power supply is leveraged across other platforms within WSY, the total cost of developing the Apollo 260 would be overstated. Similarly, accounting the inventory holding cost of the power supply to Apollo
260 would also overstate the cost. Conversely, if the inventory holding calculations were based
on demand and standard deviation of demand for the Apollo 260 exclusively, the amounts which would be charged to the workstation could be either overstated or understated due to the nature of the standard deviation. Therefore, the total demand for each component is used in calculating all cost elements, with the percentage of the demand used in Apollo 260 of the total demand for the component being the actual cost allocated to the workstation's total burdened cost, i.e.,
Cost of component attributed to Apollo 260 = (total cost of component) / (percentage of total demand for component which is attributable to the Apollo 260)
total cost of component
Cost of component attributed to Apollo 260 =
The demand which is directly attributable to the Apollo 260 is determined by the demand of the Apollo 260 CPU (central processing unit), the only element in the workstation which has a 100% connect rate, i.e., there is a one to one demand relationship between Apollo 260
workstations and Apollo 260 CPUs. It should be noted that many of the components used in manufacturing an Apollo 260 workstation are optional components. Thus the connect rate shown is less than 100%, yet the component is not considered to be platform leveraged.
DESCRIPTION OF ELEMENTS
The methods for determining the cost in each of the major categories is listed below. Actual data compiled is shown in the Appendix.
Infrastructure Costs
Infrastructure costs represented include costs to Hewlett-Packard which are attributable to the development and support of the Apollo 260 workstation. In order to capture these costs, it was necessary to collect information, estimated in some cases, regarding the personnel time and resources expended during the processor's development. Many of the component costs were available as a portion of the total development cost, rather than as individual contributors to the total cost of the workstation. It was necessary, therefore, to determine the total cost and reconcile to component cost in a later step. The reconciliation process is described later in this chapter. Areas of cost which fall into this category include:
* Headcount: Calculated by summing the worldwide headcount costs for workstations over a 1.5 year period, multiplying by the percentage of worldwide workstation revenue volume
over a 1.5 year period which is attributable to the Apollo 260 workstation. The Current Product Engineering, Test Development and Implementation, Incoming Material Test, and Strategic Procurement headcount figures were eliminated from the above summation in an effort to more accurately capture these costs, as they are all functions which have potential for significant improvement under various materials choice scenarios.
* Current Product Engineering: Calculated as the cost of engineering time for full project
-based on 0.7 engineer/month over the life of 8 months. It is estimated that for 2 distinct projects, it would take 16 months of manpower, where if the second project were leveraged off of the first, the second project would take only 2 additional months, as opposed to a full 8 additional months, with the first project taking the full 8 months in either case.
* Information /Documentation: The development cost of new process diagrams for technical reference manuals, assembly line process packages, and user documentation.
* Development: The cost of development per component is calculated to be the development cost of the component multiplied by the percentage of total demand which is attributable to
the Apollo 260. The sum of costs for all components in the workstation produce the development cost of the workstation.
* Strategic Procurement: Calculated as the sum of all cost included in procurement personnel time and associated costs in qualifying vendors, materials, and negotiating price.
The following areas / functions were considered in the cost analysis for HP Infrastructure costs, but it was determined that the cost attributed to the function was completely captured by the
Headcount costs, or that the amount not captured through Headcount costs were insignificant and could be disregarded:
* Design for Assembly/Manufacturability * Planning
* Operator Training (Assembly and Test)
Inventory Holding Cost
Inventory levels at Hewlett-Packard are determined through use of the base stock, or economic order quantity, method common in inventory holding literature (Jordan, et. al., 1995). The basic premise behind this method is to determine a reorder quantity, R, such that the
inventory held protects for average demand during replenishment lead time plus safety stock for above-average demand. When the inventory level falls to R, a specified order amount is placed. Theoretically, this will allow the manufacturer to have raw materials inventory on hand when needed based on a given service level desired and demand variability, but will not require the manufacturer to carry excess inventory. By reducing the amount of raw materials inventory carried by the OEM, the cost of carrying the inventory is reduced and the service level to the customer is increased. The inventory holding cost is defined to be the cost of carrying the inventory between the time it arrives in the factory's warehouse to the time it is used in production. Costs can come from inventory shrinkage, obsolescence, damage, and the cost of
physical space required to hold the excess inventory. This inventory holding cost is determined at HP historically as a percentage of average inventory cost incurred due to the above factors of the total inventory used over one year.
The inventory holding cost is calculated for each component individually. The total demand for the component was used to calculate this value, not simply the portion of the demand attributable to the Apollo 260 processor. Inventory Holding cost modeling assistance was
provided by HP's Strategic Planning and Modeling (SPaM) team, and is a version of their single node model for inventory holding calculations. The major components used to calculate
inventory holding include
* fill: the desired service level for the Exeter facility, defined to be the percentage of time an
order comes in and the part is needed for the order and the part is available in inventory. The fill rate target for WSY is 98.5%.
* rev: review period of the component. Materials buyers reviewed all components using HP's
MRP inventory management system weekly.
* freq: frequency of shipment receipts, expressed in weeks between receipts. Calculated as the
mean time between shipment receipts over a period of six months.
* dem: mean weekly demand. Calculated as the mean total monthly demand for the
component over a period of six months, divided by 4.3 to obtain weekly demand.
* sd: weekly standard deviation of demand. Calculated as the standard deviation of total
monthly demand for the component over a period of six months, divided by 4.3 to obtain weekly demand.
* It: mean supplier lead time in weeks. Calculated as
+ (average difference in actual lead time from quoted lead time per month) + (average in-transit lead time)
for a period of twelve months
SlItsd: standard deviation of supplier lead time in weeks. Calculated (Hogg, et. al., p.91) as
Itsd = Avg(actual lead time -quoted lead time)2 - (Avg(actual lead time
- quoted lead time))2
where the arguments are averaged per month over a period of twelve months. Since the standard deviation of in-transit lead time over a period of twelve months was significantly small, less than 1 day, it has been disregarded for these calculations.
In order to approximate a normal distribution for service levels greater than 81% using Microsoft Excel without creating a lookup table, is was necessary to include a number of intermediate calculations which approximate the normal distribution using the solution to the quadratic formula,
quad_a = 0.37 quad_b = 1.19
(Qx(l - fill) quad_c = 0.92 + Log sdEXPdem - fill)
where
sdXPdem= (sd2 x (t
+
rev)) + dem2
+
tsd
2
The equation sdEXPdem calculates the standard deviation of the pipeline demand. The pipeline consists of the supplier lead time plus the review period.
Additional intermediate calculations to approximate the normal distribution include
temp_ y = max(O, (quad_ b2 - 4 x quad._a x quad_ c))
-quad b
+
ftemp
y
temp_ x =
2 x temp_ a
The maximum function is added into temp_y to insure that the positive root of the quadratic equation is used to accurately represent the desired service level, demand, lead time, and standard deviations of demand and lead time provided. Any negative root of the quadratic equation would not only represent an incorrect approximation, it would be technically unfeasible since it is impossible to have negative values for any of the input variables.
The final calculations in determining the inventory is Safety Stock Inventory = temp_x x sdEXPdem Cycle Stock Inventory = freq/2 x dem
Average Inventory = Safety Stock + Cycle Stock In-Transit Inventory = Mean Demand x In-transit time Total Inventory = Average Inventory + In-Transit Inventory
Multiplying the total inventory by the cost of the component, the value of inventory can be determined. From this, the inventory holding cost, defined as the cost of inventory damage, obsolescence, shrinkage, and physical holding, is determined as
Inventory Holding = Value of Inventory x (25% + 7% cost of capital)
After Production Support Costs
Two main areas comprise after production support costs: (1) field material usage, and (2) the supply materials organization. Each of these organizations support material after production ends for products coming from all divisions of HP, not just the workstation and server divisions. Field material usage refers to the material and carrying costs associated with engineering service and repair in the field. This will include machine set-ups and replacement of incorrect or
damaged components. The support materials organization (SMO) is responsible for supporting components for a period of five years after the end of production. Components which can be refurbished or repaired after production ends instead of scrapped are brought into SMO. Similarly, SMO is responsible for supporting material for all HP equipment for an extended period of time and is responsible for the material and carrying costs. Information and modeling assistance for the after production support section of the model was provided by SMO. The total demand for the component was used to calculate these values, not simply the portion of the demand attributable to the Apollo 260 processor.
Field Material Usage: The field material usage is defined to be the amount of material that will be necessary to service an installed base of machines for twelve years after the end of production. The total demand for field material over the twelve year period is calculated as
demand = installed base x AFR
where AFR is the annual failure rate of the component. The majority of the forecasted material needed is expected to be used within the first half of the support life, as shown by the figure below. 16%/ 14% 12% 10%/0 8%/0 6% 4% 2%" 0% 1 2 3 4 5 6 7 8 9 Year 100% 90% 80% 70% 60% 50% 40%/ 30% 20% 10% 0% 10 11 12
% yearly carrying cost
-- +% total carring cost
Figure 5 Material demand for Field Material Usage
The support cost for a component after production is then calculated to be
I( x (current material cos t) x (demand per year)) summed over the 12 years of product support.
Supply Materials Organization: Unlike field material usage, supply materials organization works under the assumption that no more than 100 units of inventory for any given item are expected to be in stock at any one time, regardless of the installed base for the component. The total costs for any component supported by SMO is calculated to be the
I
(carrying cos t + lost opportunity cos t) + field scrap costsummed over the seven years (1.5 years of production, 5 years of support) the component is supported.
The carrying cost per year is calculated as
Carrying cost per year = 15% x (material cost)
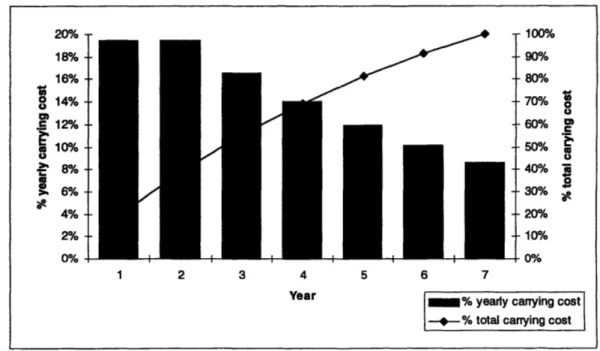
with a 15% decline rate per year beginning in the third year. Thus the inventory holding calculations for any component supported by SMO has the following characteristics:
20% 18% 16% 14% 12% 10%0 8% 6% 4% 2% 0%0 -t 1 - 4a -- -F 100% 90% 80% 70% 60% 50% 40% 30% S200/0 - 0% --0% 2 3 4 5 6 Year
% yearly carrying cost -- 0-% total carrying cost
Figure 6 Carrying cost for Supply Materials Organization
Lost opportunity cost is calculated to be 15% of the cost of the component multiplied by the amount of inventory forecasted to be held. In the third year, the calculated opportunity cost is decreased by 15% per year for the remaining years.
Field scrap is calculated to be 75% the cost of the component multiplied by the average amount of inventory per year forecasted for the seven years of support.
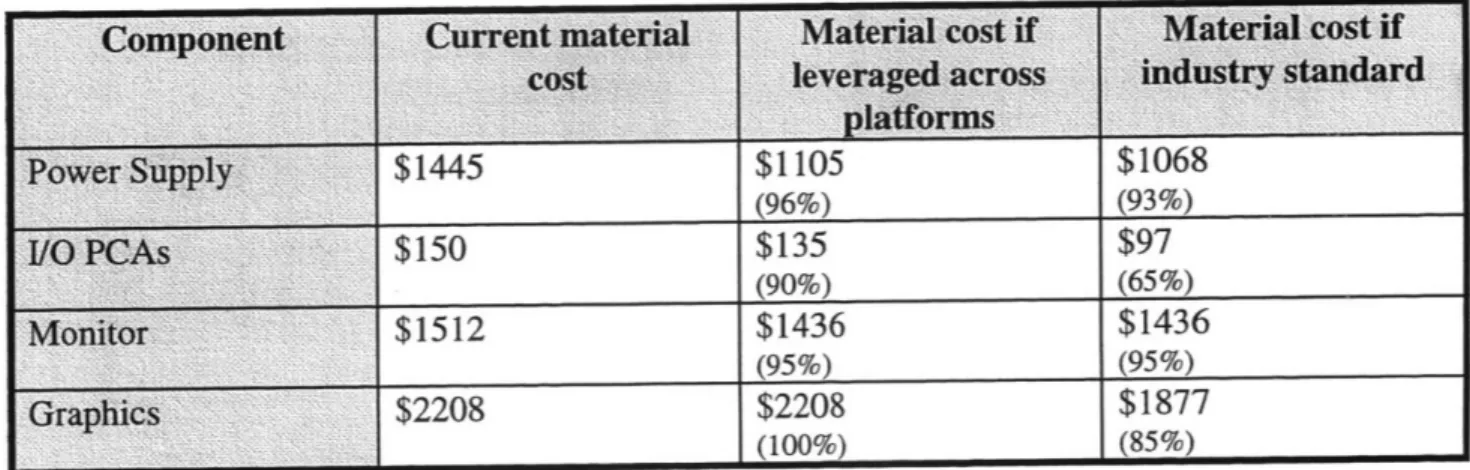
Material Cost
The current material cost as of April 1, 1996 for each component was obtained. Cost of industry standard or platform leveraged materials which were comparable in performance but not used in the Apollo 260 were also obtained.
Transportation Cost
Air, ocean, and land transport costs were obtained per commodity. Using data over a six month period, the average percentage of components shipped through each channel was
calculated. The transportation cost per component is calculated to be: transportation cost = ($ air x-port) x (% air x-port)
+ ($ ocean x-port) x (% ocean x-port) + ($ land x-port) x (% land x-port) + (duty cost (if sourced off-shore))
Supplier Costs
* Supplier Tooling: The cost required to manufacture and assemble unique tooling for the supplier which is required in order to produce components which are required by HP only. In all components for the Apollo 260, it is not expected that tooling will need to be replaced. * PCA Setup: Calculated as the overhead incurred per year from board changes within HP's
the board. This number is multiplied by 1.5, to cover the production life of the processor, and the number of boards included in the Apollo 260.
* Assurance of Supply and Delivery Performance: Though these costs for all components were included in the Strategic Procurement cost, the items are mentioned here for
completeness.
Risk to Hewlett-Packard: Defined as the cost of inventory (in any stage) which the supplier charges to HP for material which can be sold only to HP and must be scrapped or retrofitted for another OEM, multiplied by the percentage risk that demand will fluctuate outside of the range acceptable for the supplier as negotiated in their contract.
Cost of Quality Initial Qualification: Cost per system is calculated as
Initial qualification = 4 x (material cost of system) x (number of qualified systems). Usually 48 units go through qualification. If the product is platform leveraged, only 54
systems total (as opposed to 96) would need to be qualified. For this calculation, it is assumed that the systems may be sold, thus the unrecoverable cost is
3 x (material cost) x (number of qualified systems).
There is a risk, however of the systems failing qualification and being scrapped. It should be noted that neither the risk nor the additional cost has been modeled here.
Material Qualification: Material qualification costs were often included in contracts between HP and the supplier. For internal suppliers, it is assumed that even though the WSY division
is not saddled with the cost of material qualification, it is still a cost to the company, thus it is included in this study. Items such as power supplies or PCA boards must pass additional safety qualifications. The Material Qualification costs is a summation of all such costs. * Incoming Material Test: Calculated as
Incoming Material Test = Average number of parts per hour which can be inspected x lot batch inspection size
x labor rate
The variability for this function is significantly low, thus for the purposes of this model it has been omitted.
* Test Development / Implementation: Calculated as the estimated work hours (weeks) of time required to develop and implement test procedures on a new component, multiplied by the cost of a fully burdened engineer.
Manufacturing Costs
All significant manufacturing costs are captured in (1) Headcount costs for the personnel,
(2) Inventory Holding, which accounts for the cost of capital, and (3) Cost of Quality, in the areas of incoming material test, and test development and implementation. Although there are no additional costs attributed to the model directly through the manufacturing function, the element of possible cost is noted for completeness.
COMPILATION OF THE MODEL
From this point on, the model consists mostly of simple arithmetic. First, three major categories of cost had been determined: Infrastructure, Material (or Component), and Inventory. All of the Infrastructure costs captured were previously scaled to a direct one to one relationship with the Apollo 260 workstation. However, Component and Inventory costs have not yet taken into account the differences in demand between total component demand and the percentage of that demand which is directly attributable to the Apollo 260. Therefore, to calculate the total component cost for the workstation, the total cost for each component is multiplied by the percentage of demand which is directly attributable to Apollo 260. The sum of such adjusted component costs, multiplied by the forecasted 20,000 unit volume and the component connect rate, makes up the given Component cost category. Likewise, the total inventory holding cost is calculated in a similar fashion.
By simply adding the Infrastructure, Component, and Inventory costs, it is possible to get the burdened cost of the workstation. The average burdened cost per workstation sold is equal to the burdened cost of the workstation divided by the 20,000 unit volume.
Platform Leveraged and Industry Standard Calculations
The above calculations to determine the current cost for the workstation was repeated in determining projected costs of the Apollo 260 workstation had platform leveraged or industry standard components been used. Some of the information used for the projected costs was not available, thus approximations and assumptions were necessary. A list of the detailed
SCENARIO BUILDING
Up to now, the total current cost of the Apollo 260 workstation has been determined, and
the projected costs for a workstation using additional platform leveraged components (I/O PCAs, monitors, labels / packaging, and hardware) or additional industry standard components (power supply, I/O PCAs, monitors, graphics). Necessity called for determination of the relative importance of changing each component, i.e., scenario analysis, and sensitivity analysis surrounding key components. Extensive sensitivity analysis was conducted surrounding cost estimates in either industry standard or platform leveraged scenarios, to gain an understanding of the importance of accuracy in those cost categories.
Scenarios
Forty five scenarios were considered to determine the relative importance of changing individual or multiple components from either industry standard to platform leveraged
components. No scenarios included both industry standard and platform leveraged changes due to the complexity of assumptions which would have to be made in this case. It was the
expectation that the results of such an analysis would produce a "garbage in, garbage out" effect due to a large number of unknowns.
For each scenario, some but not all of the components were changed, as were the associated data categories. In order to accomplish this, an Excel spreadsheet was developed which would gather Material cost and Inventory cost information from one of three categories: "HP current costs", "Platform Leveraged costs" or "Industry standard costs."
When some, but not all components were changed, it was necessary to alter the Infrastructure costs, based on a weighted average between the scenario the component was
moving from to the scenario the component was moving toward. If there were not many component changes, it was reasonable to assume that the infrastructure costs would not be
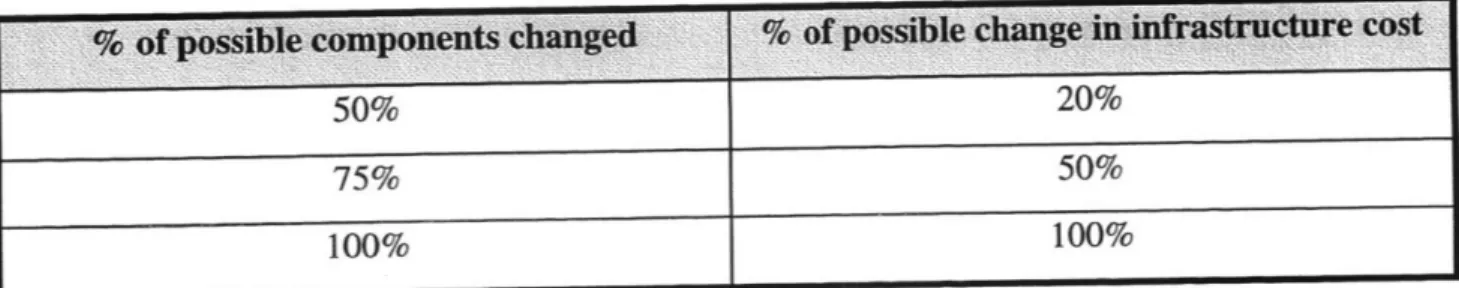
greatly affected, since the majority of infrastructure costs are internal to HP in the forms of headcount and related functions. In practice, it is not feasible to remove a fraction of a person, which would occur in the model if minor process changes were made that did not have a significant effect on the internal infrastructure. Thus, a minimum of 50% of the total possible component changes had to have been made for the scenario to alter the infrastructure category.
Letting the possible change in infrastructure cost be given as the difference between the current infrastructure cost and the industry standard or platform leveraged infrastructure cost, the calculation for determining changes in are as follows:
% of possible components changed % of possible change inm infrastruture cost
50% 20%
75% 50%
100% 100%
Figure 7 Scenario reconciliation of infrastructure cost changes
CHAPTER SUMMARY
To capture the costs which could be saved through use of industry standard components or platform leveraged components, costs relating to a component throughout the processor life were captured. The industry standard components which were examined include: power supply,
I/O PCAs, monitors, and graphics. The platform leverageable components which were examined include: I/O PCAs, monitors, labels, packaging, and hardware. Cost categories which were examined include: infrastructure, inventory, after production support, material, transportation, supplier, quality, and manufacturing. Using a Microsoft Excel spreadsheet model, costs attributed to each of these categories for each component were captured. In order to equitably
attribute the cost of a component which is used in additional workstations other than the Apollo 260, the total costs attributed to the component was multiplied by the percentage of the part used for Apollo 260 workstation manufacture. Additionally, components which were considered both platform leveraged and industry standard were classified as "industry standard" in order to
simplify modeling processes. In order to determine components adding the highest cost to the system, or those which would give the biggest cost savings, forty five scenarios were examined. Sensitivity analysis was performed on each of the scenarios to ensure cost savings were within a range to produce accurate results.
III. THE RESULTS
EXAMPLE OF COSTS FOR
1/O
PCA CHOICESTaking as an example of the costs that accumulate through the life of the workstation, on
the Apollo 260, a decision was made to use non-industry standard I/0 PCAs, even though
industry standard components which could match the technical specifications exist. The limiting factor which drove the decision to use internally designed components was the size and
packaging of the I/O PCAs which were available through standard suppliers at the time of development. The material cost, which determines the largest portion of cost within the
workstation, is 35% higher ($150 compared to $97) for the chosen component over comparable performance I/0 available. When the difference in cost, $53, is multiplied by the projected volume for workstations of 20,000 units of the 18 months of the processors life, an additional $1.06 million is added to the total cost of the platform. While this is the largest area where savings could be realized with the I/O, the decision creates a domino effect, driving costs throughout the supply chain. The areas most significantly impacted by this decision are listed below.
* Strategic procurement: The cost of strategic procurement, $5,000, while not a large amount in itself is significant in that the function could be virtually removed if industry standard components were used. The effort involved in acquiring and maintaining suppliers which can handle the uniquely designed component at relatively low volumes while maintaining high levels of quality and on-time delivery is far higher than if industry standard components
components while multiple sources are typically available for industry standard components. This increases the level of dependence of HP on a specific supplier, thus the effort to make sure that supplier is living up to the standards HP has set is also increased.
* Initial qualification: The initial qualification function involves verification of the system performance and reliability. This cost could be reduced by 27% by utilizing industry standard components, from $34,000 to $25,000. The principle costs in qualification are in engineering time and risk of material scrap. When a uniquely designed part is produced for qualifications, the cost of the part is typically four times that of the production volume cost. If the system passes all qualifications, it can be sold, though the extra material cost is not recovered. If the system fails any qualification, it must be scrapped and set back to development. Taking into account the difference in probability of industry standard
components passing qualification and uniquely designed components passing qualification, notable savings could be realized in this area.
* Test development and implementation: For each new component, new programs need to be written and implemented in order to adequately test the functionality of the element, at a cost of $20,000. If the component was industry standard, the process for testing functionality would already be determined, thus the effort required to produce test routines would be
minimal - virtually zero.
* Inventory holding: Since inventory holding is directly tied to the cost of the component, the savings seen in inventory holding costs would mirror savings seen in material cost. Other factors, such as shrinkage and obsolescence would also reduce the inventory holding exposure by 83%, from $74,000 to $12,000 with the use of industry standard parts.