A Critical Analysis of Bulk Precipitation
Recycling Models
by
Jean Anne Fitzmaurice
S.B., Electrical Engineering, MIT
M.S., Engineering-Economic Systems, Stanford University
Submitted to the Department of Civil and Environmental Engineering
in partial fulfillment of the requirements for the degree of
Doctor of Philosophy
at the
MASSACHUSETTS INSTITUTE OF TECHNOLOGY
February 2007
©
Massachusetts Institute of Technology 2007. All rights reserved.
Author ...
m ...
"
&p*epartment of
..
Civil an...
Civil and Environmental Engineering
January 12, 2007
Certified by....
.-. m .- .---
'......-
Rafael L. Bras
Edward A(. Abdun-Nur Professor of Civil and Environmental
A1,e
rI/1
Engineering
Supervisor
A ccepted by ...
OF TECHNC)OyMY
FEB
2
2
2007
JLIBRAR IE,;
Andrew J. Whittle
Chairman, Departmental Committee on Graduate Students
'ARCHIVES
A Critical Analysis of Bulk Precipitation Recycling Models
by
Jean Anne Fitzmaurice
Submitted to the Department of Civil and Environmental Engineering on January 12, 2007, in partial fulfillment of the
requirements for the degree of Doctor of Philosophy
in the field of Civil and Environmental Engineering
Abstract
Precipitation recycling is the contribution of local land evaporation to the precipita-tion of a region. The significant local evaporative contribuprecipita-tion to rainfall in many continental regions highlights the potential importance of land-atmosphere feedback. This thesis addresses three common assumptions in bulk precipitation recycling mod-els: (1) the use of time-averaged data (2) the neglect of the atmospheric storage term and (3) the well-mixed assumption.
Bulk precipitation recycling models have been criticized for their use of monthly mean data in estimating moisture influx, which does not capture the diurnal and synoptic variations important in hydrology. This work uses a method to compute moisture influx using the atmospheric data at the finest time-scale available. Smaller monthly recycling ratio estimates were found when using this new method.
Most previous recycling studies are monthly. The atmospheric storage term is added to an earlier recycling model to study the submonthly time-scale. The south-west Amazon region during the wet season is investigated. There the synoptic con-ditions consist of alternating easterly and westerly regimes of three to fourteen day duration. The resulting recycling ratio spatial patterns are shown to reflect the syn-optic circulation patterns.
Two parameters are introduced to relax the the well-mixed assumption in the Bras and Eltahir model. Information from a water vapor tracer study and atmo-spheric reanalysis data are used to estimate parameter values. Applying this model to the central United States region during the summer, using four years of data, finds 30 percent larger recycling ratios than those resulting from the original well-mixed assumption. This formulation is generalized to another bulk recycling model. A quantitative assessment of the quality of two atmospheric reanalysis datasets used as input to recycling models is also provided.
Thesis Supervisor: Rafael L. Bras
Acknowledgments
Thanks to my advisor Professor Bras for his help in completing this thesis. I would also like to thank Prof. Entekhabi for his helpful comments about the presentation of the thesis. I thank Prof. Eltahir for his advice and comments.
Hanan Karam for ferret sofware expertise and discussion about reanalysis data. Jingfeng Wang for his original work on time-dependent recycling. Frederic Chagnon, Lejo Flores, Gautam Bisht, Ryan Knox and Valeriy Ivanov for help in maintaining the computers and software in the group. Thanks to Gautam, Frederic, Valeriy and Ujjwal Narajan for feedback on practice thesis talk. Nicole Gasparini, Daniel Collins and other former group members.
NCAR Data Support Systems (DSS), Boulder, Colorado, for help in accounts and obtaining reanalysis data. Wes Ebuzekial of NOAA for the NCEP R-2 first guess data. I also obtained some data from NOAA CDC ftp archive.
This research was supported by NASA TRMM (Tropical Rainfall Measuring Mis-sion) grant NAG5-13638 and a Martin Family Foundation fellowship.
Dr. Hugh Robinson for math discussion. The MIT Writing Center and MIT SIPB (Student Information Processing Board) were very helpful.
Thanks to Parsons Lab alumni Dr. Sanjay Pahuja and Dr. Holly Michael. Dave Kuo, Peter Israelsson, Yoshi Tajima, Brian White, Andrea Adamo, Alison Sleath, Yuki Tanino, Susan Dunne, and Mack Durham at Parsons. Moshe "what is your defense?" Alamaro for his enthusiasm. Dr. Chien Wang and Dr. Andrei Sokolov have served as great role models.
Thanks to my friends at Ashdown. It is a really special place. Appreciation to Sushil Kumar, Ed Cho, Madhu Nikku, Gaurav Bhalla, Tai Sakuma, Daniel Nagaj, Muyi Ogunnika, Dan Cogswell, Shan-Yuan Ho (Hoho) and Chung Chan. John Hempe and Sanjeeb Bhuyan for their advice and Will Leight for listening. Diana Quinlan for her daily cheer.
Thanks to my family. Julie, George and Elizabeth. My mother Rose and father George.
Anxiety in the heart causes depression
but a kind word makes it glad. Proverbs 12:25
Contents
1 Introduction 23
1.1 Water cycle over land ... 23
1.2 Precipitation recycling ... ... ... . . 23
1.2.1 Historical problem in hydrology . ... . 23
1.2.2 Precipitation recycling ratio . ... . . 24
1.2.3 Precipitation recycling and land-atmosphere interaction . . .. 24
1.2.4 Precipitation recycling and land use . ... 25
1.2.5 Continental regions where recycling is important ... . 25
1.2.6 Trends and maxima/minima of recycling ratio ... . 26
1.3 Methods to estimate precipitation recycling . ... 27
1.3.1 Bulk precipitation recycling models . ... 28
1.4 Problem and scope ... ... . 34
1.4.1 Time-averaged data ... ... 35
1.4.2 Synoptic time-scale precipitation recycling . ... 35
1.4.3 Well-mixed assumption ... ... 36
1.4.4 Thesis outline ... ... 37
2 The effect of moisture flux characterization on recycling 45 2.1 Introduction ... ... 45
2.2 Two moisture flux estimation methods . ... 46
2.2.1 Time-averaged method ... ... 47
2.2.2 Accumulation method ... ... 47
2.2.4 Analysis ... ... ... 49 2.3 Data ... ... ... 52 2.3.1 Reanalysis data ... ... ... 52 2.3.2 Data computation ... .... ... .. . . 52 2.3.3 Other data ... ... 53 2.4 Recycling models ... ... . 53 2.5 Results ... . ... 55 2.5.1 West Africa ... ... ... 55 2.5.2 North America ... ... 61
2.5.3 South America- Amazon ... .. 67
2.6 Discussion ... ... 70
2.7 Summary ... . . ... . . 73
2.8 NCEP Reanalysis format ... ... 75
3 Synoptic time-scale precipitation recycling 81 3.1 Introduction ... ... . ... ... 81
3.2 Model derivation ... ... .. . ... ... 83
3.3 Method ... . ... . . .... . 85
3.4 Moisture flux and synoptic regimes . ... 88
3.5 Recycling results ... ... . 90
3.6 Discussion ... . ... 91
3.7 Summary ... ... 96
4 Relaxing the well-mixed assumption 101 4.1 Introduction ... ... ... 101
4.2 Background ... ... 102
4.3 Approach ... ... ... 104
4.3.1 Eltahir and Bras (1994) recycling model . ... 104
4.3.2 Definitions ... ... 105
4.3.3 Well-mixed assumption ... ... 107
4.3.4 Relaxing the well-mixed assumption . ... 107 10
4.3.5 Rederivation of Eltahir and Bras recycling model 4.4 Example . . . . ...
4.4.1 Data . . . . ... 4.4.2 Parameters . . . ... 4.4.3 Recycling results . . ... 4.5 Generalizing to other models ... 4.6 Discussion . . . . ... 4.7 Summary . . . . ...
4.8 Derivation including well-mixed assumption . . . .. 5 Comparing reanalysis datasets using analysis
5.1 Introduction . . ...
5.2 Reanalysis background ... 5.2.1 Model differences ...
5.2.2 Boundary layer parameterization . . . 5.2.3 Radiation ...
5.2.4 Soil moisture ... 5.3 Data and processing ... 5.4 Results . . . ...
5.4.1 Specific humidity ... 5.4.2 Wind fields ... 5.5 Discussion . . ... 5.6 Summary . . ... 5.7 Analysis increment data ...
increments
5.8 Specific humidity from relative humidity . .... ...
6 Conclusion 6.1 Sunimary of Results . . . . . . . 6.2 Future directions ... 109 110 110 110 114 116 119 124 126 131 131 133 134 134 134 134 135 135 135 138 141 143 147 . 153 155 156 158
List of Figures
1-1 Relationship between 1D bulk precipitation recycling models. The general 1D model is presented in Drozdov and Grigoreva (1965), which is in the form of an integral. A particular case is used in Brubaker et al. (1993), Equation 1.4, which assumes constant E and P. The Budyko model is a special case of this model with constant Pa and Pm. ... 29 2-1 Simple box region example. Southwesterly flow occurs half the time.
Moisture flux vector Q=(100,100). . ... 48 2-2 Simple box region example. Northwesterly flow occurs half the time.
Moisture flux vector Q=(100,-100). . ... 48 2-3 Time-averaged method, I. Moisture influx along west boundary (bold
line), y. ... ... ... .. 48
2-4 Accumulation method, I,. Moisture influx along south and west bound-aries (bold lines), 1y. is moisture influx. . ... 49 2-5 Accumulation method, 12. Moisture influx along north and west
bound-aries (bold lines), 2. ... ... 49
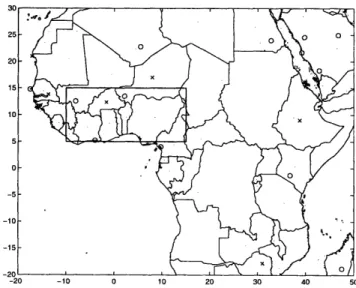
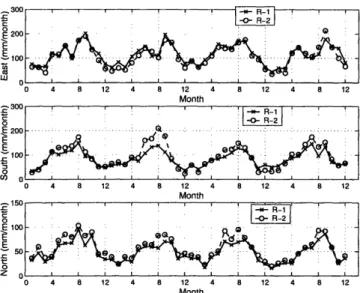
2-6 West Africa region. Radiosonde stations used in NCEP/NCAR R-1 Reanalysis, o = twice daily observation, X = once daily sounding at 12. (J. Woollen, NCAR) ... ... ... 55 2-7 West Africa region, Monthly (positive) moisture fluxes into region,
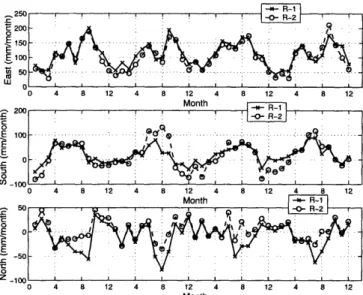
1998-2001. Top: eastern, middle: southern, bottom: northern border. 56 2-8 West Africa region, Monthly net moisture fluxes into region,
2-9 West Africa, Monthly mean evaporation in region, 1998-2001. NCEP R-1 and NCEP R-2 reanalysis. ... ... 59 2-10 West Africa region, Monthly regional average precipitation, 1998-2001.
source: TRMM 3B43 (v.5). ... .... .. 60
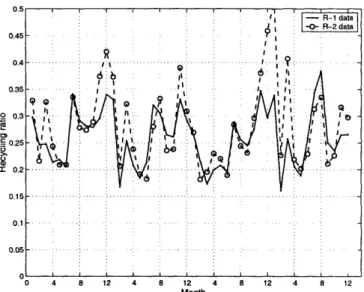
2-11 West Africa region, Monthly recycling ratio estimate for 1998-2001. Eltahir and Bras (1994) recycling model using accumulated moisture fluxes. NCEP R-1 and R-2 reanalysis data. . ... 60 2-12 West Africa, Monthly recycling ratio estimate for 1998-2001. Eltahir
and Bras (1994) recycling model using monthly time-averaged verti-cally integrated moisture flux vector Q. NCEP R-1 and R-2 reanalysis
data ... . . .. ... 61
2-13 West Africa, Brubaker et al. (1993) recycling model using monthly accumulated moisture flux, 1998-2001. . ... . 62 2-14 West Africa, Brubaker et al. (1993) recycling model using monthly
time-averaged vertically integrated moisture flux vector Q, 1998-2001. 62 2-15 Central U.S. region. Monthly (positive) moisture fluxes into region,
1998-2001. R-1 and R-2 reanalysis data. . ... 63 2-16 Central U.S. region, Monthly mean evaporation in region, 1998-2001.
NCEP R-1 and NCEP R-2 reanalysis data. . ... . 63 2-17 Central U.S., Monthly recycling ratio, 1998-2001. Eltahir and Bras
precipitation recycling model, Accumulated moisture fluxes method. NCEP R-1 and R-2 reanalysis data. ... 65 2-18 Central U.S., Monthly recycling ratio, 1998-2001. Eltahir and Bras
(1994) spatial precipitation recycling model, Time-averaged Q method. NCEP R-1 and R-2 reanalysis data. . ... 65 2-19 Central U.S., Monthly recycling ratio, 1998-2001. Brubaker et al.
precipitation recycling model, accumulated moisture fluxes method. NCEP R-1 and R-2 reanalysis data. ... 66
2-20 Central U.S., Monthly recycling ratio, 1998-2001. Brubaker et al. pre-cipitation recycling model, time-averaged Q method. NCEP R-1 and
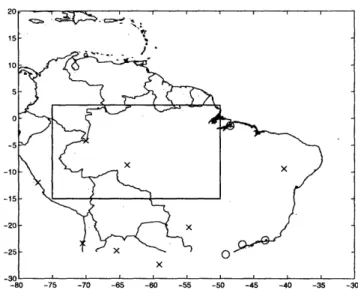
R-2 reanalysis data ... . . ... 66 2-21 Amazon region. Radiosonde stations used in NCEP R-1 reanalysis. o
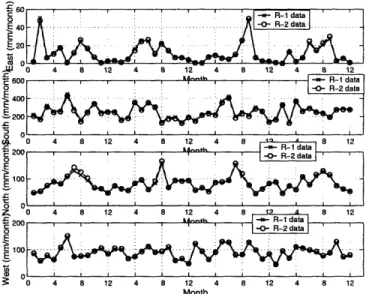
= twice daily soundings, X = once daily sounding at 12 (J. Woollen, NCAR). ... . ... . 67 2-22 Amazon region. Monthly (positive) moisture fluxes into region ,
1998-2001... .. ... ... 68 2-23 Amazon region. region, Monthly mean evaporation in region,
1998-2001. NCEP R-1 and NCEP R-2 reanalysis data. . ... 69 2-24 Amazon region. Monthly regional average precipitation, 1998-2001.
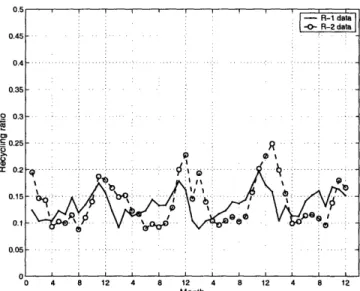
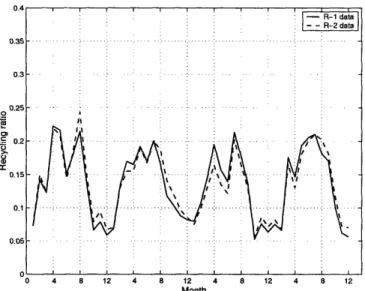
source: TRMM 3B43 (v.5). ... 69 2-25 Amazon region, Monthly recycling ratio estimate for 1998-2001. Eltahir
and Bras (1994) recycling model using accumulated moisture fluxes. NCEP R-1 and R-2 reanalysis data. . ... 70 2-26 Amazon region, Monthly recycling ratio estimate for 1998-2001. Eltahir
and Bras (1994) recycling model using monthly time-averaged verti-cally integrated moisture flux vector Q. NCEP R-1 and R-2 reanalysis
data ... . . . ... 71
2-27 Amazon region., Brubaker et al. (1993) recycling model using monthly accumulated moisture flux, 1998-2001. . ... 72 2-28 Amazon region, Brubaker et al. (1993) recycling model using monthly
time-averaged vertically integrated moisture flux vector
Q,
1998-2001. 723-1 Amazon region. TRMM-LBA region is subregion. Radiosonde stations used in NCEP R-1 reanalysis. o = twice daily soundings, X = once daily sounding at 12 (J. Woollen, NCAR). . ... . . 87
3-2 Zonal wind at 850mb, NCEP R-1 reanalysis, Jan-Feb. 1999. TRMM LBA-region. Top: spatial average. Bottom: 5 day moving average. Easterly and westerly regimes can be identified using zonal wind at 850mb (Peterson et al.2002). Also see Table 3.1, indexed by Day of Year (DOY) ... .... .. ... 88 3-3 Amazon region. Consecutive synoptic regimes Jan.19-February 28,
1999, (A)-(F). Time-averaged vertically integrated moisture flux vec-tor
Q
= (Qx, Qy) (kg m- 1 s- 1) associated with denoted easterly(E1,E2,E3) and westerly (W1,W2,W3) regimes. Computed from NCEP-NCAR (R-1) model sigma reanalysis data. Inserted box is TRMM-LBA region. See Table 3.1 for information on synoptic regimes. . .. . 89 3-4 Amazon region. Precipitation recycling ratio. (A) January 16-18, (B)
19-21, (C) 22-24 and (D) 25-28, 1999. Dotted box is TRMM-LBA region. 92 3-5 Amazon region. Precipitation recycling ratio. (A) January 29-31, (B)
February 1-3, (C) 4-6, (D) 7-9, 1999. Dotted box is TRMM-LBA region. 93 3-6 Amazon region. Precipitation recycling ratio. (A) February 10-12, (B)
13-15, (C) 16-18, (D) 19-21, 1999. Dotted box is TRMM-LBA region. 94 3-7 Amazon region. Precipitation recycling ratio. (A) February 22-24, (B)
25-27, 1999. Dotted box is TRMM-LBA region. . ... . 94
4-1 Vertical distribution of local moisture. Fraction of local moisture by atmospheric level. Northern Plains (circles) and Southern Plains (dot-dash). Derived from Bosilovich (2002, Fig. 5), summer months (June, July, August). . ... ... 113 4-2 Beta parameter estimate. Southern Plains vertical distribution (see
Fig. 4-1) ... ... 113 4-3 Beta parameter estimate. Northern Plains vertical distribution (see
4-4 Monthly precipitation recycling ratio, summer months (June, July, Au-gust) 1998-2001. Central US region (32.5N:42.5N,105W:85W). NCEP R-1 sigma-level data. Original model corresponds to /y = 1. ... 115 4-5 Monthly precipitation recycling ratio, summer months (June, July,
Au-gust) 1998-2001. Central US region (32.5N:42.5N,105W:85W). NCEP R-i sigma-level data. Sensitivity of recycling ratio to beta parameter. (, = 1, (solid line); 3=SP, Southern Plains, (dashed line).) ... 117
5-1 North America (40N,80W). Mean of monthly standard deviation anal-ysis increment of 1998-2001, specific humidity q (kg/kg), NCEP R-1 (points), NCEP R-2 (circles). . ... ... . . 136 5-2 South America (10S,62.5W). Mean of monthly standard deviation of
the analysis increment of 1998-2001, specific humidity q (kg/kg) NCEP R-1 (points), NCEP R-2 (circles). . ... . 137 5-3 South America (10S,62.5W). Standard deviation of analysis increment,
specific humidity q (kg/kg) NCEP R-2, Year 1998 (points), 1999 (cir-cles), 2000 (triangles), and 2001 (crosses). . ... 137 5-4 North America (40N,80W). Mean of monthly standard deviation monthly
analysis increment, 1998-2001, zonal wind u (m/sec), NCEP R-1 (points), NCEP R-2 (circles) ... ... . ... 139 5-5 North America (40N,80W). Mean of monthly standard deviation monthly
analysis increment, 1998-2001, Meridional wind v(m/sec), NCEP R-1 (points), NCEP R-2 (circles). . ... ... 139 5-6 South America (10S,62.5W). Mean of monthly standard deviation monthly
analysis increment, 1998-2001, zonal wind u (m/sec), NCEP R-1 (points), NCEP R-2 (circles). ... ... 140 5-7 South America(10S,62.5W). Mean of monthly standard deviation monthly
analysis increment, 1998-2001, Meridional wind v(m/sec), NCEP R-1 (points), NCEP R-2 (circles). ... ... 140
5-8 South America (10S,62.5W). NCEP R-1. Standard deviation analysis increment, Specific humidity q, Year 1998 (points), 1999 (circles), 2000
(triangles), and 2001 (crosses). . ... ... 147 5-9 North America (40N,80W). Standard deviation monthly analysis
in-crement, Specific humidity q, NCEP R-1, Year 1998 (points), 1999 (circles), 2000 (triangles), and 2001 (crosses). . ... 148 5-10 North America. Standard deviation analysis increment, Specific
hu-midity q, NCEP R-2, Year 1998 (points), 1999 (circles), 2000 (trian-gles), and 2001 (crosses). ... ... ... 149 5-11 North America (40N,80W), NCEP R-1. Standard deviation monthly
analysis increment, zonal wind u (m/sec), Year 1998 (points), 1999 (circles), 2000 (triangles), and 2001 (crosses). . ... 149 5-12 North America (40N,80W), NCEP R-2. Standard deviation monthly
analysis increment, zonal wind u (m/sec), Year 1998 (points), 1999 (circles), 2000 (triangles), and 2001 (crosses). . ... 150 5-13 North America (40N,80W), NCEP R-1. Standard deviation monthly
analysis increment, Meridional wind v (m/sec), Year 1998 (points), 1999 (circles), 2000 (triangles), and 2001 (crosses). . ... 150 5-14 North America (40N,80W), NCEP R-2. Standard deviation monthly
analysis increment, Meridional wind v (m/sec), Year 1998 (points), 1999 (circles), 2000 (triangles), and 2001 (crosses). . ... 151 5-15 South America (10S,62.5W), NCEP R-1. Standard deviation monthly
analysis increment, zonal wind u (m/sec), Year 1998 (points), 1999 (circles), 2000 (triangles), and 2001 (crosses) ... ... . 151 5-16 South America (10S,62.5W), NCEP R-2. Standard deviation monthly
analysis increment, zonal wind u (m/sec), Year 1998 (points), 1999
(circles), 2000 (triangles), and 2001 (crosses). . ...
152
5-17 South America (10S,62.5W), NCEP R-1. Standard deviation monthlyanalysis increment, Meridional wind v (m/sec), Year 1998 (points), 1999 (circles), 2000 (triangles), and 2001 (crosses). . ... 152
5-18 South America (10S,62.5W), NCEP R-2. Standard deviation monthly analysis increment, Meridional wind v (m/sec), Year 1998 (points),
List of Tables
2.1 West Africa, Eltahir and Bras recycling ratio, Jun-Sept 1998-2001 . 59
2.2 West Africa, Brubaker et al. recycling ratio, Jun-Sept 1998-2001 . . . 59
2.3 Central U.S., Eltahir and Bras recycling ratio, Jun-Aug. 1998-2001 64 2.4 Central U.S., Brubaker et al. recycling ratio, Jun-Aug. 1998-2001 . 64 2.5 Amazon, Eltahir and Bras recycling ratio, 1998-2001 . ... 70 2.6 Amazon, Brubaker recycling ratio, 1998-2001 . ... 71 2.7 Model levels and sigma thickness, Kalnay et al. (1996). ... . 76 2.8 Global Gaussian latitudes of T62 model. There are 192x94 data points
in this grid. The longitudes of data grids are equally spaced from 0 degree to -1.875E at an increment of 1.875 degrees. (NCAR DSS ds090.0) 77 3.1 Meteorological regimes, Easterly and Westerly, TRMM-LBA region,
Jan 11-Feb 28, 1999 ... ... .. 87 4.1 Parameter a; Values computed from Bosilovich (2002, Fig.4 and 6) . 108
Chapter 1
Introduction
1.1
Water cycle over land
Water cycles through the atmosphere very fast. Its residence time in the atmosphere is about 10 days. Due to its phase changes, water is an important component of the energy budget of both the atmosphere and the landsurface. Evaporation at the landsurface requires energy, ultimately in the form of solar radiation, and precipitation in the atmosphere releases latent heat via condensation. In addition, water vapor is a radiatively active gas, absorbing in the infrared, providing the largest concentration of greenhouse gas in the atmosphere. Water vapor plays a role in clouds, which reflect solar radiation and absorb infrared radiation depending on height. Overall clouds have large radiative effects. Thus, understanding and estimating water cycling is a critical question in regional and global climate.
1.2
Precipitation recycling
1.2.1
Historical problem in hydrology
A longstanding problem in hydrology, studied by the Russian Voiekov in the 1880s (Drozdov and Grigor'eva 1965), is determining the fraction of precipitation in a land region derived from local evaporative sources. Precipitation is from one of two sources,
either from water vapor outside the region, from an advective source, or from water vapor which has originated as evaporation from the landsurface somewhere within the region. This process of precipitation derived from local evaporative sources is called precipitation recycling (Eltahir and Bras 1996).
1.2.2
Precipitation recycling ratio
Precipitation recycling can be quantified by estimating the precipitation recycling ratio, defined as the fraction of total precipitation derived from local evaporative sources in a given region. The ratio is a fraction and therefore it takes on values between zero and one. It is dependent on the size of the defined region (i.e. scale-dependent) (Eltahir and Bras 1996). For example, to compare recycling ratios of different regions Trenberth (1999) chooses a length scale L of 500 kilometers. As the area of the region of interest is increased, the regional recycling ratio increases in general. Conversely, as the area or length scale of the region is decreased, the recycling ratio decreases to the limit of zero for a point.
1.2.3
Precipitation recycling and land-atmosphere
interac-tion
The precipitation recycling ratio is a quantitative indication of the potential impor-tance of land-atmosphere interaction (Eltahir and Bras 1994). It is a diagnostic mea-sure and is not predictive. Many land-atmosphere feedback mechanisms have been proposed which are integral to the hydrological cycle. A landmark study is Charney et al. (1977), which presented a biogeophysical feedback hypothesis where loss of vegetation cover changes surface albedo, the reflectance of the surface, which induces changes in precipitation. Land-atmosphere feedback mechanisms include thermody-namic effects and boundary layer feedback (Findell and Eltahir 2003a,b). Evapora-tion, which is the source of local moisture in the atmosphere involved in precipitation recycling, is tightly coupled to soil moisture in the unsaturated zone at the landsur-face. Soil moisture serves as the landsurface state and provides memory to the
land-atmosphere system. The soil moisture state is important in short-term prediction of weather events such as floods (Yeh et al. 1984) and longer term seasonal predictabil-ity (Fennessy and Shukla 1999, Koster and Suarez 2003, Koster et al. 2004). By monitoring the precipitation recycling ratio over decades-long periods (Dirmeyer and Brubaker 2006), changes in land-atmosphere interactions and the hydrological cycle can be estimated.
1.2.4
Precipitation recycling and land use
Precipitation recycling and its link to land use has been a critical problem histori-cally in hydrology. The afforestation of certain areas experiencing drought in Russia was proposed in the early 20th century (Drozdov and Grigoreva 1965), and is closely coupled with the problem of estimating the evaporative source of precipitation. Since land use (e.g. agriculture, afforestation, deforestation) changes the landsurface char-acteristics (albedo, vegetation, evaporative capacity such as rooting depth), there is a fundamental link of land use and precipitation recycling. Savenije (1996), in a study of the semi-arid Sahel area, links the recycling ratio to the runoff ratio, the fraction of precipitation which runs off into rivers, streams and into groundwater aquifers. Thus it is important for water resources and natural resources management to understand precipitation recycling in a region.
1.2.5
Continental regions where recycling is important
Precipitation recycling in the Amazon Basin has drawn considerable attention (Molion 1975, Salati et al. 1979, Lettau et al. 1979, Gat and Matsui 1991, Eltahir and Bras 1994). The recycling ratio in the Amazon is estimated to be approximately 25 to 35 percent (Eltahir and Bras 1994) and is fairly constant over the year. Recycling in this basin is linked to the large evapotranspiration from the tropical forests. One concern is land use changes in the form of deforestation. Deforestation decreases the evaporation capacity of the landsurface and changes other landsurface characteristics such as albedo, the reflectance of the surface. These landsurface changes would potentially
result in changes in precipitation recycling, leading to decreased precipitation in this basin, which provides a large latent heat source and is an important component of the global climate system.
Interest in precipitation recycling goes beyond the Amazon Basin. It has been found to be important in many varied continental systems around the world. Mid-latitudes continental regions such as the Mississippi Basin (Brubaker et al. 1993, Bosilovich and Schubert 2001), the Mackenzie Basin in Canada (Szeto 2002), and Eurasian regions (Numaguti et al. 1999, Kurita et al. 2003,2004) have been shown to have significant precipitation recycling, as indicated by the recycling ratio. Recycling is also important in monsoonal climates including central Africa (Gong and Eltahir 1996) and India (Gupta and Deshpande 2003).
1.2.6
Trends and maxima/minima of recycling ratio
The precipitation recycling ratio is generally a maximum in the interior of the conti-nent for a region defined as the entire conticonti-nent. For example, the prevailing winds for the Russian/Asian continent are westerly and therefore the maximum recycling ratio occurs in the eastern part of the continent, in the downwind part of the region (Kurita et al. 2004). Although for some regions such as the Amazon Basin, the recycling ratio is fairly constant over the year, the recycling ratio displays an annual cycle in continental midlatitudes. For midlatitudes, the largest recycling ratio occurs in summer when evaporation is maximum, coinciding with the solar insolation annual cycle. The smallest recycling ratio generally occurs in winter in midlatitudes, when evaporation is low (Dirmeyer and Brubaker 2006).
Comparing recycling ratios of different studies and regions is sometimes problem-atic since the recycling ratio depends on the size of the region (Eltahir and Bras 1996). However, the largest precipitation recycling ratios have generally been found in semi-arid regions. Savenije (1996) estimates that the Sahel region has a 90 per-cent recycling ratio, although the particular parameter values used in the study are acknowledged to be very uncertain. A recent study identified recycling as the major source of moisture over this region, which used a Lagrangian tracking method and
five years of data (Nieto et al. 2006). Anderson et al. (2004) estimates recycling ac-counts for approximately 70 to 90 percent of precipitation in the summertime in the southwestern United States, a semi-arid region. Large recycling ratios in semi-arid regions imply that recycling may be important in understanding the persistence of droughts (Entekhabi et al. 1992).
1.3
Methods to estimate precipitation recycling
There is no direct method of estimating the precipitation recycling ratio for a land region. All indirect recycling methods suffer from limitations and assumptions (Tren-berth et al. 2003).
One method of determining the source of water vapor which falls as precipita-tion is isotopic analysis. In the Amazon Basin, isotopic studies include Salati et al. (1979) and Gat and Matsui (1991). The lack of ongoing isotopic measurements in many regions is a drawback to this method. Isotopic measurements are collected in intensive field campaigns such as GAME (GEWEX Asian Monsoon Experiment) and the IAEA (International Atomic Energy Agency) provides an archive of monthly iso-topic precipitation measurements. However, there is a need for more isoiso-topic data. Recent isotopic studies such as Kurita et al. (2003, 2004), Wright et al. (2001) and associated circulation model studies (Yoshimura et al. 2003) provide quantita-tive information on sources but usually with large modeling uncertainties, such as fractionation parameters.
Water vapor tracer methods (Koster 1988, Numaguti 1999, Bosilovich and Chern 2006), where tracers are built into a global general circulation model (GCM), can also provide recycling estimates. A limitation of this method is that it is entirely dependent on the model (no atmospheric data is used) and its physics parameterizations. There is considerable uncertainty in convective parameterizations (Trenberth et al. 2003).
Methods from the air pollution and atmospheric chemistry community have been used to study the recycling of water, where the original objective is to track the source of air pollution. Two Lagrangian-type methods have been introduced. The
back-trajectory method (Dirmeyer and Brubaker 1999, Dirmeyer and Brubaker 2006) considers water vapor as a passive tracer along quasi-isentropic surfaces, (i.e. constant potential temperature) which are derived from atmospheric reanalysis data. Kurita et al. (2004) note that an adiabatic assumption may not valid in the summer over land. Moreover, the atmospheric level at which precipitation originates must be assumed and is drawn from a probability distribution, as this level is not known from the atmospheric reanalysis data. Stohl and James (2004, 2005) use a Lagrangian particle dispersion method to study sources of water. This method relies on parameterizations of turbulence and convection which have large uncertainties.
1.3.1
Bulk precipitation recycling models
Bulk precipitation recycling methods are based on atmospheric water balance and commonly use atmospheric reanalysis data as input. These models are derived from the atmospheric water balance of both local and advected moisture and some form of the well-mixed assumption, which provides a way of relating the source of precipita-tion to the source of water vapor flux or content in the atmosphere. There are some distinct advantages of bulk models over other recycling ratio estimation methods. One advantage of bulk models is their computational simplicity compared to other methods, especially compared to water vapor tracer methods.
Since this thesis involves a critical analysis of bulk precipitation recycling models, a review of these models is presented, focusing on the key assumptions. The 1D models are presented first, as these models are the foundation of the current 2D models.
1D models
The most general 1D model is Drozdov and Grigoreva (1965), see Figure 1-1. The model is complicated as it is in the form of an integral. Five special cases are discussed in Drozdov and Grigoreva. These cases are:
Figure 1-1: Relationship between 1D bulk precipitation recycling models. The general
1D model is presented in Drozdov and Grigoreva (1965), which is in the form of an integral. A particular case is used in Brubaker et al. (1993), Equation 1.4, which assumes constant E and P. The Budyko model is a special case of this model with constant Pa and Pm.
2. P and E vary linearly with x
3. E=P
4. Constant hydrologic intensity I = - 1 >0 > 0.5
5. Intensity I decreases in interior of region
The hydrologic intensity is a function of precipitation P, the advective moisture flux into the region, F+, and parameter /. The
3
parameter is assumed to be between 0.5 and 1. Case 1 is used in Brubaker et al. (1993), as in Equation 1.4. Budyko's model (1953) is a subset of Case 1.Budyko model
The Budyko model (1953) published in Budyko (1974), forms the basis of many cur-rent precipitation recycling models. The model is one-dimensional, along a direction coincident with a streamline of constant velocity u for a land region of length 1. Pre-cipitation consists of advective origin and local evaporative origin, P = Pa + P,. In
_ · ·1· · ·~
addition, the quantities Pa, Pm and evaporation E are assumed constant and equal to their average values.
The average horizontal moisture flux of advective origin along the length 1 region is
1Pa
Qa = wu- (1.1)
2
where air enters the region with moisture content w, the precipitable water, and air velocity u. The average local horizontal moisture flux is
Qm = 1/2(E - Pm) (1.2)
In order to relate precipitation of local and advective origin to the corresponding horizontal fluxes, Budkyo made the argument that the atmosphere is well-mixed due to turbulence, and therefore the ratio of the local to advective horizontal fluxes is equal
to the corresponding ratio of precipitation of local to advective, Qa/Q, = Pa/Pm.
The precipitation recycling ratio for the region is then
Pm 1
-
1
(1.3)
p 1+ Ew
Drozdov and Grigor'eva model
The 1D model of Drozdov and Grigor'eva (1963) relaxes several assumptions in the original Budyko model. In the Budyko model, constant Pm and Pa are imposed. This model can also be derived from the one-dimensional conservation of water vapor equations (Burde and Zangvil 2001a), neglecting the atmospheric storage terms. As mentioned previously, the expression for the general version of this model is com-plicated and is in the form of an integral (Drozdov and Grigoreva 1965, Burde and Zangvil 2001). Thus, Drozdov and Grigoreva (1965) present several special cases of the general model.
One special case, presented in Drozdov and Grigoreva (1965), and used in Brubaker et al. (1993) is Equation 1.4. The regional recycling ratio is the mean value of the spatially varying Pm/P ratio. This case assumes evaporation E and precipitation P
are independent of x, in that their average values are used, but fluxes Pa and Pm are allowed to vary with x.
= 1- A* + A*( )1/1 (1.4)
P
A*
+ T - I
Note that overbar denotes a spatial average and two dimensionless variables are de-fined, the ratio of moisture influx to total regional precipitation is A*
WU
A* = (1.5)
Pl
and the ratio of average evaporation to average precipitation is T.
T = E (1.6)
P
For comparison, the recycling ratio expression for the Budyko model with the same dimensionless variables is
1=
(1.7)
1 + 2A*/T
Brubaker et al. (1993) compare the results from the Budyko model to the Drozdov and Grigoreva's model, Equation 1.4, in the (A*,T) parameter space. The Budyko tends to underestimate the results as compared to the Drozdov and Grigoreva model. Underestimation of the regional recycling ratio was found to be small, generally less than ten percent.
2D models
The relationship between 2D bulk recycling models is not as straightforward as the 1D recycling models. There are more variations in assumptions and conditions in the 2D case. The Brubaker et al. (1993) model is directly related to the 1D models as it is a 2D extension of the Budyko model. The Brubaker et al. model assumes constant
Brubaker et al. (1993) model underestimates the regional recycling ratio (Burde and Zangvil 2001a, Bosilovich and Schubert 2002). The underestimation is due to the (linear) parallel flow assumption associated with the Brubaker model.
Burde et al. (1996) provide an analytical correction factor to the Brubaker et al. model. A general 2D model is presented in Burde and Zangvil (2001b) which allows Pa and Pm to vary spatially. Eltahir and Bras (1994) offer an approach where the atmospheric water balance equations are considered in integral form rather than differential form. Details of the Brubaker et al. (1993), Eltahir and Bras (1994) and
Burde and Zangvil (2001b) models are presented in this section.
Brubaker et al. 1993
Brubaker et al. (1993) extended the 1D Budyko model to two dimensions. The 2D region is usually rectangular and the moisture influx is along part of the boundary of the region. A new variable, moisture influx F+, is defined
F+ = - Q.ndy (1.8)
"in
where n is the outward unit normal vector, Q is the vertically integrated water vapor flux vector, and the boundary of the region consisting of a segment or set of segments
across which the atmospheric moisture flux is inward is denoted Yi,.
The average advective flux is taken as the arithmetic mean of the incoming and outgoing flux
F+ - (F+ - PaA) =F+ PA (1.9)
2 2
where A is the area of the given region. The local average flux is taken as
0 + (E- Pm)A (E- Pm)A
2m (1.10)
2 2
Budyko model. The regional recycling ratio is then
1
1+ (1.11)
EA
Eltahir and Bras
The Eltahir and Bras (1994) precipitation recycling model considers the spatial varia-tion of evaporavaria-tion, precipitavaria-tion and other relevant quantities within a region. There are no assumptions invoked about constant E or P fluxes within the region, as in the Brubaker et al. (1993) model. The region is divided into a 2D spatial grid. The integral form of the local and advective atmospheric water balance for each grid is applied. The atmospheric storage terms are neglected over the course of a month
(Eltahir and Bras 1996).
The well-mixed assumption is invoked in the form of a moisture outflux ratio. The ratio of local to total moisture outflux in a grid is equated to the ratio of local to total precipitation in the given grid box, Equation 1.12.
m P(1.12)
O P
The recycling ratio r for each grid box is
Ii + Ei
r = (1.13)
A + Ej + Io
where E is evaporation, Ii is moisture influx from local evaporative sources within the region, and Io is moisture influx from outside the region. An iterative procedure is required to solve Equation 2.10, since the local influx Ii is not directly known. The total influx in each grid, I + Io is known. The solution is not dependent on the initial guess. Finally, the regional recycling ratio is obtained by weighting each grid recycling ratio by its fraction of total precipitation in the region.
To study daily events, Kurita et al. (2003) included the atmospheric storage term into the one grid version of this model.
Burde and Zangvil model
Burde and Zangvil (2001b) present a 2D recycling model which allows for spatial variation of E and P, as well as Pa and Pm. The atmospheric water balance equation is used in its differential form. Therefore, the model results in a set of partial differential equations (PDEs) with r the recycling ratio.
appears in the recycling equation.
OrQx
Ox
aQx
8z ;
Note that precipitation P explicitly
(1.14)
(1.15) D OyY E P
Burde and Zangvil emphasize that the local form of the well-mixed assumption
wm
Pm
w P
(1.16)
is invoked instead of using spatial averages. Additional analysis of the Burde and Zangvil model is presented in Section 4.3.
1.4
Problem and scope
There are three common assumptions in bulk recycling models (Burde and Zangvil 2001a)
1. time-averaged data is used to estimate moisture fluxes
2. the change in atmospheric storage term is neglected
3. the well-mixed assumption is invoked
This thesis investigates these three issues in a comprehensive approach. The overall objective of the work is to improve this class of models.
OrQy
+ = E - rP Oy
1.4.1
Time-averaged data
The first common assumption, the use of time-averaged data, is not a model assump-tion but rather involves the applicaassump-tion of the model. The use of time-mean data has an important potential effect on the recycling results. Brubaker et al. (1993) states that using time-averaged data, as in their study, would tend to overestimate the recycling ratio. The use of monthly time-averaged data with these models has also been criticized since this framework does not capture the submonthly time scales such as diurnal and synoptic scales relevant to hydrology (Bosilovich and Schubert, Dirmeyer and Brubaker 2006). Although both mean and transient eddy components are represented in the monthly time-averaged moisture flux field (data) as recognized by Bosilovich and Schubert (2001) and others, other component terms are neglected. However, the use of monthly time-averaged data is not inherent to these recycling models. Brubaker et al. (1993) note that while spatial averaging is an inherent assumption in their model, the use of time-averaged data is not.
The use of time-averaging data on the recycling results will be studied by compar-ing two ways of estimatcompar-ing moisture flux on a monthly scale. Moreover, two different 2D recycling models will be tested. The first method is called the time-averaged method in this thesis, and has been widely used in bulk recycling studies. In this method the time-averaged vertically integrated moisture flux field is used to com-pute the moisture influx, a required input to the recycling model. For the second method, called the accumulation method in this thesis, the moisture flux field data is used at the time-scale of the data, usually 6 hourly for reanalysis data, to compute moisture fluxes. The only bulk recycling studies which use the accumulation method are Eltahir and Bras (1994) and Gong and Eltahir (1996). All other bulk recycling studies use the time-averaged method.
1.4.2
Synoptic time-scale precipitation recycling
The synoptic-time scale is of essential interest in precipitation recycling since the synoptic circulation pattern sets the wind direction. Most recycling studes using
bulk recycling models investigate the monthly scale although the submonthly synoptic time-scale is important in water vapor transport (Schubert et al. 1998). Neglecting the storage term on a monthly basis in bulk recycling models, common assumption (2) above, is justified by the fact that this term is much smaller than the other moisture fluxes in the atmospheric water balance at the monthly time-scale (Eltahir and Bras 1996). However, in order to study the submonthly synoptic time-scale, the atmospheric storage terms are added to the 2D Eltahir and Bras (1996) recycling model. Recycling analysis for a region in southwest Amazon is investigated at the submonthly time scale in the wet season (January-February), where the synoptic regimes alternate between westerlies and easterlies. The synoptic circulation patterns are hypothesized to be reflected in the recycling ratio spatial patterns.
1.4.3
Well-mixed assumption
The well-mixed assumption states since the atmosphere is well-mixed, precipitation is drawn from the advective and local sources in a ratio given by the amount of water vapor of those sources in the atmosphere. This assumption was made in the first bulk recycling model, the Budyko model (1953, published 1974), and Budyko argued that due to turbulence, the atmosphere is well-mixed. Koster (1988) commented that the well-mixed assumption may not be a good assumption since it implies that evapo-ration which occurs close to the ground is immediately well-mixed into the column. A recent water vapor tracer study using a global general circulation model explicitly computes the ratios which are involved in some of the well-mixed assumptions invoked in bulk recycling models (Bosilovich 2002). The results show that there is a local bias in the precipitation as compared to its total water vapor content in US regions in the summer. Although the well-mixed assumption may be valid in the tropics where convection is rigorous and active (Brubaker et al. 1993), there is a need to provide a framework to relax this assumption in these models.
In this thesis, the well-mixed assumption in several bulk recycling models is an-alyzed and a general strategy to relax this assumption is developed. The approach taken in this thesis is to first analyze the well-mixed assumption in the recycling
model. Specifically, the Eltahir and Bras model is investigated, where the well-mixed assumption is invoked in the form of a moisture outflux ratio for each grid box. From this analysis, two parameters are introduced to relax the well-mixed assumption. This framework is applied to the central United States in summer, where the data from the water vapor tracer study of Bosilovich (2002) is used to infer the value of one of the parameters. A combination of information from the Bosilovich study and atmospheric reanalysis data is used to estimate the second parameter.
Since bulk recycling models are computationally simple, if the same information is derived with these models versus the tracer methods, there are significant compu-tational advantages (Bosilovich and Chern 2006). Moreover, bulk recycling methods use atmospheric reanalysis data instead of model-based water vapor tracer methods. In addition, the definition of regions is more flexible than in water vapor tracer meth-ods. The results of bulk recycling models are also used along with water vapor tracer studies, so improvement in these class of models would yield significant benefits in the understanding and estimation of precipitation recycling.
1.4.4
Thesis outline
The thesis outline is as follows. Chapter 2 presents the effect on the recycling ratio of two different methods to estimate moisture flux, the time-averaged method and the accumulation method. Chapter 3 introduces the concept of synoptic time-scale recy-cling. The atmospheric storage terms are included in the Eltahir and Bras recycling model, and a rederivation of the model is done in order to investigate submonthly time scales. The southwest Amazon region is investigated in the wet season where there exists two synoptic regimes, easterlies and westerlies. Chapter 4 investigates the well-mixed assumption and develops a framework to relax this assumption. Chapter 5 deals with uncertainty in reanalysis data. Two reanalysis datasets are quantitatively compared, using the variables of interest, the humidity and wind fields. Chapter 6 provides a summary of findings and discusses future work.
References
[1] Anderson B.T., H. Kanamaru and J. O. Roads, The summertime atmospheric hydrologic cycle over the southwestern United States, J. Hydrometeorology, 5, 679-692, 2004.
[2] Benton G. S., R. T. Blackburn, and V. O. Snead, The role of the atmosphere in the hydrologic cycle. Eos, Trans. Amer. Geophys. Union, 31, 61-73, 1950.
[31 Bosilovich M.G. and J-D Chern, Simulation of water sources and precipitation recycling for the MacKenzie, Mississippi, and Amazon River Basins, J.
Hydrom-eteorology, 7, 312-329, 2006.
[4] Bosilovich M.G., On the vertical distribution of local and remote sources of water for precipitation, Meteorol. Atmos. Phys, 80, 31-41, 2002.
[5] Bosilovich M.G. and S.D. Schubert, Water vapor tracers as diagnostics of the regional hydrological cycle, J. Hydrometeorology, 3, 149-165, 2002.
[6] Brubaker, K.L., D. Entekhabi and P.S. Eagleson, Estimation of continental pre-cipitation recycling, J. Climate, 6, 1077-1089, 1993.
[7] Brubaker, K.L., D. Entekhabi and P.S. Eagleson, Atmospheric water vapor trans-port: Estimation of continental precipitation recycling and parameterization of a simple climate model, MIT Dept. Civil Engineerign, Ralph M. Parsons Labo-ratory Report No. 333, 166pp, 1991.
[9] Burde G.I. and A. Zangvil, The estimation of regional precipitation recycling. Part I: Review of recycling models, J. Climate, 14(12) 2497-2508, 2001.
[10] Burde G.I. and A. Zangvil, The estimation of regional precipitation. Part II: A new recycling model, J. Climate, 14(12) 2509-2527, 2001.
[11] Burde G.I., A. Zangvil and Lamb P.J., Estimating the role of local evaporation in precipitation for a two-dimensional regin, J. Climate, 9, 1328-1338, 1996. [12] Charney, J.G., P.H. Stone, and W.J. Quirk, Drought in the Sahara: A
biogeo-physical feedback mechanism, Science, 187, 434-435, 1975.
[13] Dirmeyer, P.A. and K.L. Brubaker, Contrasting evaporative moisture sources during the drought of 1988 and the flood of 1993, J. Geo. Res., 104, D16,
19383-19397, 1999.
[14] Dirmeyer P.A. and K.L. Brubaker, Evidence for trends in the Northern Hemi-sphere water cycle, Geophys. Res. Letters, 33, 2006.
[15] Dominguez F., P. Kumar, X-Z. Liang and M. Ting, Impact of atmospheric mois-ture storage on precipitation recycling, J. Climate, 19 1513-1530, 2006.
[16] Drozdov. O.A. and A.S. Grigore'eva, The Hydrological cycle in the atmosphere, Israel Program for Scientific Translations, 1965.
[17] Eltahir E.A.B. and R.L. Bras, Precipitation recycling in the Amazon basin, Q.J.R. Meteor. Soc., 120, 861-880, 1994.
[18] Eltahir E.A.B. and R.L. Bras, Precipitation recycling, Rev. Geophysics, 367-378, 1996.
[19] Entekhabi, D.E., I. Rodriguez-Iturbe, and R.L. Bras, Variabilityin large scale water balance with land-atmosphere interaction, J. Climate, 5, 798-813, 1992. [20] Fennessy M.J. and J. Shukla, Impact of initial soil wetness on seasonal
[21] Findell, K.L., and E.A.B. Eltahir, Atmospheric Controls on Soil Moisture-Boundary Layer Interactions; Part I: Framework Development. The Journal of Hydrometeorology, Vol.4, 552-569, 2003.
[22] Findell, K.L. and E.A.B. Eltahir, 2003: Atmospheric Controls on Soil Moisture-Boundary Layer Interactions; Part II: Feedbacks Within the Continental United States. The Journal of Hydrometeorology, Vol. 4, 570-583, 2003.
[23] Gupta S.K. and Deshpande, R.D., Synoptic hydrology of India from the data of isotopes in precipitation, Current Science, 85, 1591-1595, 2003.
[24] Joussame, S., R. Sadourny and J. Jouzel, A general circulation model of water isotope cycles in the atmosphere, Nature, 311, 24-29, 1984.
[25] Koster R.D., Tracer water transport and subgrid precipitation variation within atmospheric general circulation models, MIT Dept. Civil Engineering, Sc.D. the-sis, 1988.
[26] Koster, R.D., J. Jouzel, R.J.Suozzo, G.L. Russell, W.S. Broecker, D. Rind and P.S. Eagleson, Global sources of local precipitation as determined by the NASA/GISS GCM, Geophys. Res. Letters, 13, 121-124, 1986.
[27] Koster, R.D., J. Jouzel, RJ.Suozzo, and G.L. Russell, Origin of July Antarctic precipitation and its influence on deuterium content: A GCM analysis, Climate Dynamics, 7, 195-203, 1992.
[28] Koster, R.D. D.P. de Valpine and J. Jouzel, Continental water recycling and
H2180 concentrations, Geophys. Res. Letters, 20, 2215-2218, 1993.
[29] Koster R.D. and M.J. Suarez, Impact of land surface initialization on seasonal precipitation and temperature prediction, J. Hydrometeorology, 4, 408-423, 2003. [30] Koster R.D., Suarez M.J., Liu P, Jambor U., Berg A., Kister M.,Reichle R., Rodell M., and Famiglietti, J., Realistic initialization of land surface states: Impacts on subseasonal forecast skill, J. Hydrometeorology, 5, 1049-1063, 2004.
[31] Kurita, N., A. Numaguti, A. Sugimoto, K. Ichiyanagi and N. Yoshida, Relation-ship between the variation of isotopic ratios and the source of summer precipi-tation in eastern Siberia, J. Geophys. Res., 108, 2003.
[32] Kurita N, Yoshida N, Inoue G, Chayanova EA, Modern isotope climatology of Russia: A first assessment, J. Geophys. Res., 2004.
[33] Lettau, H., K. Lettau and LC.B. Molion, Amazonia's hydrologic cycle and the role of atmospheric recycling in assessing deforestation effects, Monthly Weather
Rev., 107, 227-238, 1979.
[34] Molion, L.C.B., Ph.D. thesis, U. Wisconsin-Madison, 1975.
[35] Nieto R., Gimeno L., and R.M. Trigo, A Lagrangian identification of major sources of Sahel moisture, Geophysical Research Letters, 33, 2006.
[36] Numaguti, A., Origin and recycling processes of precipitating water over the Eurasian continent: Experiments using an atmospheric general circulation model, J. Geophys. Res., 104, 1957-1972, 1999.
[37] Qian J.H., W.K Tao and K.M.Lau, Mechanisms for torrential rain associated with the mei-yu development during SCSMEX 1998, Monthly Weather Review, 132, 3-27, 2004.
[38] Salati E., A. Dall'Olio, E. Matsui, and J.R. Gat, Recycling of water in the Amazon basin: An isotopic study, Water Resour. Res., 15, 1250-1258, 1979. [39] Savenije, New definitions for moisture recycling and the relationship with
land-use in the Sahel, J. Hydrology, 167, 57-78, 1995.
[40] Savenije, H.H.G., The runoff coefficient as the key to moisture recycling, J. Hydrology, 176, 219-225, 1996.
[41] Serreze MC and AJ Etringer, Precipitation characteristics of the Eurasian Arctic drainage system, Int. Journal of Climatology, 23, 1267-1291, 2003.
[42] Stohl A. and P. James, A Lagrangian analysis of the atmospheric branch of the global water cycle. Part I: Method description, validation, and demonstration for the August 2002 flooding in central Europe, J. Hydrometeorology, 5, 656-678,
2004.
[43] Stohl A. and P. James, A Lagrangian analysis of the atmospheric branch of the global water cycle. Part II: Moisture transports between earth's ocean basins and river catchments, J. Hydrometeorology, 6, 961-984, 2005.
[44] Szeto, K.K., Moisture recycling over the Mackenzie basin Atmosphere-Ocean, 40, 181-197, 2002.
[45] Trenberth, Kevin E., Aiguo Dai, Roy M. Rasmussen, and David B. Parsons, The Changing Character of Precipitation, Bull. Amer. Meteor. Soc, 84, 1205-1217, 2003.
[46] Wang, J.F. and R.L.Bras, Dynamics of precipitation recycling, 2nd TRMM Sci-ence ConferSci-ence, Nara, Japan, Sept. 2004.
[47] Yeh T.C., R.T.Wetherald and S. Manabe, The effect of soil-moisture on the short-term climate and hydrology change - a numerical experiment, Monthly Weather Review, 112, 474-490, 1984.
[48] Zangvil., A., Portis D.H., and P.J. Lamb, Investigation of the large-scale atmo-spheric moisture field over the Midwestern United States in relation to summer precipitation. Part II: Recycling of local evapotranspiration and association with soil moisture and crop yields, J. Climate, 17, 3283-3301, 2004.
Chapter 2
The effect of moisture flux
characterization on recycling
2.1
Introduction
Bulk precipitation recycling models have been criticized for their use of monthly time-averaged data in estimating moisture fluxes, as this data does not capture the diurnal or synoptic variations important in hydrology. The moisture flux in a region is one of the two main inputs to bulk recycling models. The use of time-averaged data in esti-mating moisture fluxes is considered a common assumption for these models (Burde and Zangvil 2001a). However, the use of time-averaged data is not a requirement in these recycling models as noted by Brubaker et al. (1993). In this chapter, two meth-ods of estimating moisture flux are investigated and their effect on recycling results for several regions are presented. The first method relies on time-mean data, called the time-averaged method, and the second method uses the atmospheric data at the finest available time-scale, usually six hourly, and will be called the accumulation method.
Previous recycling studies using the Brubaker et al. model (1993) have used the the time-averaged method. Recycling studies involving the Eltahir and Bras (1994) model have used both moisture flux computation methods. Bosilovich and Schubert (2001) use the time-averaged method whereas Eltahir and Bras (1994) and Gong
and Eltahir (1996) use the accumulation method. The accumulation method yields greater moisture flux than the time-averaged method, which would tend to decrease the recycling ratio, with the other inputs held constant.
In this chapter the two moisture flux estimation methods, the time-averaged method and accumulation method, are described and analyzed in some detail in Section 2.2. The effect of the two different moisture flux methods on the recycling results is investigated using four years of atmospheric reanalysis data, 1998-2001, Sec-tion 2.5. Recycling ratio results are presented for three regions: west Africa, Amazon, and central United States. We study the effect of the moisture flux method on re-cycling results for both the Brubaker et al. (1993) and the Eltahir and Bras (1994) recycling models.
A secondary objective in this chapter is to investigate differences in two global reanalysis datasets, NCEP R-1 (Kalnay et al. 1996) and NCEP R-2 (Kanamitsu et al. 2002). The R-1 and R-2 datasets are found to have large differences in computed moisture convergence in the tropics (Roads 2003). Gong and Eltahir (1996) note potential error in precipitation recycling estimates due to the sparsity of observations over the west Africa region of their study. We expect the uncertainty to be larger in regions with sparse radiosonde observations. Therefore, we present the radiosonde locations obtained from a metadatset associated with the R-1 dataset. We discuss differences in R-1 and R-2 datasets relevant to precipitation recycling such as evapora-tion and moisture fluxes. The three regions investigated have a variety of observaevapora-tion
densities (west Africa, central United States, and the Amazon.)
2.2
Two moisture flux estimation methods
Bulk recycling models require moisture influx as an input. For this discussion, sup-pose that monthly moisture influx for a region is to be computed from atmospheric reanalysis data for the Brubaker et al. (1993) spatially lumped recycling model, where there is one large rectangular region. Assume that atmospheric reanalysis data is available at four times daily (6 hourly) over a 31 day month, so that there are
N=124 data samples.
2.2.1
Time-averaged method
The vertically integrated moisture flux vector Q = (Qx, Q,)[kg m-'s- 1, kg m-Is- 1]
is first computed from the 6 hourly atmospheric data, assumed to be instantaneous estimates of the wind fields and specific humidity (u,v and q). The zonal component
Qx
is defined1 Pt
Qx
= uq dp (2.1)where p, is surface pressure, and pt is approximately the 300mb pressure level, and
p is the pressure coordinate. The meridional component Q, is defined similarly but with meridional wind v instead of zonal wind u.
The time-averaged Q vector is obtained by averaging the N=124 samples of mois-ture flux vector Q. The moismois-ture flux into the region F+ in Equation 2.2 is defined
as an integral along the boundary segment(s) y,>o where y,>o is the segment or set of segments across which the atmospheric moisture flux is positive inward, and fi is the outward unit normal vector. In this method, the time-averaged Q moisture flux vector is used in the integral.
F+ = - - fi ds (2.2)
Note that boundary segment contributions to moisture influx F+ are always positive
by definition of boundary segment set -y>o so that F+ > 0.
2.2.2
Accumulation method
In the accumulation method of computing moisture flux for a region, N moisture influx integrals are computed for the month and then time-averaged, where N is the number of time samples of data in a month. The monthly moisture flux for a region
Figure 2-1: Simple box region example. Southwesterly flow occurs half the time.
Moisture flux vector
Q=(100,100).
Figure 2-2: Simple box region example. Northwesterly flow occurs half the time. Moisture flux vector Q=(100,-100).
F+ is computed as in Equation 2.3,
F
=
N
i
(2.3)
where N=124 for a 31 day month, using 6 hourly reanalysis data. The integrals Ii are defined as beginequation Ii = - f->o Qi" fi ds(2.3)where Qi is the instantaneous moisture flux vector Q at time i, 'yi>o is the segment or set of segments across which the atmospheric moisture flux is positive inward at time i, and ii is the outward unit normal vector.
2.2.3
A simple example
Suppose the region of interest is a box. Assume there is a southwest wind for half the time and the moisture flux vector is Q=(100,100) [kg m-18s-1, kgm-1s- 1] and is
Figure 2-3: Time-averaged method, I. Moisture influx along west boundary (bold line), 7.