HAL Id: inserm-00663570
https://www.hal.inserm.fr/inserm-00663570
Submitted on 27 Jan 2012
HAL is a multi-disciplinary open access
archive for the deposit and dissemination of
sci-entific research documents, whether they are
pub-lished or not. The documents may come from
teaching and research institutions in France or
abroad, or from public or private research centers.
L’archive ouverte pluridisciplinaire HAL, est
destinée au dépôt et à la diffusion de documents
scientifiques de niveau recherche, publiés ou non,
émanant des établissements d’enseignement et de
recherche français ou étrangers, des laboratoires
publics ou privés.
enteric glial cells: impact on intestinal epithelial barrier
functions.
Laurianne van Landeghem, Maxime Mahé, Raluca Teusan, Jean Léger,
Isabelle Guisle, Rémi Houlgatte, Michel Neunlist
To cite this version:
Laurianne van Landeghem, Maxime Mahé, Raluca Teusan, Jean Léger, Isabelle Guisle, et al..
Regu-lation of intestinal epithelial cells transcriptome by enteric glial cells: impact on intestinal epithelial
barrier functions.. BMC Genomics, BioMed Central, 2009, 10 (1), pp.507. �10.1186/1471-2164-10-507�.
�inserm-00663570�
Open Access
Research article
Regulation of intestinal epithelial cells transcriptome by enteric glial
cells: impact on intestinal epithelial barrier functions
Laurianne Van Landeghem
1,2,3, Maxime M Mahé
1,2,3, Raluca Teusan
2,4,
Jean Léger
2,4, Isabelle Guisle
2,4, Rémi Houlgatte
2,4,5and Michel Neunlist*
1,2,3 Address: 1INSERM, U913, Nantes, F-44000 France, 2Université de Nantes, Faculté de Médecine, Nantes, F-44000 France, 3CHU Nantes, Institut des Maladies de l'Appareil Digestif, Nantes, F-44000 France, 4INSERM, U915, Institut du Thorax, Nantes, F-44000 France and 5CHU Nantes, Institut du Thorax, Nantes, F-44000 FranceEmail: Laurianne Van Landeghem - laurianne.van-landeghem@univ-nantes.fr; Maxime M Mahé - maxime.mahe@univ-nantes.fr;
Raluca Teusan - raluca.teusan@nantes.inserm.fr; Jean Léger - jean.leger@nantes.inserm.fr; Isabelle Guisle - isabelle.guisle@nantes.inserm.fr; Rémi Houlgatte - remi.houlgatte@nantes.inserm.fr; Michel Neunlist* - michel.neunlist@univ-nantes.fr
* Corresponding author
Abstract
Background: Emerging evidences suggest that enteric glial cells (EGC), a major constituent of the enteric nervous system (ENS), are key regulators of intestinal epithelial barrier (IEB) functions. Indeed EGC inhibit intestinal epithelial cells (IEC) proliferation and increase IEB paracellular permeability. However, the role of EGC on other important barrier functions and the signalling pathways involved in their effects are currently unknown. To achieve this goal, we aimed at identifying the impact of EGC upon IEC transcriptome by performing microarray studies.
Results: EGC induced significant changes in gene expression profiling of proliferating IEC after 24 hours of co-culture. 116 genes were identified as differentially expressed (70 up-regulated and 46 down-regulated) in IEC cultured with EGC compared to IEC cultured alone. By performing functional analysis of the 116 identified genes using Ingenuity Pathway Analysis, we showed that EGC induced a significant regulation of genes favoring both cell-to-cell and cell-to-matrix adhesion as well as cell differentiation. Consistently, functional studies showed that EGC induced a significant increase in cell adhesion. EGC also regulated genes involved in cell motility towards an enhancement of cell motility. In addition, EGC profoundly modulated expression of genes involved in cell proliferation and cell survival, although no clear functional trend could be identified. Finally, important genes involved in lipid and protein metabolism of epithelial cells were shown to be differentially regulated by EGC.
Conclusion: This study reinforces the emerging concept that EGC have major protective effects upon the IEB. EGC have a profound impact upon IEC transcriptome and induce a shift in IEC phenotype towards increased cell adhesion and cell differentiation. This concept needs to be further validated under both physiological and pathophysiological conditions.
Published: 2 November 2009
BMC Genomics 2009, 10:507 doi:10.1186/1471-2164-10-507
Received: 26 February 2009 Accepted: 2 November 2009 This article is available from: http://www.biomedcentral.com/1471-2164/10/507
© 2009 Van Landeghem et al; licensee BioMed Central Ltd.
This is an Open Access article distributed under the terms of the Creative Commons Attribution License (http://creativecommons.org/licenses/by/2.0), which permits unrestricted use, distribution, and reproduction in any medium, provided the original work is properly cited.
Background
The intestinal epithelial barrier (IEB) is the first boundary between the organism and the luminal environment. It plays a dual role by allowing the passage of nutrients and electrolytes but preventing the passage of pathogens. The maintenance of its homeostasis is of utmost importance for the survival of the organism. The IEB is formed by a monolayer of specialized intestinal epithelial cells (IEC) under constant renewal and maintained together via vari-ous cell-to-cell and cell-to-matrix interactions. The IEB is part of a complex network of specialized cell types consti-tuting its microenvironment such as immune cells, subep-ithelial fibroblasts, endothelial cells or luminal bacteria. Emerging evidences suggest that under physiological con-ditions, the IEB's functions are actively regulated by its cel-lular microenvironment [1-3]. For instance, myofibroblasts have been shown to enhance epithelial cell proliferation and intestinal epithelial restitution [4]. In addition, microbiota have been shown to control both the maturation and the maintenance of the IEB [5]. The enteric nervous system (ENS) is also a major constit-uent of the cellular microenvironment of the IEB. Indeed IEB and, in particular, the proliferative compartment of the crypts are densely innervated by nerve fibres originat-ing mainly from the submucosal plexus. Recent data have shown that, besides controlling secretory processes, acti-vation of enteric neurons can reduce IEC proliferation and barrier permeability, in particular via the release of vasoac-tive intestinal peptide (VIP) [6-8]. Enteric neurons inner-vating the IEB are also closely associated with enteric glial cells (EGC), the major constituent of the ENS.
For many years, EGC have been considered as mainly pas-sive and structural cells supporting neurons and gangli-ons. However, this concept has lately been revisited mainly focused on the role played by astrocytes in the cen-tral nervous system (CNS) [9-11]. Besides controlling and regulating neuronal functions, increasing evidence sug-gests that EGC could be major regulators of IEB functions, similar to astrocytes controlling blood brain barrier func-tions [10]. Supporting this concept, recent data have dem-onstrated that EGC can profoundly inhibit IEC proliferation, in part via the liberation of TGF-β1 [12]. EGC also decrease IEB paracellular permeability via the release of S-nitrosoglutathione (GSNO) [13]. Further-more, in vivo lesions of EGC network increase IEB paracel-lular permeability and IEC proliferation and, at term, lead to major lethal intestinal inflammation [13-15]. How-ever, the role of EGC in the control of other major IEC functions such as cell differentiation, cell or cell-to-matrix adhesion, and the associated regulatory pathways remains largely unknown.
Therefore, in our study, we combined transcriptomic stud-ies as well as functional studstud-ies to determine the impact of EGC on the regulation of major genes and functions involved in IEB homeostasis. Microarray approach was used to identify EGC-induced modifications in gene expression profiling of proliferating Caco-2. The identi-fied genes and related functional pathways are consistent with the concept that EGC are a major constituent of the IEB microenvironment favoring barrier protection.
Results and Discussion
Enteric glial cells modulate intestinal epithelial cells transcriptome
Microarray experiments
We performed microarray analysis of EGC influence on the transcriptome of Caco-2 cells using oligonucleotide chips (Cancerochips) developed at West Genopole tran-scriptome core facility of Nantes. These microarrays con-tain around 6,864 genes and are dedicated to gene expression studies in Caco-2 cell line as well as to gene expression signature studies of multiple tumors. Caco-2 cells were cultured onto Transwell filters in the absence or presence of EGC seeded at the bottom of the wells for 8 or 24 hours. The Transwell filters did not allowed any con-tact between IEC and EGC, thus implicating only para-crine communication between the two cell types.
Hierarchical clustering of the whole data showed the impact of the time of culture as well as the impact of the presence of EGC on the transcriptional profiling of IEC, i.e. Caco-2 cells (Figure 1). We observed changes in IEC transcriptome over the 24 hours of culture in control con-dition. At 8 hours, differences in transcriptome profiling already existed in control condition as compared to t = 0. In general, the observed changes in differentially expressed genes between t = 0 and t = 8 hours in control conditions were increased in the same way of regulation when reaching t = 24 hours (Figure 1). These changes might be due to the growth and differentiation of the pro-liferating IEC over the 24 hours of culture. We observed no major differences in gene expression profiling between IEC cultured alone and IEC cultured in presence of EGC at 8 hours of culture. In contrast, at 24 hours, EGC presence led to consistent and major changes in IEC gene expres-sion profiling (Figure 1).
Gene expression modulated by EGC
Using Genespring software, we aimed to identify statisti-cally significant differences in gene expression profiling between Caco-2 cells cultured alone or in presence of EGC. After 8 h of culture, no significant difference in gene expression profiling was found between IEC cultured alone (control condition) or in presence of EGC ("glia" condition). However, after 24 hours of culture, we identi-fied 116 genes differentially expressed between control
Hierarchical clustering of expression data
Figure 1
Hierarchical clustering of expression data. Four individual microarrays were used per condition. Hierarchical clustering was performed on genes using Gene Cluster. Each ratio was normalized to the median of the t = 0 hour-condition values of the corresponding gene. Each column represents an individual array (T0: t = 0 hour condition samples; T8control: t = 8 hours of culture without EGC; T8glia: t = 8 hours of culture in presence of EGC; T24control: t = 24 hours of culture without EGC; T24glia: t = 24 hours of culture in presence of EGC). Each line represents one individual gene. The clustering shows the impact of the time of culture on gene expression profiling in Caco-2 cells. The EGC-induced modulation of IEC transcriptome is highly visible at t = 24 hours.
and EGC conditions by using two different strategies. Ben-jamini and Hochberg False Discovery Rate method was used to determine 98 differentially expressed genes between control and glia conditions at t = 24 hours, and we also selected 27 genes with a two-fold change and Stu-dent's t-test p-value less than or equal to 0.05. Among the 116 differentially expressed genes, 46 genes were down-regulated and 70 were up-down-regulated in IEC cultured with EGC as compared to control (Table 1, 2). Quantitative PCR was also performed on various genes to validate the microarray results. In particular, results showed an EGC-induced increase of CDH1, FN1, LAMA5, PPARG, PTK2 mRNA expression in IEC and a decrease of E2F1, FGFR2,
GPX2 and SMAD3 mRNA expression in IEC, similar to the
data obtained with microarrays (Figure 2A). We next sought to determine the specificity of EGC effects upon IEC transcriptome by characterizing the impact of fibrob-lasts on the expression of these genes in IEC. Under iden-tical culture conditions, we showed that fibroblasts increased expression of PTK2 but did not significantly modify gene expression of CDH1, FN1, LAMA5, PPARG,
E2F1, GPX2 and SMAD3 in IEC (Figure 2B). Hierarchical clustering of differentially expressed genes
Hierarchical clustering was used to visualize the expres-sion profile of the 116 genes induced or repressed by EGC after 24 hours of culture (Figure 3).
All these genes exhibit a differential expression between control and EGC conditions at t = 24 hours. Furthermore, some of them already exhibited a slight difference in expression profile between control and EGC conditions at 8 hours. These results indicate that EGC effects on genes identified as differentially expressed in IEC at 24 hours probably started as early as at 8 hours, even though the modifications were not statistically significant.
Two groups of samples exhibited a very different profile from other samples: EGC condition at t = 24 hours and controls at t = 24 hours (Figure 3). These observations confirm that 1) no major changes existed between control and EGC conditions at t = 8 hours and 2) that the 24 hour-time of culture impacted on gene expression profiling in IEC, likely reflecting differentiation of IEC over the time of culture.
EGC regulate IEC functions
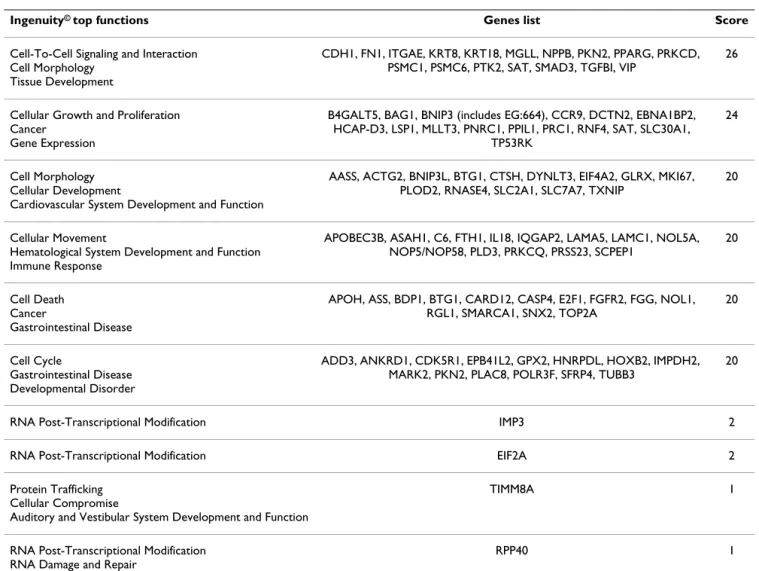
Gene network interactions
Biological interactions among the 116 genes of the gene set provided by Genespring analysis were identified using Ingenuity Pathways Analysis. Among the 116 genes differ-entially expressed, Ingenuity identified 92 genes contrib-uting to a total of 10 functional networks (Table 3). Each of the 6 first networks contained at least 14 genes that were associated with cell-to-cell signalling and
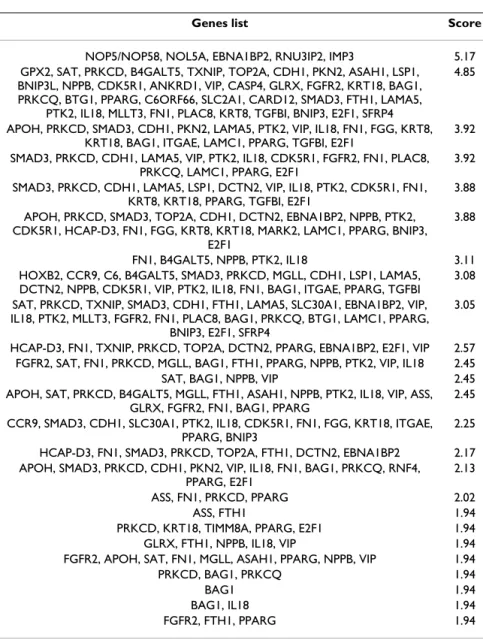
interac-tion, cellular growth and proliferainterac-tion, cell morphology, cellular movement, cell death and cell cycle. The 116 genes were also classified into Ingenuity cellular and molecular pathways as well as into Ingenuity signalling pathways (Table 4 and 5). All the functions described above and identified by building functional networks among our gene set were found in the 25 cellular and molecular functions obtained with Ingenuity (Table 4). Moreover, these 6 functions were among the 10 first func-tions presenting the highest score (Table 4). Finally, the signalling pathways identified by the Ingenuity analysis of our gene set were also relevant to those 6 functions (Table 5). The limit of Ingenuity analysis for our study is that it is not restricted to one specific organ or cell, so that all the results of Ingenuity analysis could not be transposed directly to the regulation of IEC functions by EGC. We therefore performed an "epithelial" specific analysis of the major functions identified with Ingenuity.
Cell-to cell and cell-to-matrix interaction
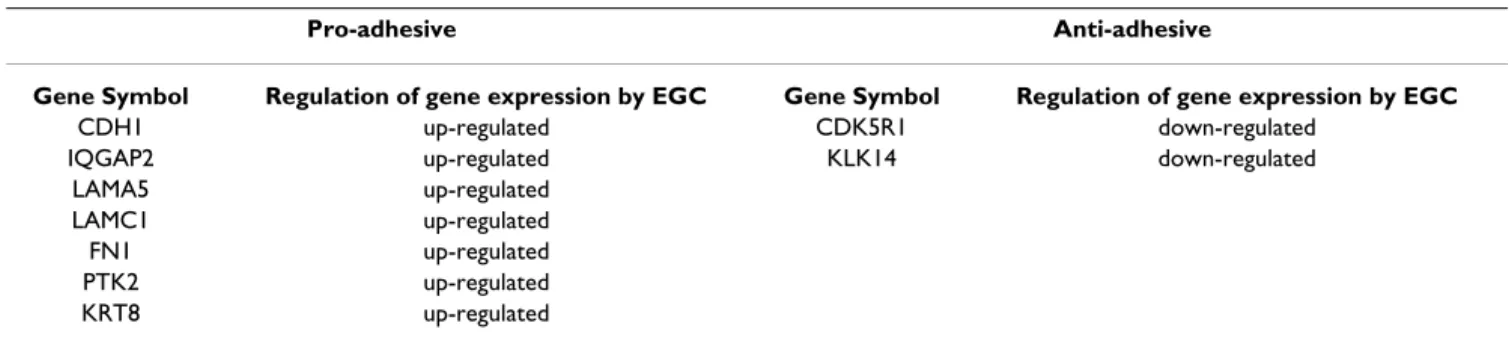
EGC regulated the expression of numerous genes involved in the control of IEC adhesive processes. In particular, EGC induced an up-regulation of the expression of all 7 genes with pro-adhesive functions and a down-regulation of the 2 genes with anti adhesive properties, among the gene set found to be differentially expressed in IEC cul-tured in presence of EGC (Table 6). These genes are cru-cially involved in the control of cell and cell-to-matrix adhesion.
First, EGC concomitantly increased the expression of
CDH-1, which encodes E-cadherin, and decreased the
expression of CDK5R1. E-Cadherin is the major compo-nent of the adherent junction complexes and the level of E-Cadherin in IEC is to be correlated to adhesion com-plexes formation between IEC [16,17]. Further evidences confirming a pro-adhesive influence of EGC on IEC is the EGC-induced down-regulation of CDK5R1 expression. Indeed, CDK5R1 encodes p35, a regulator of CDK-5 (cyc-lin-dependent kinase), which induces the degradation of E-Cadherin precursor [18]. In addition, EGC also up-reg-ulated IQGAP2 expression in IEC. This gene encodes for a protein member of IQGAP family that interacts with sev-eral molecules controlling cytoskeleton organization, cell adhesion and cell motility such as CDC42 and Rac [19]. Interestingly, IQGAP2 has been shown to mediate E-Cad-herin-based cell-to-cell adhesion during development [20]. All these results suggest that EGC enhance cell-to-cell adhesion in IEC.
Our data also demonstrate that EGC modulate the expres-sion of genes that are involved in cell-to-matrix interac-tions. First, EGC increased expression of several genes encoding proteins of the extracellular matrix such as
Table 1: List of the genes up-regulated by enteric glial cells in intestinal epithelial cells.
Gene Symbol Genbank Description % up-regulation (/control) Fold difference
TXNIP NM_006472 thioredoxin interacting protein 217,60 3,18
ANKRD1 NM_014391 ankyrin repeat domain 1 (cardiac muscle) 169,22 2,69
FN1 U42593 fibronectin 1 152,16 2,52
TUBB3 NM_006086 tubulin, beta 3 149,94 2,50
MGLL AJ270950 monoglyceride lipase 135,97 2,36
METTL7A NM_014033 methyltransferase like 7A 132,96 2,33
PKN2 NM_006256 protein kinase N2 128,33 2,28
/ XM_166201 synonyms: KIAA0056, MGC104671; Homo sapiens KIAA0056 protein (hCAP-D3), mRNA.
115,09 2,15
EPB41L2 NM_001431 erythrocyte membrane protein band 4.1-like 2 110,50 2,11
AASS AJ007714 aminoadipate-semialdehyde synthase 110,15 2,10
ACTG2 NM_001615 actin, gamma 2, smooth muscle, enteric 102,56 2,03 B4GALT5 NM_004776 UDP-Gal:betaGlcNAc beta 1,4-
galactosyltransferase, polypeptide 5
102,38 2,02
SNX2 NM_003100 sorting nexin 2 102,38 2,02
VIP NM_003381 vasoactive intestinal peptide 102,33 2,02
EIF4A2 NM_001967 eukaryotic translation initiation factor 4A, isoform 2
102,14 2,02
/ NM_019027 RNA-binding protein 101,66 2,02
POLR3F NM_006466 polymerase (RNA) III (DNA directed) polypeptide F, 39 kDa
94,46 1,94
PNRC1 NM_006813 proline-rich nuclear receptor coactivator 1 93,24 1,93
NPPB NM_002521 natriuretic peptide precursor B 83,97 1,84
/ BC017857 Homo sapiens cDNA clone IMAGE:4690793, with apparent retained intron.
82,20 1,82
KRT8 NM_002273 keratin 8 81,96 1,82
SAT1 NM_002970 spermidine/spermine N1-acetyltransferase 1 80,24 1,80
ASS1 NM_000050 argininosuccinate synthetase 1 76,73 1,77
S100A11P NM_021039 / 75,22 1,75
SLC7A7 NM_003982 solute carrier family 7 (cationic amino acid transporter, y+ system), member 7
72,31 1,72
HAGH NM_005326 hydroxyacylglutathione hydrolase 69,54 1,70
BNIP3L AF536326 BCL2/adenovirus E1B 19 kDa interacting protein 3-like
69,19 1,69
/ AF195968 PRR5-ARHGAP8 fusion 68,01 1,68
BNIP3 NM_004052 BCL2/adenovirus E1B 19 kDa interacting protein 3
67,84 1,68
IL18 NM_001562 interleukin 18 (interferon-gamma-inducing factor) 67,14 1,67
RDM1 BC038301 RAD52 motif 1 67,11 1,67
FAM107B NM_031453 family with sequence similarity 107, member B 65,70 1,66
PLAC8 NM_016619 placenta-specific 8 63,77 1,64
SMARCA1 NM_139035 SWI/SNF related, matrix associated, actin dependent regulator of chromatin, subfamily a,
member 1
63,72 1,64
PLOD2 NM_000935 procollagen-lysine, 2-oxoglutarate 5-dioxygenase 2
62,87 1,63
TMSB4Y NM_004202 thymosin, beta 4, Y-linked 62,77 1,63
SCPEP1 NM_021626 serine carboxypeptidase 1 60,96 1,61
LAMA5 NM_005560 laminin, alpha 5 60,53 1,61
LAMC1 NM_002293 laminin, gamma 1 (formerly LAMB2) 59,89 1,60
METAP1 BC030054 methionyl aminopeptidase 1 59,55 1,60
IQGAP2 NM_006633 IQ motif containing GTPase activating protein 2 58,98 1,59
C1orf43 NM_015449 chromosome 1 open reading frame 43 56,86 1,57
CASP4 NM_001225 caspase 4, apoptosis-related cysteine peptidase 55,71 1,56 BTG1 NM_001731 B-cell translocation gene 1, anti-proliferative 54,63 1,55 SLC2A1 K03195 solute carrier family 2 (facilitated glucose
transporter), member 1
54,34 1,54
DCTN2 NM_006400 dynactin 2 (p50) 52,68 1,53
TOP2A NM_001067 topoisomerase (DNA) II alpha 170 kDa 52,42 1,52
KRT18 NM_000224 keratin 18 51,16 1,51
respectively for laminin α5 and γ1 chains which, together with laminin β1 chain, compose laminin-10 [21]. Lam-inin-10 has been shown to be the most adhesive substra-tum of laminin isoforms when studying abilities of laminin-2,-5 and -10 in modulating Caco-2 cell adhesion [22]. Furthermore, EGC up-regulated FN1 expression, encoding the fibronectin protein. Interestingly, fibronec-tin has recently been shown to enhance Caco-2 cell attach-ment and wound healing [23]. EGC down-regulated
KLK14 expression, which encodes KLK (kallikrein) 14, an
extracellular serine protease which has been shown to cleave and digest various extracellular matrix proteins such as collagen IV, laminin and fibronectin [24]. In addi-tion, EGC up-regulated PTK2 expression in IEC which may result in increased expression of FAK (Focal Adhesion Kinase) protein, a major regulator of focal adhesions turn-over and maturation [25]. Finally, EGC induced an up-regulation of KRT8 expression whose increased expression has recently been shown to cause enhanced adhesion of human breast tumor cells to their extracellular matrix [26].
In conclusion, our data suggest that EGC regulation of IEC transcriptome leads to an increase in cell adhesion. In order to functionally validate this hypothesis, we per-formed in vitro experiments using established adhesion assays. Under these conditions, we first showed that IEC global adhesion was increased after 24 hours of culture with EGC as compared to control (Figure 4A). We next
confirmed whether these effects were in part associated with an increase in cell-to-matrix adhesion as the majority of IEC genes regulated by EGC presence appeared to favor cell-to-matrix adhesion. Indeed, cell-to-matrix adhesion assays revealed that EGC significantly increased IEC adhe-sion to the filter as compared to control (Figure 4B).
Cell differentiation
EGC also regulated the expression of numerous genes involved in IEC differentiation. In particular, EGC up-reg-ulated the expression of 6 genes enhancing differentiation and down-regulated 3 genes known to inhibit IEC differ-entiation (Table 7).
EGC induced an up-regulation of the expression of pro-differentiative genes or genes associated with enhanced differentiation of IEC such as PPARG, LAMA5, PTK2,
CDH-1, DCTN2 and DYNLT3. Indeed, PPARγ, encoding
the well-described nuclear receptor superfamily member peroxisome proliferator-activated receptor gamma (PPAR-γ) has been shown to regulate IEC differentiation and its expression has been positively correlated with level of differentiation of Caco-2 and HT29 cells [27,28]. More-over, a diminution of laminin-a5 in a murine model resulted in a transformation from a small intestinal to a colonic mucosal architecture, suggesting that laminin-α5 has a crucial role in establishing and maintaining the architecture of the small intestine [29]. In addition, it has already been shown that the differentiation of Caco-2
PRC1 BC005140 protein regulator of cytokinesis 1 50,13 1,50
IMPDH2 NM_000884 IMP (inosine monophosphate) dehydrogenase 2 49,46 1,49
/ AF202922 LRP16 protein 48,20 1,48
PLD3 NM_012268 phospholipase D family, member 3 46,99 1,47
RNF4 NM_002938 ring finger protein 4 44,88 1,45
/ AC060225 Homo sapiens 3 BAC RP11-23J16 complete sequence.
42,10 1,42
SMARCA1 NM_003069 SWI/SNF related, matrix associated, actin dependent regulator of chromatin, subfamily a,
member 1
41,18 1,41
DYNLT3 NM_006520 dynein, light chain, Tctex-type 3 40,06 1,40
PPARG NM_015869 peroxisome proliferative activated receptor, gamma
38,92 1,39
GLRX AF069668 glutaredoxin (thioltransferase) 37,78 1,38
PTK2 NM_153831;NM_005607 PTK2 protein tyrosine kinase 2 37,72 1,38 CDH1 NM_004360 cadherin 1, type 1, E-cadherin (epithelial) 36,87 1,37
RNASE4 NM_002937 ribonuclease, RNase A family, 4 31,40 1,31
CTSH NM_004390 cathepsin H 29,45 1,29
MKI67 NM_002417 antigen identified by monoclonal antibody Ki-67 29,28 1,29 EIF2A NM_032025 eukaryotic translation initiation factor 2A, 65 kDa 26,54 1,27 TGFBI BC000097 transforming growth factor, beta-induced, 68 kDa 25,95 1,26 MLLT3 NM_004529 myeloid/lymphoid or mixed-lineage leukemia
(trithorax homolog, Drosophila); translocated to, 3
22,42 1,22
APOBEC3B NM_004900 apolipoprotein B mRNA editing enzyme, catalytic polypeptide-like 3B
22,20 1,22
ADD3 NM_019903 adducin 3 (gamma) 20,82 1,21
FTH1 NM_002032 ferritin, heavy polypeptide 1 15,97 1,16
cells was accompanied by an increase in FAK expression [30]. E-Cadherin, whose corresponding gene CDH-1 is up-regulated by EGC, has been largely demonstrated to be
involved in the establishment of a differentiated pheno-type for IEC. Notably, E-Cadherin has been described to be less expressed at the bottom of the crypts where IEC are
Table 2: List of the genes down-regulated by enteric glial cells in intestinal epithelial cells.
Gene Symbol Genbank Description % down-regulation (/control) Fold difference
CARD12 AF376061 caspase recruitment domain family, member 12 83,43 6,04
KLK14 NM_022046 kallikrein 14 62,46 2,66
FGFR2 NM_022970 fibroblast growth factor receptor 2 57,12 2,33
BDP1 NM_018429 B double prime 1, subunit of RNA polymerase III transcription initiation factor IIIB
56,58 2,30
SFRP4 NM_003014 secreted frizzled-related protein 4 55,26 2,24
C6 NM_000065 complement component 6 54,78 2,21
PRKCD NM_006254 protein kinase C, delta 54,67 2,21
/ XM_066534 Homo sapiens diacylglycerol kinase, kappa (DGKK), mRNA.
52,44 2,10
C20orf133 NM_001033086 chromosome 20 open reading frame 133 52,36 2,10
PRKCQ NM_006257 protein kinase C, theta 50,50 2,02
CDK5R1 NM_003885 cyclin-dependent kinase 5, regulatory subunit 1 (p35) 50,42 2,02
RPP40 NM_006638 ribonuclease P 40 kDa subunit 47,41 1,90
SLC30A1 AF323590 solute carrier family 30 (zinc transporter), member 1 46,22 1,86 TIMM8A NM_004085 translocase of inner mitochondrial membrane 8
homolog A (yeast)
41,07 1,70
EBNA1BP2 NM_006824 EBNA1 binding protein 2 36,39 1,57
ITGAE NM_002208 integrin, alpha E
(antigen CD103, human mucosal lymphocyte antigen 1; alpha polypeptide)
36,17 1,57
NOL1 NM_006170 nucleolar protein 1, 120 kDa 33,86 1,51
C6orf66 NM_014165 chromosome 6 open reading frame 66 33,81 1,51
NOL5A NM_006392 nucleolar protein 5A (56 kDa with KKE/D repeat) 33,30 1,50
BAG1 U46917 BCL2-associated athanogene 32,19 1,47
/ AF123534 nucleolar protein NOP5/NOP58 32,14 1,47
ASAH1 AK025211 N-acylsphingosine amidohydrolase (acid ceramidase) 1 29,98 1,43 TINAGL1 AF236150 tubulointerstitial nephritis antigen-like 1 29,62 1,42
AADAC NM_001086 arylacetamide deacetylase (esterase) 29,48 1,42
HSPA14 AF112210 heat shock 70 kDa protein 14 29,34 1,42
PSMC6 NM_002806 proteasome (prosome, macropain) 26S subunit, ATPase, 6
29,31 1,41
HNRPDL D89678 heterogeneous nuclear ribonucleoprotein D-like 28,40 1,40
SAMHD1 NM_015474 SAM domain and HD domain 1 28,12 1,39
TP53RK NM_033550 TP53 regulating kinase 26,99 1,37
MARK2 NM_004954 MAP/microtubule affinity-regulating kinase 2 26,41 1,36
CCR9 NM_031200 chemokine (C-C motif) receptor 9 24,74 1,33
RGL1 NM_015149 ral guanine nucleotide dissociation stimulator-like 1 24,20 1,32
E2F1 NM_005225 E2F transcription factor 1 23,90 1,31
PSMC1 NM_002802 proteasome (prosome, macropain) 26S subunit, ATPase, 1
23,75 1,31
IMP3 NM_018285 IMP3, U3 small nucleolar ribonucleoprotein, homolog (yeast)
23,48 1,31
RNU3IP2 BC023662 RNA, U3 small nucleolar interacting protein 2 23,41 1,31 SMAD3 NM_005902 SMAD, mothers against DPP homolog 3 (Drosophila) 21,49 1,27 GPX2 NM_002083 glutathione peroxidase 2 (gastrointestinal) 21,27 1,27
LSP1 NM_002339 lymphocyte-specific protein 1 21,21 1,27
FGG NM_021870 fibrinogen gamma chain 18,37 1,23
C20orf94 NM_001009608 chromosome 20 open reading frame 94 16,04 1,19 PPIL1 NM_016059 peptidylprolyl isomerase (cyclophilin)-like 1 14,74 1,17
HOXB2 NM_002145 homeobox B2 13,91 1,16
APOH NM_000042 apolipoprotein H (beta-2-glycoprotein I) 13,17 1,15
PRSS23 NM_007173 protease, serine, 23 10,41 1,12
undifferentiated [16,31,32]. The down-regulation by EGC of CDK5R1 expression, leading to enhanced levels of E-Cadherin (see previous paragraph), might also further enhance EGC-induced cell differentiation. EGC also increased DCTN2 and DYNLT3 expression, two genes encoding a subunit of dynactin (p50 or dynamitin) and dynein light chain rp3, respectively. Both are involved in post-Golgi movement of vesicles towards apical surface of differentiated enterocytes [33-35], and could therefore reflect increased differentiation of IEC induced by EGC. Intriguingly, although differentiation of the Caco-2 cell line has been shown to be correlated with a down-regula-tion in fibronectin expression [36], EGC induced an up-regulation in FN1 expression in IEC in our study.
EGC decreased the expression of genes that encode pro-teins implicated in anti-differentiative pathways such as
E2F1, BAG1 and CDK5R1 (discussed above). E2F1 is a
gene encoding a protein member of the E2F family of transcription factors and has been shown to be down-reg-ulated in confluent human IEC and differentiated entero-cytes [37]. BAG1, encoding a Bcl-2 non-homologous associated molecule, has also been shown to present a decreasing gradient of expression from the base of the
crypts to the apex of the villi, suggesting that the down-regulation of BAG1 might reflect a differentiation state of IEC [38].
In conclusion, based on our analysis, EGC-mediated reg-ulation of IEC transcriptome appears to strongly favor IEC differentiation.
Cell motility
EGC regulated in IEC the expression of genes encoding proteins that are known to play a role in IEC motility (Table 8). In particular, EGC induced an increase in FN1 expression in IEC. FN1 has been demonstrated as a major factor in promoting cell migration of IEC and subepithe-lial fibroblasts, thus favoring epithesubepithe-lial wound healing [39,40]. Interestingly, EGC induced a down-regulation in
LSP1 expression in IEC. LSP1 gene encodes for LSP1, a
cytoplasmic actin-binding protein, whose overexpression in melanoma cells has been described to inhibit cell motility [41]. EGC-induced up-regulation of PTK2 expres-sion also supports a role of EGC in promoting IEC motil-ity. Indeed, increased FAK protein level promoted epithelial restitution via an increased IEC migration [42,43]. Similarly, the increased PPARγ expression could
Enteric glial cells EGC) and fibroblasts differentially modulated intestinal epithelial cell (IEC) transcriptome
Figure 2
Enteric glial cells EGC) and fibroblasts differentially modulated intestinal epithelial cell (IEC) transcriptome. (A). Real-time quantitative PCR studies on CDH1(n = 5), FN1 (n = 7), LAMA5 (n = 6), PPARG (n = 5), PTK2 (n = 5), E2F1 (n = 7),
FGFR2 (n = 6), GPX2 (n = 8), SMAD3 (n = 7) gene expression in IEC cultured for 24 hours alone (- EGC) or in presence of
EGC(+ EGC) confirmed that EGC significantly modulate the level of expression of genes identified by the microarrays data analysis as differentially expressed in IEC cultured in presence of EGC (*p < 0.05; Mann-Whitney test). (B). In contrast, real-time quantitative PCR studies on CDH1 (n = 5), FN1 (n = 5), LAMA5 (n = 5), PPARG (n = 5), PTK2 (n = 5), E2F1 (n = 5), GPX2 (n = 5), SMAD3 (n = 5) gene expression in IEC cultured for 24 hours alone (- fibroblasts) or in presence of fibroblasts (+fibrob-lasts) showed a differential regulation of gene expression as compared to EGC effects (*p < 0.05; Mann-Whitney test).
relative gene expression
(in % to control)
relative gene expression
(in % to control)
A
B
relative gene expression
(in % to control) 0 50 100 150 200 250 300
CDH1 FN1 LAMA5 PPARG PTK2 E2F1 GPX2 SMAD3 FGFR2
-EGC +EGC (in % to control) 0 50 100 150 200 250 300
CDH1 FN1 LAMA5 PPARG PTK2 E2F1 GPX2 SMAD3
-Fibroblasts +Fibroblasts * * * * * * * * * *
Hierarchical clustering of the 116 identified genes expression data
Figure 3
Hierarchical clustering of the 116 identified genes expression data. Four individual microarrays were used per condi-tion. Hierarchical clustering was performed on conditions and on the 116 genes identified with Genespring. Each ratio was nor-malized to the median of the t = 0 hour-condition values of the corresponding gene. Each column represents an individual array (T0: t = 0 hour condition samples; T8control: t = 8 hours of culture without EGC; T8glia: t = 8 hours of culture in presence of EGC; T24control: t = 24 hours of culture without EGC; T24glia: t = 24 hours of culture in presence of EGC). Each line repre-sents one individual gene. The clustering reveals clusters of genes with similar pattern of expression among the different condi-tions. The cluster also shows the distance between the five conditions demonstrating major changes induced by the culture with EGC at t = 24 hours.
enhance cell motility as inhibitors of PPARγ inhibit epi-thelial cell migration [44-46].
Cell proliferation
Expression of genes involved in cell proliferation was dif-ferentially regulated in IEC cultured in presence of EGC as compared to control (Table 9). In fact, EGC appeared to modulate the expression of anti-proliferative and pro-pro-liferative genes toward a dominant anti-propro-pro-liferative effect (Table 9).
The expression of major anti-proliferative and pro-prolif-erative genes was found to be up-regulated and down-reg-ulated, respectively, by EGC. In particular, PPARG, TXNIP and BTG1 expressions in IEC were up-regulated by EGC. PPARγ activation has been described both in vivo and in
vitro to inhibit intestinal epithelial cell proliferation
[47,48] and to induce a G1 phase cell cycle arrest [27].
Furthermore, TXNIP encodes the thioredoxin-interacting protein, a negative regulator of thioredoxin. Thioredoxin is an important growth-promoting factor of IEC [49]. Moreover, TXNIP has also recently been suggested to be a tumor suppressor gene in hepatocellular carcinoma [50] and interestingly, TXNIP expression is decreased in color-ectal cancer and ulcerative colitis [51]. Similarly, BTG1 has been shown to negatively regulate cell proliferation and to present a maximal expression during G0/G1 phases of the cell cycle in fibroblasts [52]. Further rein-forcing the anti-proliferative effects of EGC on IEC is the EGC-induced down-regulation of the expression of pro-proliferative genes such as E2F1, FGFR2 and PPIL1. E2F1 is a gene encoding a protein member of the E2F family of transcription factors that regulate cell cycle progression by modulating expression of proteins required for the G1/S transition. It has been well described that growth stimula-tory signals lead to active E2F1 accumulation and S-phase
Table 3: Lists of differentially expressed genes involved in functional networks regulated in intestinal epithelial cells by enteric glial cells.
Ingenuity© top functions Genes list Score
Cell-To-Cell Signaling and Interaction Cell Morphology
Tissue Development
CDH1, FN1, ITGAE, KRT8, KRT18, MGLL, NPPB, PKN2, PPARG, PRKCD, PSMC1, PSMC6, PTK2, SAT, SMAD3, TGFBI, VIP
26
Cellular Growth and Proliferation Cancer
Gene Expression
B4GALT5, BAG1, BNIP3 (includes EG:664), CCR9, DCTN2, EBNA1BP2, HCAP-D3, LSP1, MLLT3, PNRC1, PPIL1, PRC1, RNF4, SAT, SLC30A1,
TP53RK
24
Cell Morphology Cellular Development
Cardiovascular System Development and Function
AASS, ACTG2, BNIP3L, BTG1, CTSH, DYNLT3, EIF4A2, GLRX, MKI67, PLOD2, RNASE4, SLC2A1, SLC7A7, TXNIP
20
Cellular Movement
Hematological System Development and Function Immune Response
APOBEC3B, ASAH1, C6, FTH1, IL18, IQGAP2, LAMA5, LAMC1, NOL5A, NOP5/NOP58, PLD3, PRKCQ, PRSS23, SCPEP1
20
Cell Death Cancer
Gastrointestinal Disease
APOH, ASS, BDP1, BTG1, CARD12, CASP4, E2F1, FGFR2, FGG, NOL1, RGL1, SMARCA1, SNX2, TOP2A
20
Cell Cycle
Gastrointestinal Disease Developmental Disorder
ADD3, ANKRD1, CDK5R1, EPB41L2, GPX2, HNRPDL, HOXB2, IMPDH2, MARK2, PKN2, PLAC8, POLR3F, SFRP4, TUBB3
20
RNA Post-Transcriptional Modification IMP3 2
RNA Post-Transcriptional Modification EIF2A 2
Protein Trafficking Cellular Compromise
Auditory and Vestibular System Development and Function
TIMM8A 1
RNA Post-Transcriptional Modification RNA Damage and Repair
entry [53,54]. FGFR2 encodes a member of the FGF (Fibroblast Growth Factor) receptor family with high affinity for KGF (Keratinocyte Growth Factor) which is a major actor in the mesenchymal stimulation of epithelial cell proliferation [55,56]. Finally, PPIL1, which encodes a cyclophilin-related protein, PPIL1 (peptidyl prolyl iso-merase-like protein), implicated in spliceosome activa-tion, has recently been described to be overexpressed in colon tumors and PPIL1 silencing led to an inhibition of colon cancer cell growth [57,58].
These global anti-proliferative effects of EGC upon IEC have to be associated with the EGC-induced modulation of genes that would tend to be pro-proliferative, although these are clearly in reduced numbers. For instance, EGC increase MKI67 expression, which encodes the
prolifera-tion marker Ki-67. Indeed, Ki-67 is increasingly expressed during the cell cycle phases [59], excepted in G0 or in cells just escaping from G0 [60]. Its function is still unclear but knock-down for Ki-67 in cancerous cells leads to an inhi-bition of proliferation mainly via an induction of apopto-sis [61,62]. Interestingly, EGC reduced the expression of
TP53RK and SFRP4 in IEC that encode proteins involved
in anti-proliferative pathways. TP53RK encodes PRPK which is a short kinase that phosphorylates p53, enhanc-ing its transcriptional activity [63] and suppressenhanc-ing cell cycle transition G1/S [64]. SFRP4 encodes the protein sFRP4 (secreted frizzled-related protein), which is an inhibitor of the Wnt-signaling cascade through binding and sequestering Wnt ligand and, thus, has been shown to decrease cell proliferation in many cell lines [65-67].
Table 4: Lists of differentially expressed genes involved in cellular and molecular functions regulated in intestinal epithelial cells by enteric glial cells.
Ingenuity© cellular and molecular functions Genes list Score
RNA Post-Transcriptional Modification NOP5/NOP58, NOL5A, EBNA1BP2, RNU3IP2, IMP3 5.17 Cell Death GPX2, SAT, PRKCD, B4GALT5, TXNIP, TOP2A, CDH1, PKN2, ASAH1, LSP1,
BNIP3L, NPPB, CDK5R1, ANKRD1, VIP, CASP4, GLRX, FGFR2, KRT18, BAG1, PRKCQ, BTG1, PPARG, C6ORF66, SLC2A1, CARD12, SMAD3, FTH1, LAMA5,
PTK2, IL18, MLLT3, FN1, PLAC8, KRT8, TGFBI, BNIP3, E2F1, SFRP4
4.85
Cell-To-Cell Signaling and Interaction APOH, PRKCD, SMAD3, CDH1, PKN2, LAMA5, PTK2, VIP, IL18, FN1, FGG, KRT8, KRT18, BAG1, ITGAE, LAMC1, PPARG, TGFBI, E2F1
3.92 Cellular Development SMAD3, PRKCD, CDH1, LAMA5, VIP, PTK2, IL18, CDK5R1, FGFR2, FN1, PLAC8,
PRKCQ, LAMC1, PPARG, E2F1
3.92 Cell Morphology SMAD3, PRKCD, CDH1, LAMA5, LSP1, DCTN2, VIP, IL18, PTK2, CDK5R1, FN1,
KRT8, KRT18, PPARG, TGFBI, E2F1
3.88 Cellular Assembly and Organization APOH, PRKCD, SMAD3, TOP2A, CDH1, DCTN2, EBNA1BP2, NPPB, PTK2,
CDK5R1, HCAP-D3, FN1, FGG, KRT8, KRT18, MARK2, LAMC1, PPARG, BNIP3, E2F1
3.88
Carbohydrate Metabolism FN1, B4GALT5, NPPB, PTK2, IL18 3.11
Cellular Movement HOXB2, CCR9, C6, B4GALT5, SMAD3, PRKCD, MGLL, CDH1, LSP1, LAMA5, DCTN2, NPPB, CDK5R1, VIP, PTK2, IL18, FN1, BAG1, ITGAE, PPARG, TGFBI
3.08 Cellular Growth and Proliferation SAT, PRKCD, TXNIP, SMAD3, CDH1, FTH1, LAMA5, SLC30A1, EBNA1BP2, VIP,
IL18, PTK2, MLLT3, FGFR2, FN1, PLAC8, BAG1, PRKCQ, BTG1, LAMC1, PPARG, BNIP3, E2F1, SFRP4
3.05
Cell Cycle HCAP-D3, FN1, TXNIP, PRKCD, TOP2A, DCTN2, PPARG, EBNA1BP2, E2F1, VIP 2.57 Molecular Transport FGFR2, SAT, FN1, PRKCD, MGLL, BAG1, FTH1, PPARG, NPPB, PTK2, VIP, IL18 2.45
Nucleic Acid Metabolism SAT, BAG1, NPPB, VIP 2.45
Small Molecule Biochemistry APOH, SAT, PRKCD, B4GALT5, MGLL, FTH1, ASAH1, NPPB, PTK2, IL18, VIP, ASS, GLRX, FGFR2, FN1, BAG1, PPARG
2.45 Cellular Function and Maintenance CCR9, SMAD3, CDH1, SLC30A1, PTK2, IL18, CDK5R1, FN1, FGG, KRT18, ITGAE,
PPARG, BNIP3
2.25 DNA Replication, Recombination, and Repair HCAP-D3, FN1, SMAD3, PRKCD, TOP2A, FTH1, DCTN2, EBNA1BP2 2.17 Gene Expression APOH, SMAD3, PRKCD, CDH1, PKN2, VIP, IL18, FN1, BAG1, PRKCQ, RNF4,
PPARG, E2F1
2.13
Cell Signaling ASS, FN1, PRKCD, PPARG 2.02
Amino Acid Metabolism ASS, FTH1 1.94
Cellular Compromise PRKCD, KRT18, TIMM8A, PPARG, E2F1 1.94
Drug Metabolism GLRX, FTH1, NPPB, IL18, VIP 1.94
Lipid Metabolism FGFR2, APOH, SAT, FN1, MGLL, ASAH1, PPARG, NPPB, VIP 1.94
Post-Translational Modification PRKCD, BAG1, PRKCQ 1.94
Protein Folding BAG1 1.94
Protein Synthesis BAG1, IL18 1.94
Taken together, these data suggest that EGC tend to shift IEC transcriptome toward an anti-proliferative pheno-type. These results could lead to the identification of spe-cific targets responsible for the anti proliferative effects of EGC previously reported [12]. In addition, this global effect is supported further by the observation that EGC inhibit cell proliferation in part by inducing a cell cycle arrest in G0/G1 phase [11].
Cell survival
EGC differentially regulated in IEC the expression of genes involved in cell death. EGC appeared to modulate the expression of anti-apoptotic and pro-apoptotic genes toward a dominant pro-apoptotic effect (Table 10). Indeed, expressions of pro-apoptotic and anti-apoptotic genes were found to be up-regulated and down-regulated, respectively, by EGC. In particular, BNIP3 and CASP4 expression in IEC were up-regulated by EGC. CASP4, cod-ing for the caspase-4 pro-apoptotic protein has been
Table 5: Lists of differentially expressed genes involved in signalling pathways regulated in intestinal epithelial cells by enteric glial cells.
Ingenuity© Signalling Pathway Genes Ratio
Circadian Rhythm Signaling VIP 0.046
Cell Cycle: G1/S Checkpoint Regulation SMAD3, E2F1 0.041
Integrin Signaling ACTG2, FN1, LAMA5, LAMC1, PTK2 0.03
Actin Cytoskeleton Signaling TMSB4Y, FGFR2, FN1, ITGAE, IQGAP2, PTK2 0.029
Cell Cycle: G2/M DNA Damage Checkpoint Regulation TOP2A 0.029
VEGF Signaling ACTG2, PTK2 0.029
Complement and Coagulation Cascades FGG, C6 0.028
Amyloid Processing CDK5R1 0.028
ERK/MAPK Signaling PRKCD, PPARG, PTK2 0.024
Wnt/β-catenin Signaling CDH1, MARK2, SFRP4 0.022
FGF Signaling FGFR2 0.018
Chemokine Signaling PTK2 0.018
TGF-β Signaling SMAD3 0.016
Protein Ubiquitination Pathway PSMC6, PSMC1, BAG1 0.016
PPAR Signaling PPARG 0.015
IGF-1 Signaling PTK2 0.015
Apoptosis Signaling PRKCQ 0.015
Neuregulin Signaling CDK5R1 0.015
PTEN Signaling PTK2 0.014
Fc Epsilon RI Signaling PRKCD 0.014
T Cell Receptor Signaling PRKCQ 0.014
Xenobiotic Metabolism Signaling PRKCD, PRKCQ 0.010
NF-κB Signaling PRKCQ 0.009
B Cell Receptor Signaling PRKCQ 0.009
Ephrin Receptor Signaling PTK2 0.009
Leukocyte Extravasation Signaling PTK2 0.008
Huntington's Disease Signaling CDK5R1 0.007
Axonal Guidance Signaling PTK2 0.004
Table 6: Genes controlling intestinal epithelial cells adhesion and modulated by enteric glial cells.
Pro-adhesive Anti-adhesive
Gene Symbol Regulation of gene expression by EGC Gene Symbol Regulation of gene expression by EGC
CDH1 up-regulated CDK5R1 down-regulated
IQGAP2 up-regulated KLK14 down-regulated
LAMA5 up-regulated
LAMC1 up-regulated
FN1 up-regulated
PTK2 up-regulated
shown to induce cell death [68,69], like BNIP3 which encodes a pro-apoptotic protein member of Bcl-2 family [70,71]. Conversely, ASAH-1, GPX2 and BAG-1 were down-regulated by EGC. BAG-1 encodes a known anti-apoptotic protein implicated in Bcl-2 signalling pathway [72,73]. ASAH-1 encodes acid ceramidase, an enzyme that catabolizes ceramide into sphingosine by deacylation. Overexpression of acid ceramidase in cells confers on them an increased resistance to cell death induced by var-ious factors such as TNF (tumor necrosis factor) or anti-cancerous drugs [74,75]. Finally, GPX2 encodes a member of the glutathione peroxidase (GPX) family and is a selenoprotein and a glutathione peroxidase. GPX2 is expressed in IEC [76] and inhibits oxidative stress-induced apoptosis in the human breast adenocarcinoma cell line MCF-7 [77].
These global pro-apoptotic effects of EGC upon IEC have to be considered also in view of the EGC-mediated regu-lation of genes which would tend to be anti-apoptotic, although these are in reduced number. In particular, EGC up-regulated the expression of TUBB3, a gene encoding the class III isotype of tubulin. Silencing of class III β-tubulin by siRNA reverted anti-cancer agent-resistant cells
to a sensitive phenotype and promoted apoptosis [78,79]. Conversely, EGC inhibited the expression of CARD12 which encodes the CARD12 protein, a member of the CED4/Apaf-1 family and known to induce apoptosis when expressed in cells [80,81].
EGC-induced regulation of genes involved in cell death has probably no clear consequences on IEC survival. This is consistent with a previous study showing that EGC did not modify IEC survival [12].
Conclusion
The present study described the impact of EGC upon the transcriptome of proliferating Caco-2 cells in a validated non-contact co-culture model of EGC and IEC [12,13]. The results obtained confirmed the known role of EGC in the control of some IEB functions and, more interestingly, extended their role in the control of novel major IEB and IEC functions. This study further reinforced the emerging concept that EGC are an important component of the IEB environment with major protective effects. Indeed, the major pathways regulated by EGC in IEC identified with microarrays lead to enhanced cell adhesion,
differentia-Enteric glial cells (EGC) induced an increase in intestinalepithelial cells(IEC) adhesion
Figure 4
Enteric glial cells (EGC) induced an increase in intestinal epithelial cells(IEC) adhesion. (A):EGC induced a signifi-cant increase in IEC total adhesion (i.e. without discriminating cell-to-matrix and cell-to-cell adhesion) after 24 hours of co-cul-ture in presence of EGC (+ EGC) as compared to control (- EGC) (n = 5; p = 0.008; Mann-Whitney test). (B): IEC were significantly more attached to their matrix when they were cultured for 24 hours with EGC (+ EGC) as compared to control (- EGC) (n = 13; p < 0.001; Mann-Whitney test).
percentage of adherent cells
(normalized to control)
B
*A
percentage of adherent cells
(normalized to control) 0 20 40 60 80 100 120 140 160 180 200 - EGC + EGC 0 20 40 60 80 100 120 140 160 - EGC + EGC *
Table 7: Genes controlling intestinal epithelial cells differentiation and modulated by enteric glial cells.
Pro-differentiative Anti-differentiative
Gene Symbol Regulation of gene expression by EGC Gene Symbol Regulation of gene expression by EGC
CDH1 up-regulated E2F1 down-regulated
PPARG up-regulated BAG1 down-regulated
LAMA5 up-regulated CDK5R1 down-regulated
PTK2 up-regulated FN1 up-regulated
DCTN2 up-regulated
tion, and motility, which could favor repair, and reduced cell proliferation.
An important result of this study is the putative identifica-tion of genes involved in the anti-proliferative effects of EGC. Indeed, EGC have been shown to have potent anti-proliferative effects upon IEC [11,12]. Interestingly, these effects were associated with an induction of a cell cycle blockade in the G0/G1 phase [11] but were not associated with significant cell death [12]. These results are globally confirmed, as there was no clear trend in the EGC-induced modulation of genes controlling cell survival in IEC but a trend toward an up-regulation of the expression of genes involved in anti-proliferative pathways.
A major finding of our study is that EGC regulated the expression of genes involved in cell adhesion and differ-entiation toward a global increase of IEC adhesive proper-ties. These results can be analyzed in view of the known effects of EGC upon IEB. Indeed, in vitro studies have shown that EGC increase IEB resistance and decrease IEB paracellular permeability [13]. In the present study, we also demonstrated that EGC could increase global IEB adhesion, in part by increasing cell-to-matrix adhesion. These results are in agreement with in vivo data showing that selective lesions of EGC lead to increased paracellular permeability and major IEB breakdown associated with the development of intestinal inflammation. However, the role of the molecular actors involved in these proc-esses such as fibronectin, laminin or cytokeratin remains to be investigated. EGC might also favor barrier integrity by increasing its resistance to inflammatory stress either by its ability to down-regulate inflammatory genes such as
CARD12 or by increasing IEC production of
anti-inflam-matory mediators such as VIP [82,83].
Another important finding of this study is the observation that EGC might regulate IEC metabolism. In particular, EGC up-regulated genes involved in lipid metabolism such as AADAC, MGLL or APOH, encoding respectively the arylacetamide deacetylase, monoglyceride lipase (MGL) and Apolipoprotein H [84-86]. Interestingly, inhibitors of MGL which is a serine hydrolase that con-verts 2-arachidonoylglycerol, a ligand of canabinoid receptors, to fatty acids and glycerol, increased gut transit time [87] but its impact on IEB functions remain unknown. EGC also modulated the expression of genes involved in protein metabolism such as CTSH that encodes cathepsin H, a lysosomal cysteine proteinase [88]. In addition, EGC increased the expression of genes involved in arginine metabolic pathway that are SLC7A7 and ASS, which encode respectively for the cationic amino acid transporter y(+)LAT1 and the argininosuccinate syn-thetase, enzyme catalyzing the penultimate step of the arginine biosynthetic pathways. The functional impact of EGC upon IEC metabolism needs to be investigated in future studies.
Regulation of IEB functions by EGC occurs mainly via paracrine pathways. The majority of EGC effects upon IEB functions are reproduced by glial-derived conditioned medium. In addition, various mediators have been iden-tified as being involved in the control of cell proliferation or paracellular permeability. Our study supports the role of mediators such as TGF-β1 as a regulator of gene path-ways modulated by EGC in IEC. In fact, TGF-β1 has been shown to increase the expression of FAK [43], TGFBI [89] or VIP [90]. EGC have also been shown to produce IL-6 [91]. IL-6 has recently been identified as a key molecule involved in IEB barrier protection via increasing both cytokeratin 8 and cytokeratin 18 proteins expression [92], whose mRNA expression were induced by EGC in IEC in
Table 8: Genes controlling intestinal epithelial cells motility and modulated by enteric glial cells.
Pro-motility Anti-motility
Gene Symbol Regulation of gene expression by EGC Gene Symbol Regulation of gene expression by EGC
PPARG up-regulated LSP1 down-regulated
FN1 up-regulated
PTK2 up-regulated
Table 9: Genes controlling intestinal epithelial cells proliferation and modulated by enteric glial cells.
Pro-proliferative Anti-proliferative
Gene Symbol Regulation of gene expression by EGC Gene Symbol Regulation of gene expression by EGC
E2F1 down-regulated TXNIP up-regulated
FGFR2 down-regulated BTG1 up-regulated
PPIL1 down-regulated TP53RK down-regulated
our study. In this context, knowledge of genes modulated by EGC could direct future efforts aimed at identifying novel glial mediators involved in EGC control of IEB func-tions. Our data also further suggest that EGC differentially regulate some IEB functions as compared to fibroblasts, although comparison has only been performed on a lim-ited set of genes and one cannot fully rule out that species differences could also be involved (fibroblasts of human origin vs. enteric glia of rat origin). However, these differ-ences are consistent with the observation that while EGC have anti-proliferative effects on both human and rat IEC [12], fibroblasts increase IEC proliferation [93].
Collectively, our data support the concept that EGC play a key protective role upon IEB homeostasis by reinforcing global barrier functions. Additionally, our study rein-forces data suggesting that enteric glia lesions and/or func-tional defects could be involved in the development of pathologies with altered barrier (such as inflammatory bowel diseases or colorectal cancer) and also be associated with increased barrier susceptibility to pathogen aggres-sion.
Methods
Cell culture
CRL2690 (ATCC), a transformed EGC line isolated from adult rat myenteric plexus, was cultured in DMEM (4.5 g/ L glucose; Gibco) supplemented with 10% heat-inacti-vated FBS, 2 mM glutamine (Gibco), 50 IU/mL penicillin and 50 μg/mL streptomycin. EGC were seeded at a con-centration of 30,000 cells/mL in 6- and 12-well plates (Corning, Avon, France). EGC were cultured for an addi-tional 24 hours after having reached confluence prior co-culture with IEC. CCD-18Co, a human colonic fibroblast cell line, was cultured in MEM Alpha Medium (Gibco) supplemented with 10% heat-inactivated FBS, 2 mM glutamine (Gibco), 0.1 mM MEM NEAA (Gibco), 50 IU/ mL penicillin and 50 μg/mL streptomycin. Fibroblasts were seeded at a concentration of 130,000 cells/mL in 12-well plates (Corning). Fibroblats were cultured in EGC medium, as described above, for an additional 24 hours after having reached confluence prior co-culture with IEC. Caco-2 cells (ATCC), isolated from a human colonic ade-nocarcinoma, were cultured in DMEM (4.5 g/L glucose; Gibco) supplemented with 10% heat-inactivated FBS, 2
mM glutamine (Gibco), 50 IU/mL penicillin and 50 μg/ mL streptomycin and were seeded at a concentration of 140,000 cells/mL onto porous Transwell filters (6-well and 12-well Transwell clear, 0.40 μm porosity, Corning). Caco-2 cells were processed for experiment 1 day after their seeding. To characterize EGC impact onto IEC tran-scriptome and functions, IEC seeded onto filters were cul-tured in presence of EGC seeded at the bottom of the 6-well or 12-6-well plates.
Microarray experiments
Transcriptomic analysis was performed with a microarray of 6,864 genes called "Cancerochip" and available from the West Genopole transcriptome core facility of Nantes. These Cancerochips contained 6,864 probes (50-mers oli-gonucleotides), each specific of a single gene. These genes were selected to be preferentially and/or differentially expressed in Caco-2 cells and in various tumours. Three replicates of each probe were spotted onto Cancerochips. This allowed the measurement of the probes reproducibil-ity within the array.
Total RNA was extracted from Caco-2 cells cultured on 6-well filters alone or in presence of EGC at t = 0, 8 and 24 hours. Each condition was performed in 4 replicates allowing the measurement of the reproducibility of the cell culture experiments. RNA extraction was performed with RNeasy mini kit (Qiagen) according to the manufac-turer's recommendations.
The protocols used for subsequent amplification and labelling were described in the DNA chips platform pro-tocols. Each individual sample was compared to a refer-ence pool consisting of Caco-2 cells transcripts of the four replicates extracted at t = 0 hour. Total RNA (0.5 μg) was amplified and labelled using the Amino Allyl Mes-sageAmp II aRNA Amplification kit (Ambion) and CyDye Post Labelling Reactive Dyes (Amersham). After reverse transcription to synthesize first strand cDNA, second strand cDNA was subsequently synthesized following the manufacturer's protocol. In vitro transcription was then achieved in order to amplify the initial transcripts quan-tity, concomitantly with aminoallyl-dUTP incorporation to perform labelling with cyanins (Cy5 for the reference and Cy3 for samples). The hybridization of the chips was
Table 10: Genes controlling intestinal epithelial cells survival and modulated by enteric glial cells.
Pro-apoptotic Anti-apoptotic
Gene Symbol Regulation of gene expression by EGC Gene Symbol Regulation of gene expression by EGC
BNIP3 up-regulated BAG1 down-regulated
CASP4 up-regulated ASAH1 down-regulated
CARD12 down-regulated GPX2 down-regulated
performed following the protocol of the West Genopole transcriptome core facility of Nantes. After washing, the chips were scanned (Scanexpress- Perkin Elmer).
Data analysis
After acquisition, the scanned images were analyzed using GenePix Pro v5.1 software (Axon). Raw signals were proc-essed using the MADSCAN package http://cardios erve.nantes.inserm.fr/mad/madscan/. Spots with weak, saturated signal or badly shaped were considered as miss-ing values. Print-tip lowess was applied to raw signals to normalize both channels (Cy3 and Cy5) of a same array. Fitting coefficients were calculated on rank invariant spots, assuming that they correspond to ubiquitous genes (genes that did not vary between samples). Sample to ref-erence ratios (Cy3/Cy5) were further calculated, and Log transformed (Expression Logratios). Probes with more than 25% of missing values were rejected.
In order to identify differentially expressed genes, Expres-sion Logratios were analyzed using Genespring v7.0 soft-ware (Agilent Technologies). Genes differentially expressed between Caco-2 cells cultured alone or in pres-ence of EGC were searched with Benjamini and Hochberg False Discovery Rate method with a significance threshold of 0.05. This method includes a correction for multi-test-ing and has been widely used for microarray data [94]. This analysis led to the identification of 98 genes differen-tially expressed in IEC cultured in presence of EGC as compared to control, i.e. IEC cultured alone at t = 24 hours and none at t = 8 hours. Analysis of variance (ANOVA) using time of culture and presence/absence of ECG as parameters gave very similar results. Data visuali-zation using hierarchical clustering and Volcano-Plot sug-gested that this strategy might have missed some differentially expressed genes at t = 24 hours; we thus selected an additional set of genes based on expression fold-changes. Twenty seven genes with a fold-change threshold of 2 and a t-test p-value < 0.05 without multi-testing correction were found. Altogether 116 unique genes were found differentially expressed in IEC at t = 24 hours of culture in presence of EGC as compared to con-trol.
Hierarchical clustering was performed after normalization on medians of the ratio values of the t = 0 hour-condition samples. Hierarchical clustering was performed using the Cluster software. It was applied to order either genes and samples or genes only. It creates a visualization of the grouping of genes and samples based on profile similar-ity, even if it does not provide robustness assessment of the classification.
Among the 116 genes identified with Genespring analysis, 17 of them did not present reliable values at t = 0 hour.
Thus, these 17 genes were excluded from hierarchical clus-tering analyses. As a consequence, clusclus-tering analyses only involved 99 genes.
Microarray data were uploaded to GEO database http:// www.ncbi.nlm.nih.gov/geo/ and are available under the access number GSE17027.
RT-quantitative PCR
Extraction of total RNA from Caco-2 cells cultured alone, in presence of EGC or fibroblasts for 24 hours was per-formed with RNeasy Mini kit (Qiagen) according to the manufacturer's protocol. For reverse transcription, 1 μg of purified total RNA was denatured and subsequently proc-essed for reverse transcription using SuperScript II Reverse Transcriptase (Invitrogen) according to the manufac-turer's recommendations. PCR amplifications were per-formed using the Absolute Blue SYBR green fluorescein kit (ABgene) according to the manufacturer's protocol and run on MyiQ thermocycler (Biorad). The expression of the gene S6 was analyzed in parallel as an internal control.
CDH1 [GenBank: NM_004360] Forward primer: 5'-GACCAGGACTATGACTACTTGAACG-3' Reverse primer: 5'-ATCTGCAAGGTGCTGGGTGAACCTT-3' E2F1 [GenBank: NM 005225] Forward primer: 5'-CCGCTCGAGGAGAAGTCACGCTATGA-3' Reverse primer: 5'-CCCAAGCTTTTGGTGATGTCATAGATGC-3' FN1 [GenBank: NM_054034] Forward primer: 5'-GCAGGCTCAGCAAATGGTTCAG-3' Reverse primer: 5'-AGGTAGGTCCGCTCCCACTG-3' FGFR2 [GenBank: NM_022970] Forward primer:
5'-GTCCTGCCAAAACAGCAAG-3' Reverse primer: 5'-CCCCTATGCAGTAAATGGCTA-3' GPX2 [GenBank: NM_002083] Forward primer: 5'-gtccttggcttcccttgc-3' Reverse primer: 5'-tgttcaggatctcctcattctg-3' LAMA5 [GenBank: NM_005560] Forward primer: 5'-CCCACCGAGGACCTTTACTGC-3' Reverse primer: 5'-GGTGTGCCTTGTTGCTGTTGG-3' PPARG [GenBank: NM_138712/NM_005037/ NM_138711/NM_015869] Forward primer: 5'-ttgctgtcattattctcagtgga-3' Reverse primer: 5'-gaggactcagggtggttcag-3' PTK2 [GenBank: NM_153831/NM_005607] Forward primer: 5'- GAGATCCTGTCTCCAGTCTAC-3' Reverse primer: 5'- TGCACCTGCTATTTTTAGTTG-3' SMAD3 [GenBank: NM 005902] Forward primer: 5'-CCAAGCTTAGAACGGGCAGGAGGAG-3' Reverse primer: 5'-CACTCGAGTGGTGGCTGTGCAGGTC-3' S6 [GenBank: NM_001010] Forward primer: 5'-TGGCAAGATGATCCCAATGA-3' Reverse primer: 5'-AGCTTCTTTGGGACACCTGCT-3' Adhesion experiments
Global adhesion assay
IEC adhesion was estimated by performing a "global adhesion assay" that evaluated total IEC adhesion to their environment, i.e. adhesion to neighboring IEC and adhe-sion to matrix. IEC were cultivated on filters (12-well Transwell clear, 0.40 μm porosity, Corning) alone or in the presence of EGC for 24 hours. IEC were then trypsinized with 0.01% trypsin-EDTA free (Sigma) allow-ing gentle trypsinization for 30 minutes at 37°C. Non-adherent IEC were harvested and counted in a blind fash-ion using Malassez slides (VWR internatfash-ional). IEC remaining adhered on filters were trypsinized with 2.5% trypsin with EDTA (Gibco), harvested and counted. Results are expressed in percentage of remaining adherent IEC normalized to the total number of counted IEC (i.e., adherent IEC and non-adherent IEC). Only those series in which the percentage of IEC total adhesion in control con-dition was comprised between 20 and 70% were ana-lyzed.
Cell-to-matrix adhesion assay
IEC were cultivated on filters (12-well Transwell clear, 0.40 μm porosity, Corning) alone or in presence of EGC for 24 hours. IEC were then trypsinized for 10 minutes with a 2.5% trypsin-EDTA (Gibco). Trypsin was neutral-ized with IEC culture medium (see above). IEC were sub-sequently reseeded on filters and incubated for 3 hours at 37°C. Time of incubation has been defined to allow 50% of seeded IEC to adhere to filters in control condition. Fol-lowing incubation, unseeded cells were harvested and counted in a blind fashion using Malassez slides (VWR international). IEC that had adhered on filters were trypsinized and counted. Results are expressed in percent-age of adherent IEC normalized to the total number of counted IEC (i.e., adherent IEC and non-adherent IEC). Only those series in which the percentage of IEC total adhesion in control condition was comprised between 20 and 70% were analyzed.
List of abbreviations
CNS: Central nervous system; EGC: Enteric glial cells; ENS: Enteric nervous system; FAK: Focal adhesion kinase;