RESEARCH PAPER
Distribution of cadmium in leaves of Thlaspi caerulescens
Claudia Cosio1,*, Laura DeSantis1, Beat Frey2, Saliou Diallo1and Catherine Keller11
Ecole Polytechnique Fe´de´rale de Lausanne (EPFL), ENAC-ISTE, Laboratory of Soil Science, 1015 Lausanne, Switzerland
2
Swiss Federal Research Institute WSL, 8903 Birmensdorf, Switzerland Received 8 July 2004; Accepted 22 October 2004
Abstract
Knowledge of the intracellular distribution of Cd in leaves is necessary in order to understand the mech-anisms of hyperaccumulation in Thlaspi caerulescens. Ganges and Prayon, two ecotypes accumulating Cd to different levels, were grown in nutrient medium containing varying concentrations (0, 5, 10, 50, and 100 lM) of Cd. Several different approaches were com-bined in this study to (i) validate the results obtained by a specific method and (ii) establish the link between observations and measurements performed at different scales. In both ecotypes, Cd, localized by autoradiog-raphy, was found mainly at the edges of the leaves, but also in points of higher concentration spread over the whole limb surface. This localization was clearly correlated with the necrotic spots observed on Prayon leaves. Scanning electron microscopy coupled with energy dispersive X-ray microanalysis (cryo-SEM-EDXMA) and tissue fractionation (apoplasm, cell walls, mesophyll protoplasts, and lower epidermis) showed that Cd had similar patterns of distribution in leaf cells of both ecotypes. Cadmium was found both inside the cells and in the cell walls, mainly in the large epidermal cells but also in small epidermal cells. All the methods used agreed well and the results indicated that metal storage in the plants studied involves more than one compartment and that Cd is stored principally in the less metabolically active parts of leaf cells.
Key words: Autoradiography, cadmium (Cd), cell walls, com-partmentation, energy dispersive X-ray microanalysis, hyper-accumulation, metal storage, Thlaspi caerulescens.
Introduction
In view of the risk posed by Cd as an environmental
pollutant (Sanita` di Toppi and Gabbrielli, 1999;
Kabata-Pendias and Kabata-Pendias, 2001), there has been interest in
de-veloping the use of hyperaccumulator plants to extract Cd
from contaminated soils (Brown et al., 1995b; Hammer and
Keller, 2003). However, a lack of understanding of the
mechanisms involved in heavy metal tolerance and
hyper-accumulation prevents the optimization of the technique. It
is therefore a research priority to gain basic information on
sink capacities and transport mechanisms of Cd into the
cells of hyperaccumulator species.
Thlaspi caerulescens, a hyperaccumulator of Zn, Cd, and
Ni (depending on the population tested) has been recognized
as an interesting model for studying hyperaccumulation
(Assunc
xa˜o et al., 2003). However, to date no data are
available for Cd localization in leaves of T. caerulescens.
The major efforts have been focused on the assessment of
root uptake and Cd localization because this is the primary
step leading to hyperaccumulation. For example, kinetic
studies of Cd uptake in T. caerulescens were performed on
roots only (Lombi et al., 2001; Zhao et al., 2002) and Cd was
found in both the apoplast and the vacuole (Va´zquez et al.,
1992; Boominathan and Doran, 2003). Knowledge of Cd
intracellular localization in leaves, where concentrations are
higher, is necessary to improve current understanding
of Thlaspi caerulescens hyperaccumulation mechanisms.
Earlier studies have shown that the phytochemistry
in-volved in metal transport and storage seems to vary
consid-erably with plant species (Brooks et al., 1998). In tobacco
(Nicotiana rustica), Cd was localized predominantly in the
vacuoles of leaf cells (Vo¨geli-Lange and Wagner, 1990).
The cell walls were further identified as another site of Cd
storage in Zea mays shoots (Khan et al., 1984;
Lozano-Rodriguez et al., 1997). In Brassica napus leaves, Cd was
* Present address and to whom correspondence should be sent: Laboratory of Plant Physiology, Geneva University, 30 quai Ernest-Ansermet, 1211 Geneva 4, Switzerland. E-mail: Claudia.Cosio@bioveg.unige.chJournal of Experimental Botany, Vol. 56, No. 412,ª Society for Experimental Biology 2005; all rights reserved
found both in vacuoles and in cell walls (Carrier et al.,
2003). In Brassica juncea and Silene vulgaris, the leaf
epidermis was a major site of Cd accumulation (Salt et al.,
1995b; Chardonnens et al., 1998), whereas in Arabidopsis
halleri and B. napus the largest concentration of Cd was
found in the mesophyll (Ku¨pper et al., 2000; Carrier et al.,
2003).
However, due to low Cd concentrations found in plants
and methodological difficulties, in a number of studies the
cellular distribution of Cd has been analysed only in cell
fractions separated by biochemical or physical methods
(Va´zquez et al., 1992; Chardonnens et al., 1998; Carrier
et al., 2003) with the attendant possibility of artefacts and/
or Cd losses during preparation as mentioned by Frey et al.
(2000b). Moreover, physical methods such as atomic
absorption spectroscopy (AAS) after tissue disruption
(Brown et al., 1995a; Chardonnens et al., 1998), secondary
ion mass spectroscopy (SIMS) imaging (Lazof et al., 1996),
or short-term desorption with radiotracers (Lasat et al.,
1996; Blaudez et al., 2000) are appropriate to spot
compart-ments, but not to localize metals precisely. Energy dispersive
X-ray microanalysis (EDXMA), electron spectroscopic
imaging (ESI) and electron energy loss spectroscopy
(EELS) have been used with some success to plot the
subcellular distribution of metals (Nassiri et al., 1997;
Bringezu et al., 1999; Ku¨pper et al., 1999; Frey et al.,
2000a; Zhao et al., 2000), but lack of sensitivity and
interference with other cations (e.g. K) are limiting for Cd
detection.
To learn more about the general allocation of Cd in
leaves of T. caerulescens and to overcome the
methodo-logical difficulties described above, in the present study
different approaches were combined in order to (i) validate
the results obtained by a specific method and (ii) make the
link between observations and measurements performed at
different scales. Two different populations of T.
caerules-cens were compared: Ganges a Cd-hyperaccumulating
ecotype, and Prayon ecotype with a lower degree of
accumulation (Lombi et al., 2000; Zhao et al., 2003). The
concentrations tested were chosen according to the
sensi-tivity of the method employed. Macro-autoradiography was
conducted on plants grown in solution culture and treated
with increasing concentrations of Cd. Autoradiographs of
whole leaves were compared with visual symptoms,
bio-mass production, and metal concentrations in shoots at
various exposure times for the evaluation of the general
process of Cd allocation. The distribution of Cd at the
macroscopic level was completed by observation at the
cellular and subcellular levels in leaves by EDXMA
combined with cryo-scanning electron microscopy
(SEM-EDXMA) of leaf cuttings. Finally, biochemical and
phys-ical separation of leaves was performed to measure in detail
the involvement of different plant compartments
(apo-plasm, cell wall, mesophyll protoplasts, and epidermis) in
Cd storage.
Materials and methods
Plant material and cultureThe plants studied were T. caerulescens ecotype Ganges (‘Les Avinie`res’, St-Laurent-le Minier, southern France), a known Zn and Cd hyperaccumulator (Robinson et al., 1998), and T. caerules-cens ecotype Prayon (Belgium), known to hyperaccumulate Zn, but to accumulate Cd to a lesser degree (Lombi et al., 2000; Zhao et al., 2003).
Seeds were germinated in the dark on filter papers moistened with deionized water. Two-week-old seedlings were transferred to 1.0 l pots (four plants per pot) filled with modified quarter-strength Hoagland’s nutrient solution (Sigma, St Louis, USA) supplemented with 20 lM Fe-N, di (2-hydroxybenzyl) ethylenediamine-N, N9-diacetic acid monohydrochloride hydrate (HBED; Strem chemical, Newburyport, USA). Fe(III)-HBED was prepared as described by Chaney et al. (1998) in such a way that all HBED was saturated with Fe. Plants were allowed to grow for 2 weeks in solution culture before treatment with Cd was commenced.
Germination and plant culture were performed in a climate chamber (day/night period 16/8 h, day/night temperatures 20/16 8C, and a light intensity of 500 lx). The nutrient solution was renewed every week and aerated continuously.
The concentrations tested were chosen according to the sensitivity of the method employed. When necessary, and depending on the method chosen (see below) and the device used, labelled Cd (109Cd) was used alone or in addition to the different Cd treatments. Radiotracers are very convenient and sensitive for the determination of low concentrations in aqueous extracts, but they cannot be measured by b-counting in acidic samples or in intact leaves. When Cd had to be measured in such samples, unlabelled Cd was used in higher concentrations to allow detection by inductively coupled plasma-atomic emission spectroscopy (ICP-AES).
Biomass production and accumulation of Cd in plants The total concentration of Cd was measured in leaves of T. caerulescens Ganges and Prayon treated for 8 weeks with non-labelled Cd (0, 5, 10, 50, and 100 lM Cd). Four mature plants grown in hydroponics were harvested. Shoots were quickly rinsed with deionized water, separated from the roots, and dried at 80 8C for 1 week. Leaves were weighed and hot-digested in HNO3 65% suprapur (Fluka, Buchs, Switzerland) and HClO470% pro analysis (Fluka, Buchs, Switzerland). The concentration of Cd in digests was measured by ICP-AES (Plasma 2000; Perkin Elmer, Wellesley, USA).
Autoradiography of Cd in plants
For the macro-autoradiographs, both ecotypes of T. caerulescens were tested with four different treatments (0, 5, 10, and 50 lM Cd) and three times of exposure to the metal (3, 15, and 30 d). An additional treatment, 100 lM Cd, was included but for only 15 d. All nutrient solutions were labelled from the beginning of the Cd treatments with 0.1 kBq mlÿ1(=2.2310ÿ3lM) of109CdCl2(NEN Life Science Products, Boston, USA). Shoots were collected, quickly rinsed with deionized water, and then blotted dry. The samples were arranged as flat as possible and wrapped in a single layer of thin polyethylene film. To obtain autoradiographs of adaxial and abaxial sides, samples were sandwiched between 2 X-OMAT AR-5 autoradi-ography films (Kodak, Rochester, USA) at room temperature. Time of exposure varied from 2 h to 10 d depending on the109Cd activity present in the samples. Autoradiographs were developed with an automatic film processor (SRX-101A, Konica, Tokyo, Japan) and subsequently enumerated on a Linotype-Hell Tango digitizer (Heidelberg, Kiel, Germany). Control plants grown without 109Cd were processed at the same time to detect any possible artefacts on
the autoradiographs. Distribution of Cd within each leaf was deter-mined by examining the exposed film. Leaves of plants grown in 50 lM Cd were then individually dried at 80 8C, weighed, hot-digested for 1 h at 95 8C in HNO365% suprapur, and analysed for Cd concentration.
Energy dispersive X-ray microanalysis
The microanalysis of leaves was performed on both Ganges and Prayon populations grown for 8 weeks without Cd prior to growth for 4 weeks in nutrient solution supplemented with 100 lM Cd. The aim was to reach high biomass production and high Cd concentrations in the leaves and to avoid the problem of Cd phytotoxicity. Indeed, in contrast to seedlings, older plants were able to withstand this extremely high Cd concentration without showing toxicity symp-toms. Old leaves of plants grown in high Cd concentrations were used because preliminary analyses and autoradiographs had shown that Cd concentrations in the whole leaves were 10 times greater in old leaves. In fact, Cd could not be detected in young leaves or in plants grown in lower Cd concentrations. Fresh leaves were cut into small pieces (approximately 434 mm). The samples were mounted vertically on an SEM stub using a Tissue-Tek and rapidly frozen by plunging into liquid propane as previously described (Frey et al., 2000a). Microanalysis of freeze-fractured leaves was performed in a Philips SEM 515 equipped with an SEM cryo unit (SCU 020, Bal-Tec, Balzers, Liechtenstein) and a Tracor Northern energy dispersive X-ray analysis system interfaced with a Noran System Six Version 1.3 software package. Electron-induced X-rays were detected by a Si(Li) spectrometer detector (Tracor Northern 30 mm2Microtrace) with an ultra-thin beryllium window. The microscope was operated at an acceleration voltage of 18 kV with a beam current of 80 nA and the stage-tilt was adjusted to obtain a take-off angle of 448. Working distance was 12 mm. The temperature on the SEM cold stage was kept belowÿ120 8C. After preliminary measurements, analyses were carried out in the spot mode at 310 000 magnification (50 nm spot size). Selected spots at the edge and in the middle of the leaf (n=1ÿ5) and on mesophyll and epidermal cells as well as in the vein, the cuticle, the cell walls, and the intercellular space were analysed using a standard detection time of 100 live seconds. The depth resolution at 18 kV in frozen-hydrated samples was estimated to be 2.4 lm (Van Steveninck and Van Steveninck, 1991). This may be satisfactory for determining the elemental contents in vacuolar and cell walls in the spot mode. Spectra were processed using the standardless analysis program of the Noran System Six software package for automatic background substraction and calculations of net counts of elements of interest. The program uses a digital top hat filter to remove background and a multiple least squares fit to determine net peak counts. Any net intensity less then 50 counts per 100 s was designated ‘not detected’. Net counts of Cd were obtained at CdLa3.13 keV. Elemental maps were also produced to determine the distribution of S, Ca, K, P, C, and Cd at the edge of the leaf in the Ganges population, but did not give additional information. It was not possible to obtain a discriminative distribution of Cd within the leaf. Analyses of variance (ANOVA) were performed to test the effect of ecotype, position in leaf and type of cell on the Cd signal (ANOVA, SYSTAT 10.2, SYSTAT Software Inc.). The effect of a given factor was considered significant when the P-value was <0.05. In addition, Student’s t-tests were performed to test whether the Cd count obtained for Ganges for a given type of cell differed from that of the Prayon ecotype. The difference between means was significant when the P-value was <0.05.
Leaf tissue fractionation
To measure the involvement of different plant compartments (apo-plasm, cell walls, and protoplasts) in Cd storage, mesophyll proto-plasts were prepared from leaves of eight different 12-week-old T. caerulescens plants grown with or without Cd (0, 5, 10, and 50 lM
Cd) spiked with 0.1 kBq mlÿ1(=2.2310ÿ3lM) of109
Cd for better accuracy and because of the small volumes and low concentration involved.
The method used for extraction of protoplasts has been described in detail elsewhere (Cosio et al., 2004). The abaxial side of leaves, consisting of the lower epidermis and the cuticle, was peeled using tweezers, weighed, and placed in a counting vial. Peeled leaves were weighed and placed in a cell-wall-digesting medium composed of sorbitol medium (500 mM sorbitol, 10 mM MES, 10 lM CaCl2, pH 5.3), 0.75% (w/v) Cellulase Y-C (Kikkoman, Tokyo, Japan), and 0.075% (w/v) Pectolyase Y-23 (Kikkoman, Tokyo, Japan). The leaves were incubated for 2–4.5 h at 30 8C until digestion was judged satisfactory but had not reached the epidermal cell layer. The resulting suspension was centrifuged at 400 g for 7 min on top of a 100% Percoll medium cushion comprising 500 mM sorbitol, 10 lM CaCl2, 20 mM MES, pH 6 solubilized in Percoll (Sigma, St Louis, USA). The supernatant corresponding to the apoplasm/cell walls fraction was removed, filtered through 0.45 lm to remove all the debris, and 10–20 aliquots were placed in counting vials. The layer of mesophyll protoplasts was resuspended in the residual liquid. Percoll medium (100%) was added to the protoplasts mix to obtain a final Percoll medium of 50% (1:1 v/v) sorbitol medium with 100% Percoll medium), which was overlaid with a Percoll medium of 40% (3:2 v/v) sorbitol medium with 100% Percoll medium) and finally with a layer of sorbitol medium. The gradient was centrifuged at 400 g for 5 min. The protoplasts were collected from the upper interface. All centri-fugation steps were performed at 4 8C. The number of protoplasts per ml obtained in the concentrated preparation was counted with a haemocytometer. Depending on the plant sample, 10–20 aliquots of 200 ll concentrated protoplasts solution were placed in counting vials. For technical reasons (poor quality of the material) the upper epidermis was not recovered. Four ml of scintillation solution (Ultima Gold LSC-cocktail, Packard Bioscience, Meriden, USA) were added to the counting vials with all the aliquots (lower epidermis, apoplasm/ cell walls and protoplasts). The109Cd was quantified by scintillation counting (Packard, Tri-Carb, liquid scintillation analyser, Meriden, USA).
The percentage of viable protoplasts was determined by staining with fluorescein diacetate (Flucka, Buchs, Switzerland) as described by Cosio et al. (2004) and inspected using a fluorescence microscope. Protoplasts showing bright fluorescence were counted as viable. Protoplast viability ranged between 80% and 95%. In addition, the size of protoplasts was measured to assess homogeneity between the different samples. Protoplasts were similarly distributed for all the plants tested and the different treatments.
Preparation of the apoplast wash fluid and cell walls Two experiments were conducted to further differentiate Cd distribution between apoplasm and cell walls.
Extraction of apoplast wash fluid: As the apoplast wash fluid extraction resulted in very small volumes, the treatment giving the largest signal was used and plants were grown in the presence of the radiotracer only (=2.2310ÿ3lM109Cd) to avoid dilution of the activity. Leaves of eight 12-week-old T. caerulescens Ganges and Prayon were cut at the base with a razor blade and weighed. Leaves were then infiltrated with deionized water under vacuum three times for 4 min to ensure complete infiltration. Fully infiltrated leaves sank and were darker in colour. Leaves were blotted dry, weighed, and packed tip down into a 5 ml syringe that was centrifuged at 4 8C for 5 min at 200, 500, or 4500 g. The volume of the collected apoplastic solution was measured. The 109Cd was quantified as described previously by scintillation counting. Two grams of infiltrated leaves were then recovered from the syringe and hot-digested for 1 h at 95 8C in HNO365% suprapur for the determination of Cd concentration.
All samples were also tested for cytoplasmic contamination. Since K+ occurs in the cytosol at concentrations at least one order of magnitude higher than in the apoplastic solute (Lohaus et al., 2001), the concentration of K+in the apoplastic wash fluid and in the digest was analysed by flame-AAS (AAanalyst 300; Perkin Elmer, Wellesley, USA). Due to the large volumes necessary for flame-AAS analysis, samples were pooled before analysis. The values obtained for K+are therefore a mean (n=4) without SD.
The intercellular gas space was estimated by weighing the leaves before and after complete infiltration. It was calculated that 8%, 15%, and 30% of the total apoplast wash fluid was recovered at 200, 500, and 4500 g, respectively. In order to avoid underestimation, the Cd and K+contents measured in the extracted apoplast wash fluid were therefore extrapolated to 100% by multiplying each result with the ratio of total intercellular gas space volume to the volume extracted experimentally.
Cell wall extraction: The distribution of Cd between the cell walls and symplast of leaves and roots was further estimated after isolating the cell walls using the method developed by Hart et al. (1992). This treatment isolates the cell walls without destroying their morphology (Hart et al., 1992). Plants were grown for 8 weeks without Cd prior to growth for 4 weeks in 100 lM non-labelled Cd in order to reach high biomass production and concentrations above the detection limit of Cd by ICP-AES, and to avoid the problem of Cd phytotoxicity (see above). Shoots of four plants were harvested and quickly rinsed. Abaxial sides of leaves were peeled using tweezers to remove the cuticle. Peeled leaves and roots were weighed, soaked in 2:1 v/v methanol:chloroform for 3 d and then washed thoroughly in water. Tissues were processed as for the tolerance experiment and Cd was measured. The purity of the isolated cell walls was checked by analysis of the fatty acids composition of the extracts performed by the Lipid Analysis Unit of the Scottish Crop Research Institute in Dundee, Scotland. Briefly, lipids were converted to the methyl esters by reaction with 1% (v/v) HSO4 in methanol at 50 8C overnight (Christie, 2003). They were analysed by gas chromatography on a Hewlett Packard 5690 Series II gas chromatograph equipped with a CP-wax 52CB column (25 m30.25 mm 3 0.2 lm; Chrompack, UK), temperature was programmed from 170 8C (held at this for 3 min) then increased at 4 8C minÿ1to 220 8C (held for a further 3 min) with hydrogen (1 ml minÿ1) as the carrier gas. Fatty acid 21:0 was added as an internal standard. This confirmed that all membranes had been destroyed by the solvents and that cellular components were washed away.
The dry weight of the whole leaves was calculated from the fresh biomass weighed before the solvent extraction and based on previous observations (20% of fresh weight for shoots). The dry weight of the cell walls was determined after extraction.
Results
Biomass production and metal uptake
To assess the potential of the two T. caerulescens
popula-tions under this study’s growth condipopula-tions, biomass
pro-duced and Cd concentrations in shoots were measured
(Table 1). The Prayon ecotype grew best in the presence of
Cd with no significant reduction in shoot biomass until
50 lM Cd (43% decrease in biomass, Student t-test P <0.05).
Ganges was more affected by low and medium Cd
concen-trations (36% decrease in shoot biomass at 10 lM Cd,
P <0.05) but showed a similar decrease in shoot biomass
(51%, P <0.05) at 50 lM. Prayon also produced more leaves
than Ganges (see below). On the other hand, Prayon
exhibited necrotic spots on the leaves at 50 and 100 lM
Cd (Fig. 1a) but Ganges appeared healthy. None of the plants
showed chlorosis.
Cadmium concentrations were always higher in Ganges
than in Prayon (Table 1). For example, at 10 lM Cd in the
nutrient solution Ganges accumulated 4-fold more Cd in the
shoots (10916160 mg Cd kg
ÿ1) than did Prayon (264644
mg Cd kg
ÿ1). However, this factor diminished with
in-creasing concentrations of Cd and both plants exhibited
similar high Cd concentrations in their shoots at 50 lM Cd,
reaching 29606635 mg Cd kg
ÿ1in Ganges and 24576519
mg Cd kg
ÿ1in Prayon.
Visualization of heavy metals in plants
Autoradiographs were prepared to assess whether the
concentration of Cd in the nutrient solution or the duration
of exposure to Cd had any influence on Cd distribution in
the leaves. The darkness of the autoradiographs depended
on the
109Cd only. The concentration of
109Cd remained
constant (2.2310
ÿ3lM
109Cd) in all solutions, whereas
total Cd concentration increased from 2.2310
ÿ3lM to
100 lM. Thus the
109Cd activity present in the samples
decreased proportionally and the autoradiographs became
lighter with increasing total Cd concentration (Fig. 2).
Thus, the intensity of the darkening did not reflect the total
concentration of Cd found in the leaves and the intensity of
darkening could only be compared when plants were grown
with the same
109Cd/total Cd ratio.
In Ganges leaves, a change in the Cd distribution pattern
was observed with increasing Cd concentration (Fig. 1). At
low Cd concentration, younger leaves exhibited higher Cd
concentrations than older ones as shown by the darker print
on the autoradiographs, but the reverse was true at high Cd
concentrations. Cadmium was localized mainly at the edge
of the leaves, but also in points of higher concentrations
spread over the whole limb surface. The number of points
Table 1. Effect of Cd on biomass and accumulation: average dry weight (mg) and Cd concentration (mg kgÿ1) per plant of 12-week-old T. caerulescens Ganges and Prayon grown for 8 weeks in hydroponics with or without Cd (n=4, SD in parentheses)Cd in nutrient solution (lM) Dry weight (mg) Cd (mg kgÿ1) Ganges 0 205 (37) 3 (2) 5 138 (61) 751 (299) 10 131 (39) 1091 (160) 50 101 (37) 2960 (635) 100 22 (9) 8163 (1058) Prayon 0 235 (73) 4 (4) 5 242 (5) 170 (11) 10 287 (52) 264 (44) 50 135 (58) 2457 (519) 100 43 (31) 5670 (558)
of higher concentrations increased with increasing Cd
concentration. The autoradiographs of the adaxial and
abaxial sides of the leaves were always different (data not
shown).
A similar overall Cd distribution pattern was observed in
Prayon (Fig. 2). Points of higher concentration and
accu-mulation at the margin of the leaves were visible.
Neverthe-less, younger leaves exhibited lower Cd concentration than
older ones, as shown by the lighter print on the
autoradio-graphs observed for all the treatments. In addition, the
concentration in older leaves seemed to be more variable,
some of the leaves appearing dark and others being very
slightly coloured. In this ecotype, the localization of the
spots observed on the autoradiographs at high Cd
concen-trations (50 and 100 lM) could be directly related to the
necrotic spots also observed at these concentrations (Fig. 1).
As for Ganges, the autoradiographs of the adaxial and
abaxial sides of the leaves were different (Fig. 1).
In both ecotypes the duration of exposure to the metal
had no influence on the Cd distribution pattern. After 3, 15,
or 30 d the distribution of Cd remained similar in the leaves,
although Cd concentration increased in leaves as indicated
by the increasing darkness of the autoradiographs (Fig. 3).
Cadmium concentration in individual leaves of T. caerulescens
To confirm the autoradiography results, individual leaves of
Prayon and Ganges grown in 50 lM Cd were weighed and
the Cd concentration was measured (data not shown).
Darker leaves on the autoradiographs of a plant
correspon-ded to leaves with higher Cd concentrations. In Prayon, Cd
concentrations found in leaves were proportional to leaf dry
weight with a correlation coefficient of r=0.648 (1 plant,
n=80; significant P <0.001). Cadmium concentration was
higher in larger leaves. By contrast, the same comparison
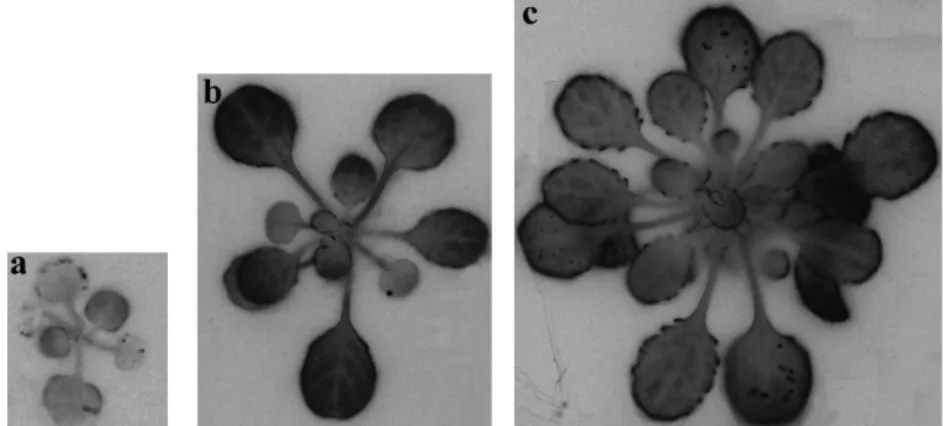
Fig. 2. Autoradiographs of T. caerulescens leaves of the Ganges (top) and Prayon (bottom) ecotypes grown for 30 d in hydroponics with 0.1 kBq mlÿ1 (=2.2310ÿ3lM)109Cd and (a) 0 lM Cd, (b) 5 lM Cd, (c) 10 lM Cd, and d) 50 lM Cd.
Fig. 1. Leaf of T. caerulescens Prayon grown for 15 d in hydroponics with 100 lM Cd spiked with 0.1 kBq ml1(=2.2310ÿ3lM)109Cd. (a) Photograph of the adaxial side, (b) autoradiograph of the adaxial side, and (c) autoradiograph of the abaxial side.
for Ganges resulted in r=0.118 (3 plants, n=37; not
sig-nificant). When the three Ganges plants tested were studied
independently the results were r=0.694 (n=8; significant
P <0.05), 0.254 (n=15; not significant) and
ÿ0.750 (n=14;
significant P <0.001). Surprisingly, the average
concen-trations in leaves of the three plants were similar with
11426180 mg Cd kg
ÿ1for the first, 11536171 mg Cd
kg
ÿ1for the second, and 1257630 mg Cd kg
ÿ1for the
third. In Ganges, there was no obvious relationship between
Cd concentration and the leaf weight.
Localization of Cd in leaves by SEM-EDXMA
The localization of Cd at the edges of old leaves was
stud-ied further with SEM-EDXMA. Examples of scanning
electron micrographs and the spots analysed are presented
in Fig. 4. The pattern of Cd distribution was similar for both
Ganges and Prayon (Fig. 5) and no difference between the
two ecotypes was observed in the Cd counts when all cells
were taken into account (ANOVA F=3.32, not significant).
However, the location of the cells (edge versus middle of
the leaf) significantly affected the Cd signal (ANOVA,
F=15.49, P <0.001). At the edge of the leaves, the Cd
counts were significantly different between the ecotypes
(ANOVA F=20.17, P <0.001), but also depended on the
location of the analysis (epidermal or mesophyllic cells,
intercellular space; ANOVA F=16.11, P <0.001).
Cad-mium was found mainly in the large epidermal cells at the
edge of the leaves and in a larger amount in Ganges than in
Prayon. In fact, the only significant difference between the
two ecotypes was the size of the signals measured in the
epidermal cells (Student t-test P <0.05 for both the large
and the small epidermal cells), probably resulting from the
1.5-fold Cd concentration difference found between leaves
of both populations when grown at 100 lM Cd (Table 1).
However, Cd was also detected in the mesophyll cells at the
edge of the leaf and in epidermal and mesophyll cells in the
middle of the leaves (Fig. 5), but in significantly lower
amounts than at the edges and no significant difference was
found between the two ecotypes. Cadmium was virtually
absent from the lateral veins. No central vein was analysed.
Subcellular distribution of Cd in T. caerulescensThe overall Cd storage of different leaf compartments
was quantified using a protoplast extraction procedure.
Fig. 3. Autoradiographs of leaves of T. caerulescens Ganges grown in hydroponics with 5 lM Cd spiked with 0.1 kBq mlÿ1(=2.2310ÿ3lM)109Cd at (a) 3 d, (b) 15 d, and (c) 30 d.
Fig. 4. Scanning electron micrographs of (a) the leaf edge of Ganges and (b) epidermal cells of the leaf edge of Prayon. The crosses represent the single spot analyses performed on the freeze-fractured samples.
Cadmium distribution between apoplasm/cell walls, lower
epidermis, and mesophyll protoplasts was similar for the
different concentrations tested (5, 10, and 50 lM Cd) and
for both ecotypes (Fig. 6), although the Cd content of
the different subcellular fractions increased with increasing
Cd treatments. The ranking with respect to Cd
concentra-tion was as follows: apoplasm/cell walls>lower
epider-mis>mesophyll protoplasts. In Ganges 5.4-fold more Cd
was measured in the apoplasm/cell walls than in the lower
epidermis (4-fold in Prayon). The concentration of Cd
measured in the mesophyll protoplasts was negligible.
To characterize the distribution of Cd between the
apoplasm and the cell walls further, the apoplast wash fluid
was extracted by centrifugation and separated from the cell
walls (Table 2). In Ganges, K concentration was 1.3-fold
higher at 500 g and 1.5-fold higher at 4500 g than at 200 g.
In Prayon, cytoplasmic contamination was greater with
a 15-fold increase in K concentration at 500 g and 81-fold at
4500 g compared with 200 g. However, even at 4500 g, Cd
amounts measured in the apoplasm fluid were 10
8-fold for
Ganges and 10
9-fold for Prayon smaller than the Cd amount
in the whole leaf. It was concluded that cytoplasmic
con-tamination was negligible compared with K concentrations
measured in the whole leaf and that the Cd concentration
found in the apoplasm wash fluid was very limited.
The cell wall extraction allowed further investigation and
comparison of the Cd binding capacity of cell walls of both
ecotypes (Table 3). Concentrations measured in cell walls
after extraction with methanol:chloroform were similar to
concentrations in whole shoots. Cell wall biomass accounted
for 26% of shoot biomass in Ganges and 35% in Prayon.
Overall for both ecotypes, between 33% and 35% of the total
Cd content of shoots could be allocated to the cell walls.
Discussion
Growth and metal uptake
The Prayon ecotype produced the larger biomass and
number of leaves in these experimental conditions.
Cad-mium concentrations found in the leaves of Prayon were
always smaller than in the leaves of Ganges, but they were
above the 100 mg kg
ÿ1Cd threshold that defines Cd
hyper-accumulation in the natural environment (Brown et al.,
1994). Although Ganges is a Cd hyperaccumulating
eco-type, Prayon does not usually hyperaccumulate Cd in the
field (Lombi et al., 2000; Zhao et al., 2003). It is, however,
known that plants in solution culture accumulate more Cd
than those in soil (Grant et al., 1998). Roosens et al. (2003)
similarly studied several populations of T. caerulescens in
solution culture including one Prayon and two Ganges
populations. They reported Cd concentrations in shoots of
Prayon of the same order as those reported here (over 100
mg kg
ÿ1even at low Cd concentration in the growth
medium). However, they also reported slightly higher Cd
concentrations in shoots of Ganges ecotypes than the ones
determined in this work. Different populations originate
from the Ganges area and this may account for this
dis-crepancy. Indeed, seeds were used from ‘Les Avinie`res’
whereas those used by Roosens et al. (2003) originated
from ‘St Fe´lix-de-Pallie`res’ and ‘Les Malines’.
Overall, the differences in accumulation between both
ecotypes tested in this work were smaller than those observed
in the field. However, Prayon tolerated large amounts of Cd
in its leaves. It was therefore interesting to compare the Cd
Fig. 5. Cadmium net counts in different leaf compartments of Gangesand Prayon grown with 100 lM Cd determined by SEM-EDXMA (Ep., epidermis; UEp., upper epidermis). Analyses of variance (ANOVA) were performed to test the position in leaf (significant), effect of ecotype and type of cell (both significant when the edge of leaf was considered) on the Cd signal. The difference between Prayon and Ganges was significant when large and small epidermal cells from the edge of the leaves were compared (Student t-test, P <0.05).
0 100 200 300 400 500 Cd in nutrient solution (µM) 0 10 20 30 40 50 Cd (nmoles g -1 fresh weight)
Fig. 6. Cadmium concentrations measured in mesophyll protoplasts (circles), apoplasm and cell walls (squares) and lower epidermis (triangles) in Ganges (closed symbols) and Prayon (open symbols) leaves. Error bars=means (n=4) 6SD. Error bars do not extend outside some data symbols.
distribution in its leaves with that in Ganges leaves obtained
under the same growth conditions.
Distribution of Cd in leaves
To learn more about the general Cd allocation in leaves of
T. caerulescens, macro-autoradiographs were performed on
plants grown in solution culture and treated with increasing
Cd concentrations. It was observed that the duration of
exposure to the metal had no influence on the Cd
distribu-tion pattern within the plant. After 3, 15, or 30 d the
allocation of Cd in the leaves remained similar, as also
reported by Weigel and Ja¨ger (1980) for Cd in bean plants.
By contrast, Cd localization in leaves of Ganges changed
according to the Cd concentration in the nutrient solution.
At very low Cd concentration, the metal was preferentially
located in the younger leaves, whereas at higher Cd
concentration Cd was located mainly in the older leaves.
Perronnet et al. (2003) measured 600 mg Cd kg
ÿ1in shoots
of the Vivier population of T. caerulescens grown on
contaminated soil, close to the concentrations that this
study measured in shoots of Ganges grown at 5 lM Cd, and
they similarly reported that younger leaves exhibited higher
Cd concentrations. No such difference was found in Prayon
between low and high Cd treatments and the highest Cd
concentrations were always found in the larger, more
mature leaves.
The distribution of Cd was highly uneven in both
ecotypes. Although having spots spread over the leaf
sur-face and along the edges, the autoradiographs of adaxial and
abaxial sides of the same leaf were not similar, indicating
highly localized Cd accumulation. In Prayon, the spots of
high Cd accumulation observed on the autoradiographs were
directly correlated with the necrotic spots observed on the
leaves. It is believed that this indicates that the necrosis
resulted directly from Cd accumulation, which decreased
cellular viability and finally resulted in cell death. Salt et al.
(1995a) analysed Cd in leaves of Indian mustard by
auto-radiography. They found that Cd toxicity induced chlorosis
in young leaves and that Cd preferentially accumulated
within these young leaves, explaining the localization of the
chlorosis. However, contrary to these results with T.
caer-ulescens, they found an even distribution on the leaf surface
that they correlated with trichomes localization.
Sequestra-tion of metals in trichomes has been reported in a number of
other annual hyperaccumulators and non-hyperaccumulators
(Ku¨pper et al., 1999, 2000; Zhao et al., 2000; Choi et al.,
2001; Ager et al., 2002). However, T. caerulescens does not
possess trichomes and mechanisms must, therefore, be based
on a different compartment or cell type.
Localization of Cd at the subcellular level
To learn more about the cellular and subcellular Cd
allocation in leaves of T. caerulescens several different
approaches were tested to examine the importance of
different leaf parts in Cd storage. Indeed, as mentioned
by Frey et al. (2000b) artefacts and/or Cd losses may occur
during the preparation of cell fractions separated by
bio-chemical and physical methods (epidermal strips,
proto-plast extraction, apoproto-plast wash fluid, and cell wall
extraction). Cryo-SEM-EDXMA is more reliable in this
respect, but lack of sensitivity and interference with other
cations (e.g. K) impose the use of high concentrations of Cd
that do not always represent a realistic environment.
Consequently, the test concentrations were selected
accord-ing to the sensitivity of the method employed. The different
approaches were combined in this study in order to (i)
validate the results obtained by each specific method and
(ii) make the link between observations and measurements
performed at different scales.
Overall, the results of the different experiments were
consistent with one another. Furthermore, it was
demon-strated with the protoplast extraction procedure that Cd
distribution between compartments remained similar for the
different concentrations tested, although the Cd content of
the different subcellular fractions increased with increasing
Cd treatments. The SEM-EDXMA analysis confirmed that
an important site of Cd allocation was at the edges of the
leaves in both Ganges and Prayon ecotypes.
Mizuno et al. (2003) pointed out the importance of Ni
allocation at the leaf edges of T. japonicum. They suggested
Table 2. Concentration of Cd and K measured in the apoplasmwash fluid and in the leaf extract in mg per kg of infiltrated leaves of 12-week-old T. caerulescens grown in hydroponics with 0.1 kBq mlÿ1(=2.2310ÿ3lM) of109Cd (n=4, SD in parentheses)
Centrifugation (g)
Apoplasm wash (mg kgÿ1) Leaf extract (mg kgÿ1)
Cd Ka Cd Ka Ganges 200 4.2310ÿ3(2.9310ÿ5) 135 4432 (968) 4883 500 7.0310ÿ3(1.7310ÿ4) 179 4011 (247) 5460 4500 24310ÿ3(3.1310ÿ4) 205 3518 (821) 4512 Prayon 200 0.4310ÿ4(7.1310ÿ6) 3 1035 (156) 5330 500 6.0310ÿ4(1.2310ÿ5) 39 1370 (68) 5910 4500 17.0310ÿ4(2.9310ÿ5) 204 9743 (4109) 6045
aSamples were pooled before analysis. The values obtained are therefore a mean without SD.
Table 3. Concentration of Cd of whole shoots and cell walls of 12-week-old T. caerulescens grown for 4 weeks in hydroponics with 100lM of Cd (n=4, SD in parentheses)
Cd (mg kgÿ1)
Shoots Cell walls
Ganges 1122 (156) 1436 (278)
that Ni was transported along with the transpiration stream
and that Ni in excess was excreted together with guttation.
It was earlier reported that the guttation fluid commonly
functions to exclude various substances including K, Mg,
and Ca in sunflower, and recombinant protein in tobacco
(Komarnytsky et al., 2000; Tanner and Beevers, 2001).
Very low Cd concentrations were obtained from the
apo-plastic wash fluid. It is therefore questionable whether this
would be an acceptable hypothesis for Cd in T.
caerules-cens. However, this experiment did not take into account
the process kinetics and must be regarded as a snap shot
performed at one particular time. A high rate of Cd loading/
unloading as well as a possible time-dependent mechanism
could not be assessed and thus cannot be excluded.
Cellular Cd is known to accumulate preferentially within
vacuoles in the leaves of a number of different plant species
including tobacco and Silene vulgaris (Vo¨geli-Lange and
Wagner, 1990; Chardonnens et al., 1998, 1999), and this
has often been proposed as a possible mechanism of Cd
tolerance in plants. Chardonnens et al. (1998, 1999) also
showed that, in S. vulgaris, Cd accumulated mainly in the
lower leaf epidermis. In this study Cd was mostly found in
the epidermal cells as observed previously for Zn in
T. caerulescens (Va´zquez et al., 1992, 1994; Ku¨pper et al.,
1999; Frey et al., 2000a), but no consistent differences were
observed between the upper and lower epidermis. The
variation in relative Cd concentration in the epidermal cells
appeared to be mainly associated with the cell size as shown
for Zn (Ku¨pper et al., 1999; Frey et al., 2000a). This
relationship suggests that vacuolation may be an important
driving force for Cd sequestration in epidermal cells of
T. caerulescens leaves.
However, Cd was found both inside the vacuoles and in
the cell walls. This latter result was obtained by both the
SEM-EDXMA observations and the compartmental studies
and in both ecotypes, indicating an additional storage
mechanism. Indeed, it was shown that up to 35% of Cd
could be bound to cell walls (epidermal or mesophyll) in
contrast to Salt et al. (1999) who reported 12% Zn in the
cell walls of T. caerulescens. Accumulation of Cd in the
cell walls may therefore be an important tolerance
mech-anism in T. caerulescens as in other orgmech-anisms or plants
(Galli et al., 1994; Turnau et al., 1994; Blaudez et al.,
2000). However, the role of cell walls in Cd binding and
storage in plants remains controversial. For example,
Vo¨geli-Lange and Wagner (1990) and Va´zquez et al.
(1992) failed to show substantial Cd binding in cell walls
of tobacco and T. caerulescens roots, but the importance of
Cd binding to cell walls and the limitation of its subsequent
translocation to shoots has been demonstrated for root cells
of non-hyperaccumulating plants (Wagner, 1993; Grant
et al., 1998) and was recently described for T. caerulescens
hairy roots (Boominathan and Doran, 2003). In Zea mays,
cell walls were assumed to play the most important role in
Cd accumulation (Khan et al., 1984), but Carrier et al.
(2003) reported that Cd was distributed both in vacuoles
and in cell walls of B. napus leaves. Cell walls can easily
interact with metal ions because of the presence of many
enzymes and negative charge sites on their surfaces (Wang
and Evangelou, 1995), thereby potentially lowering toxic
Cd ions in the cytoplasm. The low Cd concentrations
measured in the apoplasm fluid could indeed be due to the
role of the cell walls in continuously reducing metal-ion
activity in the intercellular spaces through tight metal
binding (Bringezu et al., 1999). However, in the literature,
the emphasis is currently given to vacuolar metal
compart-mentation and sequestration by phytochelatins. So far, less
attention has been devoted to other tolerance mechanisms,
although different tolerance mechanisms could operate in
combination as proposed by Baker (1987).
To date, two mechanisms have been proposed to explain
partly the high uptake of metals by hyperaccumulators: (i)
enhanced absorption of metal into the roots (Lasat et al.,
1996) coupled with high rates of translocation of metal from
roots to shoots (Shen et al., 1997; Lasat et al., 1998), and (ii)
foraging for metal by the roots, involving preferential
allocation of root biomass into regions of metal enrichment
(Schwartz et al., 1999; Whiting et al., 2000) and a large root
system compared with shoot dry matter that might further
favour soil prospecting as well as heavy metal uptake (Keller
et al., 2003). Kochian et al. (2002) hypothesized that this
increased transport could include a stimulated metal influx
across the leaf cell plasma membrane and an enhanced
storage in the leaf vacuole. According to these results, this
may be possible because the only differences found between
the two ecotypes in this study were in the Cd concentrations
found in the storage sinks, vacuoles, and cell walls.
Acknowledgements
This work was financed by COST Action 837, OFES no. C99.0062. The authors are grateful to Professor P Meerts for providing T. caerulescens Prayon seeds and to P Monnin and M Leresche for technical assistance. We are also grateful to P Christie of the Queens’s University of Belfast for correcting the English text.
References
Ager FJ, Ynsa MD, Dominguez-Solis JR, Cotor C, Respaldiza MA, Romero LC.2002. Cadmium localization and quantification in the plant Arabidopsis thaliana using micro-PIXE. Nuclear Instruments and Methods in Physics Research B 189, 494–498. Assuncxa˜o AGL, Schat H, Aarts MGM. 2003. Thalspi
caerules-cens, an attractive model species to study heavy metal hyper-accumulation in plants. New Phytologist 159, 351–360.
Baker AJM.1987. Metal tolerance. New Phytologist 106, 93–111. Blaudez D, Botton B, Chalot M. 2000. Cadmium uptake and subcellular compartmentation in the ectomycorrhizal fungus Pax-illus involutus. Microbiology 146, 1109–1117.
Boominathan R, Doran PM. 2003. Organic acid complexation, heavy metal distribution and the effect of ATPase inhibition in
hairy roots of hyperaccumulator plant species. Journal of Bio-technology 101, 131–146.
Bringezu K, Lichtenberger O, Leopold I, Neumann D. 1999. Heavy metal tolerance of Silene vulgaris. Journal of Plant Physiology. 154, 536–546.
Brooks RR, Chambers MF, Nicks LJ, Robinson BH. 1998. Phytomining. Trends in Plant Science 3, 359–362.
Brown S, Chaney R, Angle J, Baker A.1994. Phytoremediation potential of Thlaspi caerulescens and bladder campion for zinc-and cadmium-contaminated soil. Journal of Environmental Qual-ity 23, 1151–1157.
Brown S, Chaney R, Angle J, Baker A.1995a. Zinc and cadmium uptake by hyperaccumulator Thlaspi caerulescens grown in nutrient solution. Soil Science Society of America Journal 59, 125–133.
Brown S L, Chaney R L, Angle J S, Baker AJ M.1995b. Zinc and cadmium uptake by hyperaccumulator Thlaspi caerulescens and metal-tolerant Silene vulgaris grown on sludge-amended soils. Environmental Science and Technology 29, 1581–1585.
Carrier P, Baryla A, Havaux M.2003. Cadmium distribution and microlocalization in oilseed rape (Brassica napus) after long-term growth on cadmium-contaminated soil. Planta 216, 939–950. Chaney R, Brown S, Angle J.1998. Soil–root interface: ecosystem
health and human food-chain protection. In: Huang P, ed .Soil chemistry and ecosystem health. Madison, Winsconsin: Soil Science Society of America, 279–311.
Chardonnens AN, ten Bookum WM, Kuijper LDJ, Verkleij JAC, Ernst WHO.1998. Distribution of cadmium in leaves of cadmium tolerant and sensitive ecotypes of Silene vulgaris. Physiologia Plantarum 104, 75–80.
Chardonnens AN, ten Bookum WM, Vellinga S, Schat H, Verkleij JAC, Ernst WHO. 1999. Allocation patterns of zinc and cadmium in heavy metal tolerant and sensitive Silene vulgaris. Journal of Plant Physiology 155, 778–787.
Choi Y-E, Harada E, Wada M, Tsuboi H, Morita Y, Kusano T, Sano H. 2001. Detoxification of cadmium in tobacco plants: formation and active excretion of crystals containing cadmium and calcium through trichomes. Planta 213, 45–50.
Christie WW. 2003. Lipid analysis, 3rd edn. Bridgwater: Oily Press.
Cosio C, Martinoia E, Keller C. 2004. Hyperaccumulation of cadmium and zinc in Thlaspi caerulescens and Arabidopsis halleri at the leaf cellular level. Plant Physiology 134, 716–725. Frey B, Keller C, Zierold K, Schulin R.2000a. Distribution of Zn
in functionally different leaf epidermal cells of the hyperaccumu-lator Thlaspi caerulescens. Plant, Cell and Environment 23, 675–687.
Frey B, Zierold K, Brunner I.2000b. Extracellular complexation of Cd in the Hartig net and cytosolic Zn sequestration in the fungal mantle of Picea abies–Hebeloma crustuliniforme ectomyccorhi-zas. Plant, Cell and Environment 23, 1257–1265.
Galli U, Schu¨epp H, Brunold C.1994. Heavy metal binding by mycorrhizal fungi. Physiologia Plantarum 92, 364–368. Grant CA, Buckley WT, Bailey LD, Selles F. 1998. Cadmium
accumulation in crops. Canadian Journal of Plant Science 78, 1–17.
Hammer D, Keller C.2003. Phytoextraction of Cd and Zn with Thlaspi caerulescens in field trials. Soil Use and Management 19, 144–149.
Hart JJ, Di Tomaso JM, Linscott DL, Kochian LV. 1992. Characterization of the transport and cellular compartmentation of paraquat in roots of intact maize seedlings. Pesticide Bio-chemistry and Physiology 43, 212–222.
Kabata-Pendias A, Pendias H.2001. Trace elements in soils and plant. CRC Press.
Keller K, Hammer D, Kayser A, Richner W, Brodbeck M, Sennhauser M. 2003. Root development and heavy metal phytoextraction efficiency: comparison of different plant species in the field. Plant and Soil 249, 67–81.
Khan DH, Duckett JG, Frankland B, Kirkham JB.1984. An X-ray microanalytical study of the distribution of cadmium in roots of Zea mays L. Journal of Plant Physiology 115, 19–28.
Kochian L, Pence NS, Letham DLD, Pineros M, Magalhaes JV, Hoekenga O, Garvin D.2002. Mechanisms of metal resistance in plants: aluminium and heavy metals. Plant and Soil 247, 109–119. Komarnytsky S, Borisjuk NV, Borisjuk LG, Alam MZ, Raskin I. 2000. Production of recombinant proteins in guttation fluid. Plant Physiology 124, 927–933.
Ku¨ pper H, Zhao JF, McGrath SP. 1999. Cellular compartmenta-tion of zinc in leaves of the hyperaccumulator Thlaspi caerules-cens. Plant Physiology 119, 305–311.
Ku¨ pper H, Lombi E, Zhao FJ, McGrath SP. 2000. Cellular com-partmentation of cadmium and zinc in relation to other elements in the hyperaccumulator Arabidopsis halleri. Planta 212, 75–84. Lasat MM, Baker AJM, Kochian LV.1996. Physiological
charac-terization of root Zn2+absorption and translocation to shoots in Zn hyperaccumulator and non-accumulator species of Thlaspi. Plant Physiology 112, 1715–1722.
Lasat MM, Baker AJM, Kochian LV.1998. Altered Zn compart-mentation in the root symplasm and stimulated Zn absorption into the leaf as mechanisms involved in Zn hyperaccumulation in Thlaspi caerulescens. Plant Physiology 118, 875–883.
Lazof DB, Goldsmith JG, Rufty TW, Linton RW.1996. The early entry of Al into cells of intact soybean roots. Plant Physiology 112, 1289–1300.
Lohaus G, Pennewiss K, Sattelmacher B, Hussman M, Muehling K.2001. Is the infiltration-centrifugation technique appropriate for the isolation of apoplastic fluid? A critical evaluation with different plant species. Physiologia Plantarum 111, 457–465.
Lombi E, Zhao FJ, Dunham SJ, McGrath SP. 2000. Cadmium accumulation in populations of Thlaspi caerulescens and Thlaspi goesingense. New Phytologist 145, 11–20.
Lombi E, Zhao FJ, McGrath SP, Young SD, Sacchi GA. 2001. Physiological evidence for a high-affinity cadmium transporter highly expressed in a Thlaspi caerulescens ecotype. New Phyto-logist 149, 53–60.
Lozano-Rodriguez E, Hernandez LE, Bonay P, Carpena-Ruiz RO.1997. Distribution of cadmium in shoot and root tissues of maize and pea plants: physiological disturbances. Journal of Experimental Botany 48, 123–128.
Mizuno N, Nosaka S, Mizuno T, Horie K, Obata H. 2003. Distribution of Ni and Zn in the leaves of Thlaspi japonicum growing on ultramafic soil. Soil Science and Plant Nutrition 49, 93–97.
Nassiri Y, Mansot JL, We´ry J, Ginsburger-Vogel T, Amiard JC. 1997. Ultrastructural and electron energy loss spectroscopy studies of sequestration mechanisms of Cd and Cu in the marine diatom Skeletonema costatum. Archives of Environmental Contamination and Toxicology 33, 147–155.
Perronnet K, Schwartz C, Morel JL. 2003. Distribution of cadmium and zinc in the hyperaccumulator Thlaspi caerulescens grown on multicontaminated soil. Plant and Soil 249, 19–25. Robinson BH, Leblanc M, Petit D, Brooks RR, Kirkman JH,
Gregg PEH. 1998. The potential of Thlaspi caerulescens for phytoremediation of contaminated soils. Plant and Soil 203, 47–56. Roosens N, Verbruggen N, Meerts P, Xime´nez-Embun P, Smith JAC. 2003. Natural variation in cadmium tolerance and its relationship to metal hyperaccumulation for seven populations of Thlaspi caerulescens from western Europe. Plant, Cell and Environment 26, 1657–1672.
Salt DE, Blaylock M, Kumar N, Dushenkov V, Ensley BD, Chet I, Raskin I. 1995a. Phytoremediation: a novel strategy for the removal of toxic metals from the environment using plants. Bio/ Technology 13, 468–474.
Salt DE, Prince CP, Pickering IJ, Raskin I.1995b. Mechanisms of cadmium mobility and accumulation in Indian mustard. Plant Physiology 109, 1427–1433.
Salt DE, Prince RC, Baker AJM, Raskin I, Pickering IJ.1999. Zinc ligands in the metal hyperaccumulator Thlaspi caerulescens as determined using X-ray absorption spectroscopy. Environmen-tal Science and Technology 33, 713–717.
Sanita` di Toppi L, Gabbrielli R.1999. Response to cadmium in higher plants. Environmental and Experimental Botany 41, 105–130. Schwartz C, Morel JL, Saumier S, Whiting SN, Baker JM.1999. Root development of the zinc-hyperaccumulator plant Thlaspi caerulescens as affected by metal origin, content and localization in soil. Plant and Soil 208, 103–115.
Shen ZG, Zhao FJ, McGrath SP.1997. Uptake and transport of zinc in the hyperaccumulator Thlaspi caerulescens and the non-hyperaccumulator Thlaspi ochroleucum. Plant, Cell and Environ-ment 20, 898–906.
Tanner W, Beevers H.2001. Transpiration, a prerequisite for long-distance transport of minerals in plants? Proceedings of the National Academy of Sciences, USA 98, 9443–9447.
Turnau K, Kottke I, Dexheimer J, Botton B. 1994. Element distribution in mycelium of Pisolithus arrhizus treated with cadmium dust. Annals of Botany 74, 137–142.
Van Steveninck RFM, Van Steveninck ME.1991. Microanalysis. In: Hall JL, Hawes C, eds. Electron microscopy of plant cells. London: Academic Press, 415–455.
Va´zquez MD, Barcelo´ J, Poschenrieder C, Ma´dico J, Hatton P, Baker AJM, Cope GH.1992. Localization of zinc and cadmium
in Thlaspi caerulescens (Brassicaceae), a metallophyte that can hyperaccumulate both metals. Journal of Plant Physiology 140, 350–355.
Va´zquez MD, Poschenrieder C, Barcelo´ J, Baker AJM, Hatton P, Cope GH.1994. Compartmentation of zinc in roots and leaves of the zinc hyperaccumulators Thlaspi caerulescens J. & C. Presl. Botanica Acta 107, 243–250.
Vo¨geli-Lange R, Wagner GJ. 1990. Subcellular localization of cadmium and cadmium-binding peptides in tobacco leaves. Impli-cation of a transport function for cadmium-binding peptides. Plant Physiology 92, 1086–1093.
Wagner GJ.1993. Accumulation of cadmium in crop plants and its consequences to human health. Advances in Agronomy 51, 173–212.
Wang J, Evangelou VP.1995. Metal tolerance aspects of plant cell wall and vacuole. In: Pessarakli M, ed. Handbook of plant and crop physiology. New York: Marcel Dekker Inc., 695–717. Weigel HJ, Ja¨ger HJ.1980. Subcellular distribution and chemical
form of cadmium in bean plants. Plant Physiology 65, 480–482. Whiting SN, Leake JR, McGrath SP, Baker AJM.2000. Positive
responses to Zn and Cd by roots of the Zn and Cd hyperaccumu-lator Thlaspi caerulescens. New Phytologist 145, 199–210. Zhao FJ, Lombi E, Breedon T, McGrath SP.2000. Zinc
hyper-accumulation and cellular distribution in Arabidopsis halleri. Plant, Cell and Environment 23, 507–514.
Zhao FJ, Hamon RE, Lombi E, McLaughlin MJ, McGrath SP. 2002. Characteristics of cadmium uptake in two contrasting ecotypes of the hyperaccumulator Thlaspi caerulescens. Journal of Experimental Botany 53, 535–543.
Zhao FJ, Lombi E, McGrath SP.2003. Assessing the potential for zinc and cadmium phytoremediation with the hyperaccumulator Thlaspi caerulescens. Plant and Soil 249, 37–43.