Remote sensing, geographical information system and
spatial analysis for schistosomiasis epidemiology
and ecology in Africa
C. SIMOONGAa,b*, J. UTZINGERc, S. BROOKERd,e, P. VOUNATSOUc, C. C. APPLETONf, A. S. STENSGAARDg,h, A. OLSENgand T. K. KRISTENSENg
aMinistry of Health, P.O. Box 30205, 10101 Lusaka, Zambia
bUniversity of Zambia, School of Medicine, Department of Community Medicine, P.O. Box 50110, Lusaka, Zambia
cDepartment of Public Health and Epidemiology, Swiss Tropical Institute, P.O. Box, CH-4002 Basel, Switzerland
dDepartment of Infectious and Tropical Diseases, London School of Hygiene and Tropical Medicine, Keppel Street, London WC1E 7HT, United Kingdom
eMalaria Public Health and Epidemiology Group, Centre for Geographic Medicine, KEMRI/Wellcome Trust Research
Laboratories, Nairobi, Kenya
fSchool of Biological and Conservation Sciences, University of KwaZulu-Natal, Howard College Campus, Durban 4041,
South Africa
gMandahl-Barth Research Centre, DBL–Institute for Veterinary Pathobiology, Faculty of Life Science, University of
Copenhagen, Thorvaldsensvej 57, DK-1871 Frederiksberg, Denmark
hCenter for Macroecology and Evolution, Department of Biology, University of Copenhagen, Universitetsparken 15, DK-2100
Copenhagen O, Denmark
(Received 30 January 2009; revised 27 March 2009; accepted 4 April 2009; first published online 23 July 2009)
S U M M A R Y
Beginning in 1970, the potential of remote sensing (RS) techniques, coupled with geographical information systems (GIS), to improve our understanding of the epidemiology and control of schistosomiasis in Africa, has steadily grown. In our current review, working definitions of RS, GIS and spatial analysis are given, and applications made to date with RS and GIS for the epidemiology and ecology of schistosomiasis in Africa are summarised. Progress has been made in mapping the prevalence of infection in humans and the distribution of intermediate host snails. More recently, Bayesian geostatistical modelling approaches have been utilized for predicting the prevalence and intensity of infection at different scales. However, a number of challenges remain ; hence new research is needed to overcome these limitations. First, greater spatial and temporal resolution seems important to improve risk mapping and understanding of transmission dynamics at the local scale. Second, more realistic risk profiling can be achieved by taking into account information on people’s socio-economic status ; furthermore, future efforts should incorporate data on domestic access to clean water and adequate sanitation, as well as behavioural and educational issues. Third, high-quality data on intermediate host snail distribution should facilitate validation of infection risk maps and modelling transmission dynamics. Finally, more emphasis should be placed on risk mapping and prediction of multiple species parasitic infections in an effort to integrate disease risk mapping and to enhance the cost-effectiveness of their control.
Key words : schistosomiasis, remote sensing, geographical information system, spatial analysis, epidemiology, ecology, control, transmission, Africa.
I N T R O D U C T I O N
Schistosomiasis continues to exert pressure against social and economic development, particularly in sub-Saharan Africa where more than 80 % of the total number of infected individuals and the global burden of this often neglected tropical disease are concen-trated (WHO, 2002 ; Steinmann et al. 2006). Despite considerable progress made in morbidity control of schistosomiasis in several African countries –
facilitated through large-scale administration of praziquantel to school-aged children and other high-risk groups (Kabatereine et al. 2007 ; Koukounari et al. 2007) – the disease has expanded elsewhere and the transmission has intensified in areas where water resources have been developed, such as large dams and irrigation systems (Fenwick, 2006 ; Steinmann et al. 2006).
Important to the transmission biology of schisto-somiasis in Africa are several species of aquatic snails that act as intermediate hosts for the development of the parasite to an infective free-swimming larval stage, i.e. cercariae. Humans acquire an infection through cercarial skin penetration during water contact. There are several principal intermediate
* Corresponding author. Christopher Simoonga, Ministry of Health, P.O. Box 30205, 10101 Lusaka, Zambia. Tel. : +260 211 253-053; Fax: +260 211 253-053; E-mail: csimoonga@moh.gov.zm
host snails belonging to two genera ; Bulinus trans-mitting Schistosoma haematobium and Biomphalaria transmitting S. mansoni (Brown, 1994). It follows that the transmission of schistosomiasis is spatially and temporally restricted to water bodies inhabited by intermediate host snails when humans get in con-tact with the water infested with cercariae during oc-cupational or recreational activities. Schistosomiasis has therefore been defined as an environmental dis-ease (Malone, 2005 ; Liang et al. 2007). Hence, a deeper knowledge of ecological factors, permissive to the development of the parasite-intermediate host snail system, is important to target control inter-ventions.
In 1970, the potential of aerial pictures and other remote sensing (RS) techniques to enhance our understanding of the epidemiology and control of tropical diseases was first highlighted (Cline, 1970). Fourteen years later, the first RS applications to predict the occurrence of human schistosomiasis in the Caribbean and the Philippines were published (Cross and Bailey, 1984 ; Cross et al. 1984). In 1994, the first successful application of remotely-sensed temperature data, coupled with geographical in-formation system (GIS) for prediction of human schistosomiasis was presented for the Nile delta, Egypt (Malone et al. 1994).
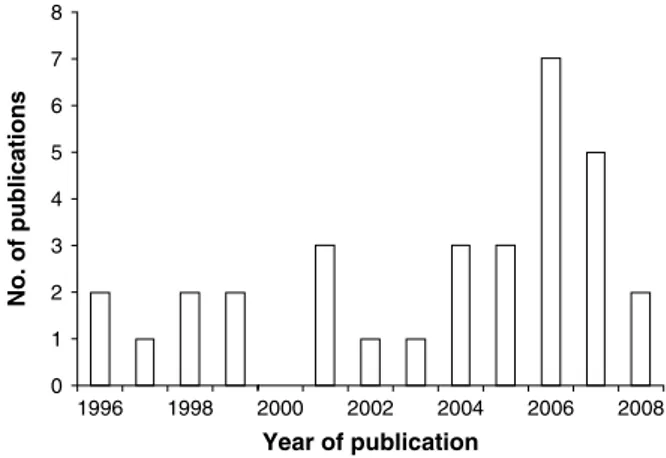
The past 15 years have seen a considerable growth of RS and GIS applications in human and veterinary epidemiology (Robinson, 2000 ; Brooker, Clements and Bundy, 2006 ; Hay et al. 2006 ; Rinaldi et al. 2006), including human schistosomiasis (Brooker, 2002 ; Yang et al. 2005). To illustrate this issue, we accessed PubMed (http://www.ncbi.nlm.nih.gov/ sites/entrez) in early 2009, and entered the following combination of terms and Boolean operators : ‘‘ re-mote sensing ’’ OR ‘‘ geographical information sys-tem ’’ OR ‘‘ mapping ’’ OR ‘‘ prediction ’’ AND ‘‘ schistosomiasis ’’ AND ‘‘ Africa ’’. We temporally restricted our search back to 1996, which revealed 41 hits, of which 32 were of relevance. Fig. 1 shows the yearly number of publications between 1996 and 2008. Several reviews have already been published that emphasise the potential of RS and GIS tech-nologies, particularly in conjunction with spatial analysis, for the ecology, epidemiology and control of schistosomiasis (Brooker and Michael, 2000 ; Brooker, 2002, 2007 ; Malone, 2005 ; Yang et al. 2005). Here, we summarize progress made to date with the application of RS and GIS with a focus on Africa, for risk mapping and prediction of (1) patterns of human schistosome infection, and (2) intermediate host snail distributions. Our review builds on the recent dis-cussion by Brooker (2007) on the spatial epidemi-ology of schistosomiasis in Africa and highlights remaining challenges. Finally, it discusses opportu-nities for integrating risk mapping of schistosomiasis with a number of other tropical diseases and there-fore complements Brooker and colleagues’ (2009)
review on integrated rapid survey methods for schistosomiasis and other neglected tropical diseases, published in the same issue of Parasitology.
W O R K I N G D E F I N I T I O N S
Box 1 provides a summary of common definitions for key terms utilized in the current review. These working definitions might help to better understand the potential applications of RS and GIS for the mapping of human schistosome infections and the distribution of intermediate host snails at various spatial and temporal scales.
W H YRSA N DGISA P P L I C A T I O N S L E N D T H E M S E L V E S F O R S C H I S T O S O M I A S I S R I S K M A P P I N G
Schistosomiasis is amenable to risk mapping since the development and survival of the parasite within the intermediate host snail and the snails themselves are sensitive to climatic factors, principally tem-perature (Appleton, 1978 ; Brooker and Michael, 2000 ; Zhou et al. 2008). Roughly, the optimal tem-perature range for Bulinus spp. and Biomphalaria spp. development is between 20 xC and 30 xC, with thermal death occurring at temperatures either below 16 xC or above 40 xC. Since temperature and altitude are strongly correlated, the latter is often used as a proxy of transmission, although the precise level varies according to setting (Brooker and Michael, 2000). Several studies have also found an association between snail distribution, abundance and rainfall ; without water snails cannot survive, whereas too much water can wash away snail populations. All of these climatic determinants of transmission are readily available from RS sources (for a review see Hay et al. (2006)), and hence can be used to develop risk models.
Man-made ecological transformations, such as deforestation (Walsh, Molyneux and Birley, 1993), changes in agricultural practices (Matthys et al.
0 1 2 3 4 5 6 7 8 1996 1998 2000 2002 2004 2006 2008 No. of pu blications Year of publication
Fig. 1. Number of publications pertaining to RS and GIS with application to schistosomiasis in Africa, published between 1996 and 2008.
C. Simoonga and others 1684
https:/www.cambridge.org/core/terms. https://doi.org/10.1017/S0031182009006222
2007), water resources development and manage-ment (Fenwick, 2006 ; Steinmann et al. 2006 ; Yang et al. 2006) and climate change (Martens, Jetten and Focks, 1997 ; Zhou et al. 2008), also determine transmission and can be captured by RS technologies as shown in some of the references cited above. However, there are several other important factors that determine localized transmission that cannot readily be captured by RS data. These include demo-graphic features and socio-economic status (Raso et al. 2006), access to clean water and adequate sanitation and educational attainment (Arinola, Arinola and Ojewale, 1996 ; Taylor et al. 1999). Such a com-plexity of factors contributes to the well-known focality of schistosomiasis, and suggests that patterns are more easily predicted at regional and national scales and that either more complex models are re-quired to predict patterns at local scales or that field
surveys are still required to finely target treatment and other interventions (Brooker, 2007 ; Brooker et al. 2009 ; Vounatsou et al. 2009).
P R E D I C T I N G P A T T E R N S O F H U M A N I N F E C T I O N
Using climatic determinants of parasite trans-mission, several studies have developed Africa-wide risk maps for malaria transmission (Craig, Snow and le Sueur, 1999 ; Hay and Snow, 2006 ; Guerra et al. 2007) and lymphatic filariasis (Lindsay and Thomas, 2000). In theory it should also be possible to develop a climate-based risk model for schistosomiasis across the continent, although to date, no such map exists. An on-going project has employed GIS to develop a comprehensive database of schistosome (and other helminth) infections in Africa and provides district-level spatial descriptions, which highlights the Box 1. Working definitions used in the current review
Remote sensing (RS), in the broadest sense, refers to the acquisition of information of an object or phenomenon, employing either a real-time sensing device that is not in physical or intimate contact with the object itself, e.g. by means of an aircraft or a satellite. In the current review, we refer to the use of imaging sensor technologies aboard satellites primarily for the acquisition of environmental data.
Geographical information system (GIS) has been defined as ‘‘ an organized collection of computer hardware, software, geographical data, and per-sonnel designed to efficiently capture, store, update, manipulate, analyze, and display all forms of geographically referenced information ’’ (ESRI, 1990). For disease epidemiology at an exploratory level, GIS is well suited for the study of associ-ations between location, disease, vector/intermedi-ate host and environment, due to its display capabilities.
Spatial analysis in relation to GIS, in broad terms, can be described as the ability to manipulate spatial data into different forms and extract additional meaning as a result. In a spatial epidemiology context, one can distinguish be-tween three types of spatial analysis tasks, namely (1) visualization/mapping, (2) exploratory data analysis, and (3) modelling (Bailey and Gatrell, 1995).
Visualization/mapping can be used in a variety of ways to explore the results of traditional statistical analyses that have been undertaken in more powerful statistical analysis software. With regard to GIS applications, the primary visualization tool is the map, which can help display for policy and strategic planning and aid in the validation of model predictions.
Exploratory data analysis aids in the detection of patterns, anomalies and the formulation of new hypotheses about the processes that gave rise to the data. Although exploratory data analysis is closely related to visualization, it often includes simplified statistical tests to explore potential predictors of the disease, smoothing/interpolation techniques as well as simplified modelling to highlight spatial patterns and empirical variogram estimation (for continuous outcome disease data) to explore spatial correlation.
Modelling involves techniques for estimating transmission parameters over the earth’s surface. Model complexity varies from climatic suitability (e.g. niche) models to spatial statistical models. The later aim (1) to assess statistical significance between predictors and spatially correlated disease outcome data, (2) to establish a mathematical relation between the disease and its predictor, and (3) to obtain model-based predictions (with uncertainty estimates) of the disease outcome at non-sampled locations (kriging) in case the disease data are available at fixed locations (geostatistical data) instead of being aggregated over adjacent area units (area data). Geostatistical models have large number of parameters (at least as many as the number of locations). For non-continuous data such as prevalence or count data maximum like-lihood-based approaches (frequentist inference) are possible only via asymptotic approximations (Gemperli and Vounatsou, 2004). Bayesian geos-tatistical models overcome asymptotic inference via Markov chain Monte Carlo (MCMC) simu-lation methods. Spatial statistical capabilities of GIS software are limited to continuous data and are not appropriate for prevalence or count disease data.
paucity of empirical data in much of the conti-nent (Brooker et al. 2000). A recent initiative, CONTRAST (see : http://www.eu-contrast.eu), has brought together existing electronic information (published and unpublished data) into a single data-base (Fig. 2). By displaying data on Google Earth and using an open-source platform accessible from the web, data management and sharing of information could become a useful tool for schistosomiasis con-trol managers and for long-term surveillance of the disease (Stensgaard et al. 2009).
A particular challenge in developing a continent-wide, climate-based schistosomiasis risk map lies in the variation in biotic requirements of different in-termediate host snail species that occur throughout Africa. This feature was previously emphasised in connection with separate schistosomiasis climatic-suitability risk models developed for Cameroon and Tanzania and an attempt to apply each model to the other setting. It was found that, while each model provided a reasonable prediction in the setting where they were developed, they were unable to predict risk in other settings reliably. However, each model could be extrapolated within the same ecological zone, pre-sumed to reflect the distribution of different inter-mediate host snail species (Brooker, Hay and Bundy, 2002 a). Therefore, in order to develop a continental risk map for schistosomiasis, there would be the need to construct a composite risk map, which takes into account different ecological zones and differential snail distributions and compatibilities thereof. The above-mentioned EU-funded CONTRAST project
has taken up the challenge of developing schisto-somiasis climatic suitability risk maps as well as empirical maps based on spatial statistical models and detailed knowledge of the local snail fauna.
Such a continental risk map can be characterized as a macro-level description of schistosomiasis risk. Thus far, models of schistosomiasis have mainly been developed at regional and national scales ; the latter of which is considered meso-level. Further models have been developed at local scales (unit of a single village or district), so-called micro-level models. Table 1 provides an overview of studies which have investigated the risk of human schisto-some infection, emphasizing the scale, what kind of RS environmental data were utilized and the ap-plication of GIS and spatial analysis.
Employing a variety of statistical approaches, national-level or sub-national models of schisto-somiasis risk have been developed in Cameroon (Brooker et al. 2002 b), Egypt (Malone et al. 1994 ; Abdel-Rahman et al. 2001), Ethiopia (Malone et al. 2001), South Africa (Moodley et al. 2003), Tanzania (Brooker et al. 2001, 2002 a ; Clements et al. 2006 a), Uganda (Kabatereine et al. 2004 ; Stensgaard et al. 2005), Zimbabwe (Mukaratirwa et al. 1999) and Zambia (Simoonga et al. 2008). The earliest of these studies were based on simple threshold analysis or traditional regression modelling to predict infection risk ; more recently, studies have adopted a Bayesian platform of analysis. Using a Bayesian geostatistical method of inference, a regional-scale map of the in-tensity of S. mansoni infection has been developed for East Africa (Clements, Moyeed and Brooker, 2006 b), and for high-risk areas of S. haematobium in West Africa (Clements et al. 2008 b). As indicated above, other factors may also determine infection patterns, including demographic, educational and socio-economic status and ecological transform-ations, which could be included into available meso-level models. However, such complex models are not currently available.
At the micro-scale, a number of studies have been carried out in the region of Man, western Coˆte d’Ivoire and in different parts of Kenya. In Coˆte d’Ivoire, for example, one investigation focused on the spatial distribution of S. mansoni among school-children from a single village and concluded that there was no clear pattern of infection risk, probably explained by a limited number of transmission sites that are accessed by most of the schoolchildren (Utzinger et al. 2003). In-depth studies focusing on over 50 rural schools covering an area of 40r60 km allowed developing an integrated risk profiling ap-proach for prediction of high-risk areas of S. mansoni. A variety of data sources (i.e. demographic data obtained from readily available school registries, RS environmental data and digitized ground maps, and socio-economic data collected through a cross-sectional questionnaire survey administered by
Fig. 2. Map of Africa depicting the countries where GIS and RS applications have been used for the mapping and prediction of human schistosomiasis and
intermediate host snails (and human infection).
C. Simoonga and others 1686
https:/www.cambridge.org/core/terms. https://doi.org/10.1017/S0031182009006222
teachers), was utilized for setting up a comprehensive GIS, including a digital elevation model. Bayesian geostatistical models were fitted to probe for sig-nificant associations between an infection with S. mansoni and demographic, environmental and socio-economic factors. With regard to environ-mental data, at the unit of the school, significant correlations were found between the infection prevalence of S. mansoni and stream order of the nearest river, water catchment area and altitude (Raso et al. 2005, 2006 ; Beck-Wo¨rner et al. 2007).
In Kenya, a number of studies have been carried out to assess the risk of schistosomiasis at a micro-scale (Handzel et al. 2003 ; Booth et al. 2004 ; Clennon et al. 2004). Along the southern coast of Kenya, for example, high S. haematobium infection intensities were clustered around water bodies containing high numbers of infected intermediate host snails (Clennon et al. 2004). The prevalence of intestinal schistosomiasis among children attending schools near Lake Victoria was positively associated with proximity to the lake shore and specific water-related activities such as swimming, fishing and collecting water (Handzel et al. 2003 ; Stothard et al. 2005).
A clear inference from the studies summarized in Table 1 is the importance of considering the snail species involved in schistosome transmission. The next section reviews studies which have attempted to predict the distribution of intermediate host snail species across Africa.
P R E D I C T I N G I N T E R M E D I A T E H O S T S N A I L D I S T R I B U T I O N S
Reviewing the literature has revealed that only a few studies have utilized GIS and RS for mapping and modelling schistosome intermediate host snail dis-tribution in different parts of Africa (Table 2). Most of these studies have used GIS in conjunction with RS environmental data proxies, to produce climatic suitability maps for the intermediate host snails. As with the human infection predictions, most studies using GIS and RS to map the snail distributions, have been conducted at the national (meso-) scale, a few at the micro-scale (Clennon et al. 2006) – but none so far has attempted a continent-wide mapping. The first study to include snail data in relation to schistosomiasis risk was carried out by Kristensen and colleagues (Kristensen, Malone and McCarroll, 2001) in Ethiopia. Subsequent studies that used cli-matic and environmental data to predict human schistosome infection could be improved by the addition of snail-specific distribution data. For ex-ample, the use of disease and temperature data facilitated the delineation of areas permissible for S. mansoni and S. haematobium transmission in South Africa. It has been speculated that the models could have been validated and further refined by using snail distribution maps as an integral part in
the models. Since the distribution of freshwater snails in South Africa is well documented, it would seem logical and straightforward to combine this information with previous results published in the peer-reviewed literature (Moodley et al. 2003).
We conjecture that investigations that will shed light on the ecological requirements of the inter-mediate host snails are essential, because they will deepen our understanding of basic factors for schistosomiasis transmission. Using environmental or climatic data such as land surface temperature (LST), rainfall or normalized difference vegetation index (NDVI) to predict the risk of schistosomiasis, in effect, one is predicting the environmental re-quirements for a particular snail species (infected with a particular parasite species) – and not the human parasitic infection per se. A further refine-ment of the prediction is to include human infection predictors such as socio-economic status and behav-iour, as has been stressed in the previous section. Furthermore, the mapping of infected snails – not just snail or human infection – could help clarify the complex interaction between snail, parasites and the environmental factors that are usually employed to predict their distributions.
There are a number of challenges that must be overcome in order to further improve the GIS-based mapping of intermediate host snails at a continental scale. An important shortcoming is the scarceness of geo-referenced quality data even on the presence/ absence of snails, let alone parasite-snail compati-bilities. Another complication is the fact that in certain areas the complete understanding of species identity and its capability as intermediate host snails has yet to be fully understood (Stothard et al. 2002). It would be recommended to build more on the ex-periences and methodologies of the bio-geographical (macro-ecological) sciences in mapping species distribution and diversity. An overview of these methodologies, together with their strengths and weaknesses can be found in a recent review by Elith et al. (2006). However, until now only few researchers have taken up the task of relating intermediate host snails and snail diversity to environmental fac-tors, disease prevalences, demographic and socio-economic profiles of the local population through the opportunities GIS and RS offer.
C O N C L U S I O N S
The use of GIS and RS technologies – increasingly employed in concert with spatial analysis – to further our understanding of the ecology and epidemiology of schistosomiasis in sub-Saharan Africa, and hence spatial targeting of control interventions has been harnessed for sometime now. We believe that these tools can make an important contribution towards optimized schistosomiasis control efforts at different spatial scales. Indeed, the use of RS and GIS have
Table 1. Characteristics of studies using GIS, RS and spatial analysis for the mapping and prediction of human schistosomiasis and transmission modelling
Study aim Study area
Spatial scale
Data sources and parameters for GIS
Spatial analysis Reference RS environmental
data
Demographic, epidemiological and socio-economic data To determine the relative risk of schistosomiasis
for interactive analysis and planning of control activities
Nile delta, Egypt Meso Tmax, Tmin, dT Prevalence data of S. haematobium
and S. mansoni
Exploratory data analysis
Malone et al. (1994) To develop suitability maps for S. haematobium
and S. mansoni at a national scale
Zimbabwe Meso NDVI,
Tmax, Tmin
Prevalence data of S. haematobium and S. mansoni
Visualization/ mapping
Mukaratirwa et al. (1999) To collate available survey data in a single
database to (1) describe schistosome prevalence across Africa, and (2) highlight areas for which further information is required
Sub-Saharan Africa
Macro n.d. Prevalence data of S. haemabobium
and S. mansoni
Visualization/ mapping
Brooker et al. (2000)
To predict the risk of schistosomiasis and to initiate the use of the resulting GIS model for integrated schistosomiasis control
Kafr El-Sheikh governorate, Egypt Micro-meso NDVI, Tmax, Tmin, dT
Prevalence data of S. mansoni Exploratory data analysis and modelling
Abdel-Rahman et al. (2001) To develop schistosome prediction maps for
spatial targeting of mass drug administration
Tanzania Meso LST, NDVI Prevalence data of S. haematobium
(reported ‘ blood in urine ’ used as a proxy measure) Exploratory data analysis and modelling Brooker et al. (2001) To model the distribution of S. haematobium
across the country
Cameroon Macro LST, rainfall Prevalence data of S. haematobium Exploratory data analysis and modelling
Brooker et al. (2002 b) To develop temperature-suitability maps for
schistosomiasis in South Africa
South Africa Macro Mdx, Mdn,
temperature
Prevalence data of S. mansoni and S. haematobium ; population data
Exploratory data analysis and modelling
Moodley et al. (2003) To examine the spatial distribution of S. mansoni
in a single village
Fagnampleu, Man region, Coˆte d’Ivoire
Micro n.d. Prevalence data of S. mansoni Exploratory data
analysis
Utzinger et al. (2003) To identify risk factors explaining the geographical
distribution of S. mansoni infections in the mountainous region of Man
Man region, Coˆte d’Ivoire
Meso LST, NDVI,
rainfall
Prevalence data of S. mansoni Exploratory data analysis and modelling
Raso et al. (2005) To model the distribution of S. mansoni and
intermediate host snails in Uganda using satellite sensor data and GIS
Uganda Macro LST, NDVI Prevalence data of S. mansoni ;
Biomphalaria spp. snail data
Exploratory data analysis and modelling
Stensgaard et al. (2005) To investigate spatial patterns of urinary
schistosomiasis infection in a highly endemic area of coastal Kenya
Msambweni division, Kenya
Micro Water chemistry, distance to water bodies Prevalence data of S. haematobium ; age Exploratory data analysis Clennon et al. (2006) C. Simoonga and others 1688 https:/www.cambridge.org/core/terms . https://doi.org/10.1017/S0031182009006222 Downloaded from https:/www.cambridge.org/core
. University of Basel Library
, on
30 May 2017 at 17:48:34
been instrumental for identification of high-risk areas in order to prioritize subsequent control interventions of national schistosomiasis control programmes of Uganda, Tanzania and in West Africa (Brooker, 2007 ; Clements et al. 2008 a,b). In Uganda, for example, early geographical analyses concluded that no S. mansoni transmission occurred in areas characterized by annual precipitation below 850 mm or at altitudes above 1400 m (Kabatereine et al. 2004). On the other hand, high S. mansoni prevalences (>50%) were consistently observed in areas within 5 km of Lake Victoria and Lake Albert, and hence these areas were selected for mass treatment with praziquantel without further surveys. Rapid para-sitological mapping was conducted in the remaining areas, using the lot quality assurance sampling (Brooker et al. 2009 – in this issue of the journal). A small team collected stool samples from only about 15 children per locality ; if more than 7 children were infected with S. mansoni, mass treatment was in-itiated. It will be interesting to monitor the spatial distribution of schistosome infections as control ef-forts are further intensified, so that spatial targeting of control interventions can be readily adapted and areas at highest risk identified and prioritized for sub-sequent control interventions. In Burkina Faso, Mali and Niger, Bayesian spatial modelling of field data was used to create maps of the probability of preva-lence with S. haematobium being >50% (Clements et al. 2008 b). In addition to guiding treatment imple-mentation, the maps also provided an estimate of the uncertainty in spatial predictions, enabling control managers to assess the reliability of the predictions.
It should also be noted that over the years of ap-plication, major elements of the RS and GIS tech-nologies have not met current needs and expectations for this cause and some researchers have aired their growing frustration (Herbreteau et al. 2007). Con-straints have been identified under this review to include the spatial resolution. This has generally affected usefulness of the developed models and maps for reducing micro-scale transmission through improved resource targeting.
Other predictors such as socio-economics and demographics, wherever investigated in this review were useful in explaining spatial heterogeneity in schistosomiasis transmission, particularly focal loci. Socio-economic factors such as availability of sanitary facilities and safe water supply may better explain different levels of transmission at local-scale than for instance poverty quintiles as seen in a micro-level study in Coˆte d’Ivoire (Raso et al. 2005). This topic warrants further investigation.
The advance towards integrated spatial risk maps needs to be explored further. Benefits are obvious in sub-Saharan Africa if already over-stretched health-care delivery systems are to be used to sustainably deploy control interventions targeting schistoso-miasis and other so-called neglected tropical diseases
To model the prevalence of schistosome infections using a Bayesian approach NW Tanzania Macro LST, distance to water bodies Prevalence data of S. mansoni and S. haematobium Exploratory data analysis and modelling Clements et al . (2006 a ) To model the regional distribution of intensity of S. mansoni infection using a Bayesian approach East Africa Macro Elevation, distance to water bodies Intensity data of S. mansoni Exploratory data analysis and modelling Clements et al . (2006 b ) To model the distribution of schistosomiasis based on a national questionnaire survey and using a Bayesian approach Tanzania Macro LST, NDVI, elevation Prevalence of reported schistosomiasis Exploratory data analysis and modelling Clements et al . (2008 a ) To model S. haematobium prevalence and to predict the underlying uncertainty of prediction using a Bayesian approach West Africa Macro LST, distance to water bodies, age, sex Prevalence data of S. haematobium
Logistic regression analysis
Clements et al . (2008 b ) dT, temperature difference ; LST, land surface temperature ; Mdn, mean daily minimum temperature ; Mdx, mean daily maximum temperature ; n.d., not dete rmined ; NDVI, normalized difference vegetation index ; Tmax , maximum temperature ; Tmin , minimum temperature.
Table 2. Characteristics of studies using GIS, RS and spatial analysis for the mapping and prediction of human schistosomiasis and transmission modelling, using data on intermediate host snails.
Study aim Study area Spatial scale
Data sources and parameters for GIS
Spatial analysis Reference RS environmental
data Snail data
To develop suitability maps for S. haematobium and S. mansoni at a national scale
Zimbabwe Meso NDVI, Tmax, Tmin Prevalence data of
B. pfeifferi and B. globosus
Visualization/mapping Mukaratirwa et al. (1999)
To predict the risk of schistosomiasis and to initiate the use of the resulting GIS model for integrated schistosomiasis control
Kafr El-Sheikh governorate, Egypt
Micro-meso NDVI, Tmax,
Tmin, dT
Prevalence data of B. alexandrina
Exploratory data analysis and modelling
Abdel-Rahman et al. (2001) To develop snail distribution and abundance
model that can be used as a component of a GIS disease risk model (Malone et al. 2001) previously developed using a satellite-retrieved data, agro-climatic data and hu-man infection prevalence data from Ethiopia
Ethiopia Macro NDVI, Tmax Prevalence data of
B. pfeifferi
Kristensen et al. (2001)
To predict the distribution of Bulinus globosus and B. nasutus and the endemic zone of transmission of S. haematobium
Unguja,
Zanzibar Island
Micro-meso NDVI, water chemistry
Bulinus spp. Visualization/mapping Stothard et al. (2002) To model the distribution of S. mansoni and
intermediate host snails in Uganda using satellite sensor data and GIS
Uganda Macro LST, NDVI Biomphalaria spp. Exploratory data analysis
and modelling
Stensgaard et al. (2005)
To model freshwater snail habitat suitability and areas of potential snail-borne disease transmission in Uganda
Uganda Macro LST, NDVI Biomphalaria spp.
and Bulinus spp.
Exploratory data analysis and modelling
Stensgaard et al. (2006)
To investigate spatial patterns of urinary schistosomiasis infection in a highly endemic area of coastal Kenya
Msambweni division, Kenya
Micro Water chemistry,
distance to water bodies
Prevalence of B. nasutus
Exploratory data analysis Clennon et al. (2006)
dT, temperature difference ; LST, land surface temperature ; NDVI, normalized difference vegetation index ; Tmax, maximum temperature ; Tmin, minimum temperature.
C. Simoonga and others 1690 https:/www.cambridge.org/core/terms . https://doi.org/10.1017/S0031182009006222 Downloaded from https:/www.cambridge.org/core
. University of Basel Library
, on
30 May 2017 at 17:48:34
(Brooker and Utzinger, 2007 ; Brooker et al. 2009). This has to be approached with caution, particularly where the desire for integration of different inter-vention packages reduces the effectiveness of single interventions. To help target an integrated package of preventive chemotherapy there is a requirement to explore the possibility of developing multiple risk maps for a number of different neglected tropical diseases. Such maps need to be based on detailed and standardised survey data with which to develop separate risk models ; these are generally not available at present. Integrated surveys of neglected tropical diseases are currently planned or are underway for a number of countries, including Burundi, Ethiopia, Southern Sudan and Zambia, and provide an op-portunity to investigate the possibility of developing integrated risk maps (Brooker et al. 2009).
Effective application of GIS and RS for schisto-somiasis and other neglected tropical diseases in sub-Saharan Africa now needs to be improved and finitely-scaled maps and models developed that will provide accurate spatial estimates of the disease burden and risk of infection in order to support control efforts cost-effectively. This can be achieved through the iterative analysis of important spatial predictors of transmission dynamics, in a GIS. Therefore, projects such as CONTRAST allow such important opportunities to address the challenges of applying GIS and RS technologies in sub-Saharan Africa in order to optimize control and surveillance of schistosomiasis and other tropical diseases that remain more or less neglected.
A C K N O W L E D G E M E N T
CS is supported by CONTRAST Research Node at the University of Zambia (Contract No. 032203), and also acknowledges great support from the Zambian Ministry of Health ; JU is grateful to the Swiss National Science Foundation (project no. PPOOB-102883, POOB-119129) ; SB is in receipt of a Wellcome Trust Research Career Development Fellowship (081673) and acknowledges the support of the Kenyan Medical Research Institute ; PV is grateful to the Swiss National Science Foundation (project no. 3252B0-102136) ; ASS acknowledges the International PhD School of Biodiversity Sciences (ISOBIS) for fi-nancial support.
R E F E R E N C E S
Abdel-Rahman, M. S., El-Bahy, M. M., Malone, J. B., Thompson, N. M. and El-Bahy, N. M. (2001). Geographical information systems as a tool for control program management for schistosomiasis in Egypt.
Acta Tropica79, 49–57.
Appleton, C. C. (1978). Review of literature on abiotic factors influencing the distribution and life-cycles of bilharziasis intermediate host snails. Malacological
Review11, 1–25.
Arinola, O., Arinola, A. and Ojewale, S. (1996). Control of urinary schistosomiasis in Nigeria. World Health
Forum17, 291–292.
Bailey, T. C. and Gatrell, A. C. (1995). Interactive Spatial Data Analysis. Addison-Wesley, Reading, MA, USA.
Beck-Wo¨ rner, C., Raso, G., Vounatsou, P.,
N’Goran, E. K., Rigo, G., Parlow, E. and Utzinger, J. (2007). Bayesian spatial risk prediction of Schistosoma mansoni infection in western Coˆte d’Ivoire using a remotely-sensed digital elevation model. American
Journal of Tropical Medicine and Hygiene76, 956–963.
Booth, M., Vennervald, B. J., Kenty, L., Butterworth, A. E., Kariuki, H. C., Kadzo, H., Ireri, E.,
Amaganga, C., Kimani, G., Mwatha, J. K., Otedo, A., Ouma, J. H., Muchiri, E. and Dunne, D. W. (2004). Micro-geographical variation in exposure to Schistosoma mansoni and malaria, and exacerbation of splenomegaly in Kenyan school-aged children. BMC Infectious Diseases4, 13.
Brooker, S. (2002). Schistosomes, snails and satellites.
Acta Tropica82, 207–214.
Brooker, S. (2007). Spatial epidemiology of human schistosomiasis in Africa : risk models, transmission dynamics and control. Transactions of the Royal Society
of Tropical Medicine and Hygiene101, 1–8.
Brooker, S., Clements, A. C. A. and Bundy, D. A. P. (2006). Global epidemiology, ecology and control of soil-transmitted helminth infections. Advances in
Parasitology62, 221–261.
Brooker, S., Hay, S. I. and Bundy, D. A. P. (2002 a). Tools from ecology : useful for evaluating infection risk models ? Trends in Parasitology18, 70–74.
Brooker, S., Hay, S. I., Issae, W., Hall, A., Kihamia, C. M., Lwambo, N. J. S., Wint, W., Rogers, D. J. and Bundy, D. A. P. (2001). Predicting the distribution of urinary schistosomiasis in Tanzania using satellite sensor data. Tropical Medicine and International Health 6, 998–1007.
Brooker, S., Hay, S. I., Tchuem Tchuente, L. A. and Ratard, R. (2002 b). Using NOAA-AVHRR data to model human helminth distributions in planning disease control in Cameroon, West Africa. Photogrammetric
Engineering and Remote Sensing68, 175–179.
Brooker, S., Kabatereine, N. B., Gyapong, J. O., Stothard, J. R. and Utzinger, J. (2009). Rapid assessment of schistosomiasis and other neglected tropical diseases in the context of integrated control
programmes in Africa. Parasitology136, 1707–1718.
doi : 10.1017/S0031182009005940
Brooker, S. and Michael, E. (2000). The potential of geographical information systems and remote sensing in the epidemiology and control of human helminth infections. Advances in Parasitology47, 245–288. Brooker, S., Rowlands, M., Haller, L., Savioli, L. and
Bundy, D. A. P. (2000). Towards an atlas of human helminth infection in sub-Saharan Africa : the use of geographical information systems (GIS). Parasitology
Today16, 303–307.
Brooker, S. and Utzinger, J. (2007). Integrated disease mapping in a polyparasitic world. Geospatial Health1, 141–146.
Brown, D. S. (1994). Freshwater Snails of Africa and their Medical Importance. Taylor & Francies (2nd ed.), London, UK, 1–608.
Clements, A. C. A., Brooker, S., Nyandindi, U., Fenwick, A. and Blair, L. (2008 a). Bayesian spatial analysis of a national urinary schistosomiasis
questionnaire to assist geographic targeting of schistosomiasis control in Tanzania, East Africa. International Journal for Parasitology38, 401–415.
Clements, A. C. A., Garba, A., Sacko, M., Toure´ , S.,
Dembele´ , R., Landoure´, A., Bosque-Oliva, E.,
Gabrielli, A. F. and Fenwick, A. (2008 b). Mapping the probability of schistosomiasis and associated uncertainty, West Africa. Emerging Infectious Diseases 14, 1629–1632.
Clements, A. C. A., Lwambo, N. J. S., Blair, L., Nyandindi, U., Kaatano, G., Kinung’hi, S.,
Webster, J. P., Fenwick, A. and Brooker, S. (2006 a). Bayesian spatial analysis and disease mapping : tools to enhance planning and implementation of a
schistosomiasis control programme in Tanzania.
Tropical Medicine and International Health11, 490–503.
Clements, A. C. A., Moyeed, R. and Brooker, S. (2006 b). Bayesian geostatistical prediction of the intensity of infection with Schistosoma mansoni in East Africa. Parasitology133, 711–719.
Clennon, J. A., King, C. H., Muchiri, E. M., Kariuki, H. C., Ouma, J. H., Mungai, P. and Kitron, U. (2004). Spatial patterns of urinary schistosomiasis infection in a highly endemic area of coastal Kenya. American Journal of Tropical Medicine
and Hygiene70, 443–448.
Clennon, J. A., Mungai, P. L., Muchiri, E. M., King, C. H. and Kitron, U. (2006). Spatial and temporal variations in local transmission of Schistosoma haematobium in Msambweni, Kenya. American Journal
of Tropical Medicine and Hygiene75, 1034–1041.
Cline, B. L. (1970). New eyes for epidemiologists : aerial photography and other remote sensing techniques.
American Journal of Epidemiology92, 85–89.
Craig, M. H., Snow, R. W. and le Sueur, D. (1999). A climate-based distribution model of malaria transmission
in sub-Saharan Africa. Parasitology Today15, 105–111.
Cross, E. R. and Bailey, R. C. (1984). Prediction of areas endemic for schistosomiasis through use of discriminant
analysis of environmental data. Military Medicine149,
28–30.
Cross, E. R., Sheffield, C., Perrine, R. and Pazzaglia, G. (1984). Predicting areas endemic for schistosomiasis using weather variables and a Landsat data base.
Military Medicine149, 542–544.
Elith, J., Graham, C. H., Anderson, R. P., Dudik, M., Ferrier, S., Guisan, A., Hijmans, R. J., Huettmann, F., Leathwick, J., Lehmann, A., Li, J., Lohmann, L. G., Loiselle, B. A., Manion, G., Moritz, C., Nakamura, M., Nakazawa, Y., Overton, J. M., Peterson, A. T., Phillips, S. J., Richardson, K., Scachetti-Pereira, R., Schapire, R., Sobero´n, J., Williams, S., Wisz, M. S. and Zimmermann, N. E. (2006) Novel methods improve prediction of species’
distributions from occurrence data. Ecography29,
129–151.
ESRI (1990). Understanding GIS : The ARC/INFO Method. Environmental System Research Institute. Redlands, CA, USA.
Fenwick, A. (2006). Waterborne infectious
diseases – could they be consigned to history ? Science 313, 1077–1081.
Gemperli, A. and Vounatsou, P. (2004). Fitting generalized linear mixed models for point-referenced
data. Journal of Modern Applied Statistical Methods2, 497–511.
Guerra, C. A., Hay, S. I., Lucioparedes, L. S., Gikandi, P. W., Tatem, A. J., Noor, A. M. and Snow, R. W. (2007). Assembling a global database of malaria parasite prevalence for the malaria atlas project.
Malaria Journal6, 17.
Handzel, T., Karanja, D. M. S., Addiss, D. G., Hightower, A. W., Rosen, D. H., Colley, D. G., Andove, J., Slutsker, L. and Secor, W. E. (2003). Geographic distribution of schistosomiasis and soil-transmitted helminths in western Kenya : implications for anthelminthic mass treatment. American Journal of
Tropical Medicine and Hygiene69, 318–323.
Hay, S. I. and Snow, R. W. (2006). The malaria atlas project : developing global maps of malaria risk.
PLoS Medicine3, e473.
Hay, S. I., Tatem, A. J., Graham, A. J., Goetz, S. J. and Rogers, D. J. (2006). Global environmental data for mapping infectious disease distribution. Advances in Parasitology62, 37–77.
Herbreteau, V., Salem, G., Souris, M., Hugot, J. P. and Gonzalez, J. P. (2007). Thirty years of use and improvement of remote sensing, applied to
epidemiology : from early promises to lasting frustration.
Health and Place13, 400–403.
Kabatereine, N. B., Brooker, S., Koukounari, A., Kazibwe, F., Tukahebwa, E. M., Fleming, F. M., Zhang, Y., Webster, J. P., Stothard, J. R. and Fenwick, A. (2007). Impact of a national helminth control programme on infection and morbidity in Ugandan schoolchildren. Bulletin of the World Health
Organization85, 19–99.
Kabatereine, N. B., Brooker, S., Tukahebwa, E. M., Kazibwe, F. and Onapa, A. W. (2004). Epidemiology and geography of Schistosoma mansoni in Uganda : implications for planning control. Tropical Medicine and International Health9, 372–380.
Kristensen, T. K., Malone, J. B. and McCarroll, J. C. (2001). Use of satellite remote sensing and geographic information systems to model the distribution and abundance of snail intermediate hosts in Africa : a preliminary model for Biomphalaria pfeifferi in Ethiopia.
Acta Tropica79, 73–78.
Koukounari, A., Gabrielli, A. F., Toure, S., Bosque-Oliva, E., Zhang, Y., Sellin, B., Donnelly, C. A., Fenwick, A. and Webster, J. P. (2007). Schistosoma haematobium infection and morbidity before and after large-scale administration of praziquantel in Burkina Faso. Journal of Infectious Diseases196, 659–669. Liang, S., Seto, E. Y. W., Remais, J. V., Zhong, B.,
Yang, C., Hubbard, A., Davis, G. M., Gu, X. G., Qiu, D. C. and Spear, R. C. (2007). Environmental effects on parasitic disease transmission exemplified by schistosomiasis in western China. Proceedings of the National Academy of Sciences of the United States of
America104, 7110–7115.
Lindsay, S. W. and Thomas, C. J. (2000). Mapping and estimating the population at risk from lymphatic filariasis in Africa. Transactions of the Royal Society of
Tropical Medicine and Hygiene94, 37–45.
Malone, J. B. (2005). Biology-based mapping of vector-borne parasites by geographic information systems and remote sensing. Parassitologia47, 27–50.
C. Simoonga and others 1692
https:/www.cambridge.org/core/terms. https://doi.org/10.1017/S0031182009006222
Malone, J. B., Huh, O. K., Fehler, D. P., Wilson, P. A., Wilensky, D. E., Holmes, R. A. and Elmagdoub, A. I. (1994). Temperature data from satellite imagery and the distribution of schistosomiasis in Egypt. American
Journal of Tropical Medicine and Hygiene50, 714–722.
Malone, J. B., Yilma, J. M., McCarroll, J. C., Erko, B., Mukaratirwa, S. and Zhou, X. Y. (2001). Satellite climatology and environmental risk of Schistosoma
mansoni in Ethiopia and East Africa. Acta Tropica79,
59–72.
Martens, W. J. M., Jetten, T. H. and Focks, D. A. (1997). Sensitivity of malaria, schistosomiasis and
dengue to global warming. Climate Change35, 145–156.
Matthys, B., Tschannen, A. B., Tian-Bi, N. T.,
Comoe´, H., Diabate´ , S., Traore´, M., Vounatsou, P.,
Raso, G., Gosoniu, L., Tanner, M., Cisse´, G., N’Goran, E. K. and Utzinger, J. (2007). Risk factors for Schistosoma mansoni and hookworm in urban farming communities in western Coˆte d’Ivoire. Tropical
Medicine and International Health12, 709–723.
Moodley, I., Kleinschmidt, I., Sharp, B., Craig, M. and Appleton, C. (2003). Temperature-suitability maps for schistosomiasis in South Africa. Annals of
Tropical Medicine and Parasitology97, 617–627.
Mukaratirwa, S., Malone, J. B., McCarroll, J. C. and Kristensen, T. K. (1999). Satellite surveillance, geographical information systems and the seasonal suitability of environment for the development of the snail-parasite system of urinary and intestinal schistosomiasis in Zimbabwe. Proceedings of the Workshop on Medical and Veterinary Malacology in Africa, Harare, Zimbabwe, pp. 265–271. Publication of the Danish Bilharziasis Laboratory, Copenhagen, Denmark.
Raso, G., Matthys, B., N’Goran, E. K., Tanner, M., Vounatsou, P. and Utzinger, J. (2005). Spatial risk prediction and mapping of Schistosoma mansoni infections among schoolchildren living in western Coˆte d’Ivoire. Parasitology131, 97–108.
Raso, G., Vounatsou, P., Singer, B. H., N’Goran, E. K., Tanner, M. and Utzinger, J. (2006). An integrated approach for risk profiling and spatial prediction of Schistosoma mansoni-hookworm coinfection. Proceedings
of the National Academy of Sciences, USA103,
6934–6939.
Rinaldi, L., Musella, V., Biggeri, A. and Cingoli, G. (2006). New insights into the application of geographical information systems and remote sensing in veterinary parasitology. Geospatial Health1, 33–47.
Robinson, T. P. (2000). Spatial statistics and geographical information systems in epidemiology and public health.
Advances in Parasitology47, 81–127.
Simoonga, C., Kazembe, L. N., Kristensen, T. K., Olsen, A., Appleton, C. C., Mubita, P. and Mubila, L. (2008). The epidemiology and small-scale spatial heterogeneity of urinary schistosomiasis in Lusaka
province, Zambia. Geospatial Health3, 57–67.
Steinmann, P., Keiser, J., Bos, R., Tanner, M. and Utzinger, J. (2006). Schistosomiasis and water resources development : systematic review, meta-analysis, and estimates of people at risk. Lancet Infectious Diseases6, 411–425.
Stensgaard, A., Jorgensen, A., Kabatereine, N. B., Malone, J. B. and Kristensen, T. K. (2005). Modelling
the distribution of Schistosoma mansoni and host snails in Uganda using satellite sensor data and geographical
information systems. Parassitologia47, 115–125.
Stensgaard, A., Jorgensen, A., Kabatereine, N. B., Rahbek, C. and Kristensen, T. K. (2006). Modeling freshwater snail habitat suitability and areas of potential snail-borne disease transmission in Uganda. Geospatial
Health1, 93–104.
Stensgaard, A. S., Saarnak, C. F. L., Utzinger, J., Vounatsou, P., Simoonga, C., Mushinge, G., , Rahbek, C., Møhlenberg, F. and Kristensen, T. K. (2009). Virtual globes and geospatial health : the potential of new tools in the management and control of vector-borne diseases. Geospatial Health3, 127–141. Stothard, J. R., Kabatereine, N. B., Tukahebwa, E. M.,
Kazibwe, F., Mathieson, W., Webster, J. P. and Fenwick, A. (2005). Field evaluation of the Meade Readiview handheld microscope for diagnosis of intestinal schistosomiasis in Uganda school children.
American Journal of Tropical Medicine and Hygiene73,
949–955.
Stothard, J. R., Mgeni, A. F., Khamis, S., Kristensen, T. K., Hubbard, S. J., Seto, E., Ramsan, M. and Rollinson, D. (2002). New insights into the transmission biology of urinary schistosomiasis in Zanzibar. Transactions of the Royal Society of Tropical
Medicine and Hygiene96, 470–475.
Taylor, M., Coovadia, H. M., Kvalsvig, J. D., Jinabhai, C. C. and Reddy, P. (1999). Helminth control as an entry point for health-promoting schools in Kwa
Zulu-Natal. South African Medical Journal89, 891–892.
Utzinger, J., Mu¨ ller, I., Vounatsou, P., Singer, B. H., N’Goran, E. K. and Tanner, M. (2003). Random spatial distribution of Schistosoma mansoni and hookworm infections among schoolchildren within a single village. Journal of Parasitology89, 686–692. Vounatsou, P., Raso, G., Tanner, M., N’Goran, E. K.
and Utzinger, J. (2009). Bayesian geostatistical modelling for mapping schistosomiasis transmission.
Parasitology136, 1695–1705. doi :10.1017/
S003118200900599X
Walsh, J. F., Molyneux, D. H. and Birley, M. H. (1993). Deforestation : effects on vector-borne disease.
Parasitology106 (Suppl.), S55–75.
WHO (2002). Prevention and control of schistosomiasis and soil-transmitted helminthiasis. First report of the joint WHO expert committees. WHO Technical Report Series912, 1–57.
Yang, G. J., Vounatsou, P., Tanner, M., Zhou, X. N. and Utzinger, J. (2006). Remote sensing for predicting potential habitats of Oncomelania hupensis in Hongze, Baima and Gaoyou lakes in Jiangsu province, China.
Geospatial Health1, 85–92.
Yang, G. J., Vounatsou, P., Zhou, X. N., Utzinger, J. and Tanner, M. (2005). A review of geographic information system and remote sensing with applications to the epidemiology and control of
schistosomiasis in China. Acta Tropica96, 117–129.
Zhou, X. N., Yang, G. J., Yang, K., Wang, X. H., Hong, Q. B., Sun, L. P., Malone, J. B., Kristensen, T. K., Bergquist, N. R. and Utzinger, J. (2008). Potential impact of climate change on schistosomiasis
transmission in China. American Journal of Tropical