Proceedings of the Nutrition Society (1996), 55, 621-640 62 1
P R O C E E D I N G S O F T H E N U T R I T I O N S O C I E T Y
The Summer Meeting of the Nutrition Society with I’Association Francaise de Nutrition was held at the University of Aberdeen on 11-14 July 1995
The Lord Boyd Orr Memorial Lecture
‘Within a decade no child will go to bed hungry?’
B Y J O H N B . M A S O N
United Nations Administrative Committee on CoordinationlSub-Committee on Nutrition (ACCISCN), clo World Health Organization, 20 Avenue Appia, CH-1211 Geneva 27, Switzerland
Ritchie Calder (1966), a journalist, friend, and chronicler of Boyd Orr’s exploits, from what was probably one of their first meetings, in the 1930s wrote:
“‘Dr Orr” I said. “You seem to have a chip on your shoulder. What’s wrong? What’s biting you?”
Boyd Orr did not bridle at the impertinence. He kindled. And he told me in no uncertain terms what was wrong. As director of the Rowett his job was to discover, demonstrate and convince farmers of the value of nutrition. That was easy (he said) because the scientists could prove to the farmers that it paid dividends in terms of their flocks and herds. But there were bigger dividends to be paid in human well-being, yet he could not get people interested in the nutrition of children.’
We have made some progress on this issue, but it remains a continual battle to convince those who make policy, and who spend public funds, that human nutrition really matters, and that it merits priority. In terms of foreign aid, this is particularly true at the moment, and in this country not least. To carry the analogy with farmers a little bit further: what would farmers make of the physical condition of the human species, the human flock, today? I think that they’d be appalled. At least one-third of the young have significant growth failure, about half the population is anaemic, especially reproductive- aged women, and many children are blind or mentally retarded for lack of vitamin A or iodine. Some of this, now as 60 years ago, could be fixed quite easily.
But would Boyd Orr be totally disappointed? His diagnosis may seem somewhat dated now. I quote: ‘Half the population of the world suffer from lack of sufficient food; on the other hand, farmers suffer ruin if they produce “too much food”. Adjust our economic and political systems to let these two evils cancel each other out.’ One trouble is, of course, the half producing plenty live in a different part of the world to those with too little. And while we are today shipping unprecedented quantities of food (for example, about 10% of world cereal production is traded), this really doesn’t get to the heart of the problem. Those with too little food, we would now say, have too little because they are very poor or destitute; with adequate money they could buy food, and there is no major problem in actually producing that food.
622 J . B . M A S O N
-
-1002
Lc 1200- 0 .--
- 8 0 $ ----__ _
-
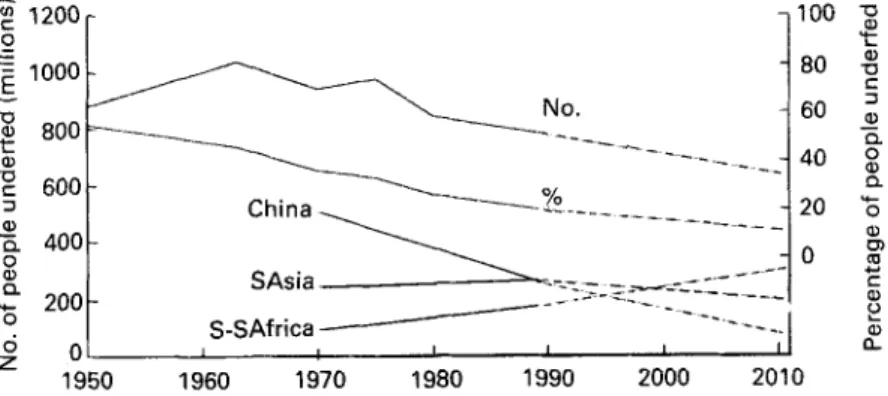
W 1950 1960 1970 1980 1990 2000 2010Fig. 1. People underfed world-wide and by selected regions since 1950, based on the numbers of people
estimated to be consuming inadequate dietary energy (<1.55 BMR). (From FAO, 1977, 1987; Table 1.1 of ACC/SCN, 1992; Table 2 of Food and Agriculture Organization/World Health Organization, 1992; Alexandratos, 1995.)
Boyd Orr recognized this; in a broadcast in 1945 for the Office of War Information he the main cause of lack of food is poverty;
we have the knowledge and resources to produce sufficient food on a health standard for the whole human race.
Either the connection between these two points was not properly made, or the vision was distracted for a long time towards the latter point, with the focus on production.
In terms of results, in terms of progress against hunger, I believe Boyd Orr would not be totally disappointed. Fewer people are probably hungry today than for many years; certainly, the proportion is very much less than in Boyd Orr’s time (Fig. 1). The maximum number of people hungry in world history probably occurred about 1960- 1970. In fact, there was a slight increase in the early 1970% but otherwise the proportion has gone down fast enough to bring the total numbers down despite increasing population (calculated from Food and Agriculture Organization (FAO, 1977); Fourth World Food Survey, quoted in Grigg (1985); Table 2 of Food and Agriculture Organization/World Health Organization (FAO/WHO, 1 9 9 2 ~ ) ; F A 0 data in Table 1.1
of United Nations Administrative Committee on Coordination/Sub-Committee on
Nutrition (1992); Tables 3.1 and 3.4 of Alexandratos (1995). Moreover, famine has receded in most of the world, except, and this is a major exception, in the African wars that affect ever-increasing numbers of people. The end of hunger and malnutrition can be glimpsed, perhaps sometime in the next century, or at least there are credible scenarios for this.
I chose the title for the lecture from more recent history, from the World Food Conference in 1974 (United Nations, 1975), introduced by Henry Kissinger. The phrase ‘within a decade no child will go to bed hungry’ resonates for many of us who became interested in development, health and nutrition in the 1960s; it resonates rather poignantly. It came at a time, for us, with some parallels to the post-war enthusiasm for organizing the United Nations (UN), and with echoes of the UN Declaration of Human Rights and other great statements. I don’t believe it was received cynically at the time, made four points, the last two of which were as follows:
L O R D B O Y D O R R M E M O R I A L L E C T U R E 623
nor indeed that it was said insincerely. We were perhaps nai’ve, however. The full text of this statement from the World Food Conference (United Nations, 1975), is:
“How long would it take to reach the goals which the Conference had set? The answer would depend on the actions of Governments. Participants in the Conference should remember that the resolve that they had taken that “within a decade no child will go to bed hungry, that no family will fear for its next day’s bread, and that no human being’s future and capacities will be stunted by malnutrition” was a solemn pledge of the entire international community. History would take that pledge as a yardstick for judging the adequacy of the policies framed and the action taken.’
I want to be presumptuous enough to take this seriously, as a starting point. Four
questions can provide us with some structure. First, why say it?
Second, what actually happened, in the 21 years since then, until the child came of age?
Third, what have we learned?
And fourth, and most important, what would it take to make a similar statement today, and actually mean it?
W H Y S A Y IT?
This statement ‘no child will go to bed hungry’, was one of the first goals set for nutrition. Since then we have become more familiar with the setting of goals, recently at the World Summit for Children (WSC; United Nations, 1990) and at the International Conference
on Nutrition (FAO/WHO, 19926). I think these have some benefit, and I will come back to them.
The early 1970s had seen devastating famines, in the Horn of Africa and in the Sahel. The world was becoming deeply conscious of their awful effects on nutrition of families. We have become even more conscious of the long-term impact on mothers and children since then, but widespread reporting and television images were stirring many conscien- ces. This was also the time when many things seemed possible; the renaissance of the 1960s lingered on. The reasons for proclaiming ambitious goals also involved a short-run (as it turned out) food supply shortage, resurrecting the ghost of Malthus, although I maintain that this was a serious misconception with repercussions to this day. We should not forget that the nutrition problem at that time was also seen as a world shortfall in supply of protein. I would like to briefly explain why I think a perception of ‘the world food problem’ is seriously misleading.
‘The world food problem’
Much more harm than good has been achieved by insistence on ‘the world food problem’.
There is no such single thing. There are plenty of food problems in the world (McCalla, 1994), just as there are health problems, nutrition problems, etc. But the idea that there is one problem, moreover that it is huge, getting worse, and may one day kill us all off, is not in my view either true or helpful.
I want to briefly divert onto thin ice and criticize Malthus. In preparing for this talk I consulted the book People, Resources and Food by Blaxter (Blaxter, 1986). He re-states Malthus’ original hypothesis that ‘Population will grow exponentially, but food pro-
624 J. B . M A S O N
I I I I I I I I I I I I J 1 1 1 1 , 1 1 1 J I , , , , I , , , , , , , , I ,
20!b'52'54'56r58'60 '62 '64'66'68'70'72'74 '76'78'80'82'84'86'88"90"~2 Year
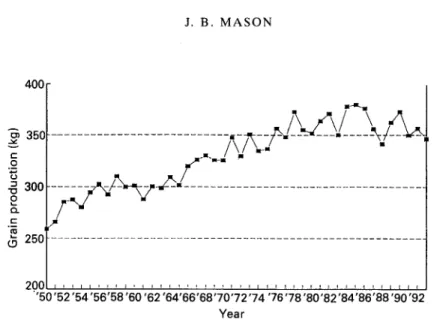
Fig. 2. World grain production per person, 1950-1993. (From Food and Agriculture Organization, 1992b, 1993.)
duction only arithmetically'. He lays out clearly the well-understood reasons why a population has a tendency to grow logarithmically. I could not find, mathematically or otherwise, justification for why food production should only grow linearly; after all, until land availability becomes a constraint, the main input to production in poor countries is labour, therefore you would tend to think that production would, for a time, follow population. Indeed, this is what actually happened during most of the time since the 1940s (see Fig. 2; discussed later). I finally found that I was not alone in my scepticism; Blaxter (1986) quotes Engels, from 1844, as saying 'Has it been proved that the productivity of the land increases in arithmetical progression? The extent of land is limited, that is perfectly true, but the labour power to be employed on this area increases along with population. Even if we assume that the increase in yield due to this increase does not always rise in proportion to the labour, there remains a third element, which the economists, however, never consider important, namely science, the progress of which is just as unceasing and at least as rapid as that of population
. .
.'.
We have been worried that Malthus might turn out to be right in practice; but he doesn't even seem to have had a solid theory! As we all know, there are limits to growth, but we are not there yet. Most scenarios envisage the world accommodating ten billion people, albeit with some important changes in life-styles. Worrying too much about the eventual global picture can get in the way of taking concrete steps to deal with the definable problems immediately.As shown in Fig. 2, the global slow-down of the early 1970s was short-lived, and world
grain production per person rose to more than 350 kg/head per year by about 1980. A flat graph indicates keeping up with the population. In interpreting this, bear in mind that human cereal requirements are about 180 kg/head per year, off the bottom of this graph; the panic in the early 1970s was that stocks were down, and 2 years in a 3-year period had had particularly bad harvests.
More than half the world's grain production is used for animal feed. The flattening (in per capita terms) since around the mid 1970s may indicate meeting the demand for food,
L O R D B O Y D O R R M E M O R I A L L E C T U R E 625
particularly in the light of recession during the 1980s. Given stable food prices, which are projected to continue, it seems alarmist to interpret this continued paralleling of production with population growth as a sign of impending generalized food crises.
That there are serious food problems in the world, some worsening, is without doubt. But these are much more easily understood in specific terms. For example, one estimate (Pinstrup-Andersen, 1994) is that by the year 2000, the difference between economic demand for food in Sub-Saharan Africa and production there will be about SO million MT of grain equivalent, compared with about fourteen million MT in the early 1990s; and that this will rise (according to the World Bank) to 2.50 million MT by the year 2020 (McCalla, 1994). Clearly there is a potential major problem here, concerning the ability of African countries to pay a huge import bill, the availability of food aid, and the sheer physical volume of trade involved. This prospect needs to be urgently addressed, but it is somewhat different from the global Malthusian crisis sometimes invoked by ‘the world food problem’.
W H A T H A P P E N E D ?
What happened in the 21 years since 1974? One result we have just seen is that food production recovered, and today there is certainly adequate food overall in the world. We saw previously (Fig. 1) that the percentage of people estimated to be getting inadequate food energy, aside from a blip in the early 1970s, fell rapidly up to the present time; rapidly enough that the numbers estimated to be inadequately fed also fell. There were major differences between different parts of the world, however (for selected regions, see Fig. 1). Much of the improvement came in China, but with important improvements also in South Asia (which in terms of population is dominated by India), and more rapidly still in South East Asia. Sub-Saharan Africa, in contrast, showed no improvement or deterioration in this indicator, staying at about the 3540% level, where
250
-
UI c 0.-
- = 200 E m a~ 150 I c f .-2
aI -0 c 31 c 100 E E -c U Y- 50 0 0 z .- 0 100 2 80‘g
(5, L aI -0 ‘ C 3 60 c E 9 402
.-
c 0 a, c 20:
z
aI II 0 1960 1970 1980 1990 2000 201 0Fig. 3. Children underweight since 1965, based on the numbers and percentage of children 0-5 years, <-2.0 SD
of the weight-for-age National Centre for Health Statistics standards (World Health Organization, 1983) with projections 1990-2010 (1, worst case; 2, average; 3, best case). ICN, International Conference on Nutrition. (From ACC/SCN, 1992.)
626 J. B . M A S O N C 7 0 -
-
.- c r m 60- .-$
50- L al U5
40- Lc 30- m5
20-a"
10- YAsian countries had been about 1970 (Fig. 1.7 of ACC/SCN, 1992). This indicator from FAO, of people underfed, represents an estimate of those consuming not enough food energy on average over the course of 1 year to maintain body weight and productive activity (FAO, 1992a; Fig. 2 from FAO/WHO, 1992a). This estimate provides the number widely quoted, of about 800 million people in 1990. It is probably a reasonable estimate of those people who have some experience of inadequate food, often seasonal, in their lives. It is not a measure of hunger itself, indeed we have no measure of hunger. By far the most direct measure of malnutrition, and one that has come to be widely available and accepted, is the prevalence of underweight children. This is the indicator used here as the main measure of problems and progress from now on. If we now look at the trends in children underweight over the last 30 years (Fig. 3), we can see that the prevalence has again been falling, but not fast enough in this case to offset the growth in population; therefore, the numbers of underweight children are now approaching 200 million (de Onis ef al. 1993; ACC/SCN, 1993). Fig. 3 also shows possible projections, based on historical trends. Only the most optimistic of these projections shows the total number of underweight children peaking, sometime about now. We will come back to goals and projections later (see p. 635).
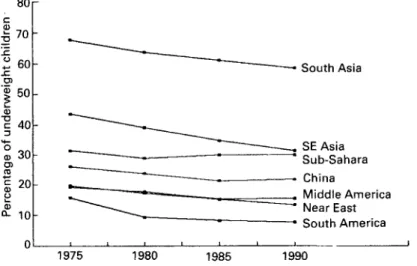
The rates of improvement in prevalences of underweight children by region are shown in Fig. 4, and here it is quite striking that the rates of change in percentage points (pp) per year tend to be rather similar by region, with the exception again of Sub-Saharan Africa. This and other considerations have led to the use of the measure of progress being reduction in pp per year. An average to good rate is -1 pp per year. For 30%
prevalence, this gets rid of the problem in 30 years. This also illustrates that the problems are particularly severe in South Asia, which has nearly twice the prevalence of anywhere else, and in Sub-Saharan Africa where there is no improvement or possibly deterio- ration. South East Asia still has widespread problems, but is improving fast.
While underweight children have been the focus of much attention, it is also recognized that adults, and particularly adult women, suffer from malnutrition. While this is important in terms of maternal nutrition and effects on future generations, it also
8or
South Asia SE Asia Sub-Sahara China Middle America Near East South America 04
,
1975 1980 1985 1990L O R D B O Y D O R R M E M O R I A L L E C T U R E .. 5 .- c 3
[
40- 3 a, .c 627South South East
Asia Asia
Sub-
Saharan Africa
Fig. 5. Percentage of 15-49-year-old women with a low BMI (<18.5) In the 1980s. (From ACC/SCN. 1992.) represents a major suffering on the part of individual women themselves; here the prevalence of thinness, measured by BMI, is shown in adult women (Fig. 5).
Partly for reasons of economy, I am mainly dealing with general malnutrition here, previously referred to as protein-energy malnutrition. However, deficiencies in three micronutrients in particular are well known to be widespread, in vitamin A , Fe, and iodine. In fact, as the epidemiology of malnutrition becomes better understood, the observed extent of these deficiencies increases. I will emphasize two problems very briefly. The estimates are that 0-5 million young children, including infants, go blind each year from vitamin A deficiency, of whom about two-thirds die within a few months of going blind, i.e. about equivalent to nearly all the children born in Great Britain. The deficiency is widespread throughout the tropics. In some parts of Africa average availabilities of vitamin A and its precursors in the diet are so low that some deficiency is almost inevitable. Fe-deficiency anaemia is the commonest deficiency in the world, and in fact is one nutrition problem where the underlying trend is possibly of deterioration (Fig. 6). Here we can see that the prevalence of anaemia in adult women in South Asia is already estimated to be above 60%, and about 50% in Sub-Saharan Africa. The signs from the available data are that the prevalence is deteriorating, and this seems to be related to dietary changes, particularly to a reduction in the production and consumption of pulses, for example in South Asia (ACC/SCN, 1992).
The people most vulnerable to malnutrition in the world are the refugee and displaced populations, especially in Africa. In Africa alone, these amount to about twenty million people, whose mortality rates and levels of malnutrition are many times higher than anywhere else. Mainly, people are displaced because of wars; in Africa last year there were at least nine, all internal. In fact the Red Cross estimates that there were up to seventeen wars per year in Africa in the period 1990-1994 (International Federation of Red Cross and Red Crescent Societies, 1995). The situation is particularly tragic, because even when the people affected become accessible to emergency assistance, the mortality and malnutrition can still continue for far longer than could be prevented (Toole & Waldman, 1990). Fig. 7 shows estimates from reports o r surveys from relief camps during the last year or so, and summarizes both the extraordinarily high mortality rates (about 0-3/10 000 per d would be normal, so we are seeing up to fifty times normal
628 0 80
Y
-
2
a, Q-
60E
406
rn C m 20 0, m m C c Q, 0 J. B . M A S O N --
-
-
" " " " " " " " '.
S u b - S a h a r a n 2Fig. 6. Trends in anaemia, 1977-1987, among non-pregnant adult women aged 1 5 4 9 years (haemoglobin (Hb) 4 2 0 gI1). (From ACCISCN, 1992.)
death rates) and the high levels of wasting (about 5-10% being the highest normally seen, except in crises); there is a clear relationship between these two factors. The twenty million people so affected would amount to a medium-sized country in Africa (e.g. the size of Kenya or Tanzania), but totally destitute, and with depressing prospects. We have referred to the 'refugee nation' as far and away the poorest in the world (ACC/SCN, 1991).
On the other hand, it must be stressed that there are important success stories where situations are brought under control; from Somalia for a while after the troops moved in, to Mozambique where 1.5 million people were successfully sustained and resettled, which United Nations High Commission for
Africa ever. Indeed, the massive problem
Refugees calls the largest resettlement in of Rwandan refugees was quite rapidly
10-
-
-0 a, Q 0 0 0 0 L Wasting (%)Fig. 7. Wasting v . mortality in refugees and displaced populations in Africa. Log CMR = A
+
B (log wasting), where CMR is crude mortality rate, A is -2.05 (t-8.78, P<0.000), B is 0.875 (t 10.6, P<0.000); R2 0.59, n 80. (From ACCISCN, 1993, 1994; Refugee Nutrition Information System, 1995.)L O R D B O Y D O R R M E M O R I A L L E C T U R E 629
brought under control, and by the end of last year nutritional status was relatively adequate, a situation which now may be changing with the reluctance of donors to continue food and other supplies (Refugee Nutrition Information System, 1995).
W H A T H A V E W E L E A R N E D ?
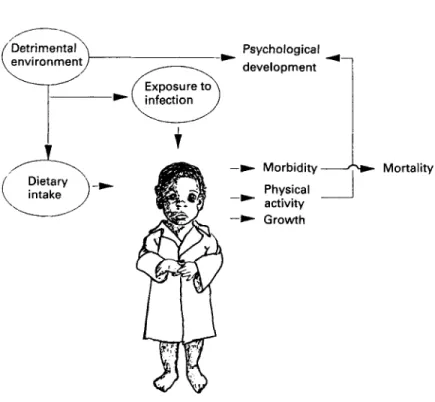
Let’s turn to the lessons from the last 21 years. What have we learned? Let us look first at the indicator used, the underweight child. We now understand well the mechanisms by which dietary intake and exposure to infection lead to increased morbidity and mortality, to lowered physical activity and psychological development, and to reduced growth in the young child; this is illustrated in Fig. 8. Beaton et al. (1990) produced a very useful elaborated diagram of these mechanisms, which illustrates that the mechanisms, importantly, operate through effects on the immune system, even with mild degrees of malnutrition, and through damage to the integrity of the epithelial tissues. It is crucial to note from Fig. 8 that the different outcomes are correlated with each other, but d o not necessarily share causal pathways. Child underweight is an indicator both of outcomes, such as health and survival, and of proximal causes, such as dietary intake and exposure to infection.
The prevalence of underweight children, as an indicator, has two connected, some- what distinct meanings. It reflects a real problem in children themselves, malnutrition representing suffering and a risk for health, survival and development of the child; but second, it provides a readily-understood indicator of nutrition and well-being in society. When children are stunted or wasted and miserable something must be very wrong; when children are growing well and thriving, things can’t be too bad.
We also have a better understanding of the synergism between malnutrition and infection, although this was first described by Scrimshaw et af. (1968). The interaction
between malnutrition and infection is perhaps best seen as a spiral (Fig. 9) whereby the child of normal weight who suffers from infection may become mildly underweight, which makes it vulnerable to a worse infection, in turn increasing the degree of underweight, and so on down. If the infections are too frequent, or nutrition is inadequate, this spiral through time leads to more and more severe infection, and contributes very considerably to infant and young child mortality. The balance, the way back out of the spiral, is better nutrition during sickness, recovery, and in health. This is of crucial importance in looking at the role of nutrition in the overall burden of disease. This synergism means that there is a multiplicative effect between exposure to malnutrition and to infection, and very substantial dividends in terms of reducing the burden of disease would be expected from improving nutrition. An early estimate is that 23% of the global burden of disease would be removed by eliminating malnutrition largely through reducing infant and child mortality from infectious disease (Mason et al. 19966). Indeed, the nutrition community has not yet made nearly enough of the importance of nutrition in terms of improving public health.
We now have a much clearer idea as to why nutrition improves. A useful framework in understanding the trends is to look first at the effects of economic growth, and other long-term underlying factors such as literacy and fertility; second, at factors upon which governments can have a direct influence, and which profoundly affect nutrition, such as expenditures on health and education; finally, there are direct nutrition programmes that under many circumstances now do appear to be effective, and represent important opportunities. I will use this framework for the following discussion.
630 J . B . M A S O N
Fig. 8. Environmental effects on the child. (From ACC/SCN, 1990.)
<-Better nutrition
-
Time b
LORD B O Y D O R R MEMORIAL LECTURE a, C m v) -3 63 1
2
-*
\
-6 -4 -2 0 2 4 6 8 vEconomic growth (GDPkapita, % per year)
Fig. 10. Change in underweight prevalence (PREVRATE) v. economic growth rate (GDPRATE). PREVRATE = -0.298 - 0.179 GDPRATE - 0.0315 GDPRATE’, RZ 0.56 F 24.9 n 42,
(P=0.22) (P=O.Ol)
(From ACCISCN, 1994.)
Fig. 10 shows the ecomomic growth rate in % per year
v.
the change in the prevalence in underweight children in terms of pp per year. The time periods vary, being determined by survey results. The fit is reasonable, and the quadratic equation shown is probably the best for these data. The two fast-growing countries are Thailand and Vietnam, and in general we are seeing most countries growing reasonably well, showing a reduction in malnutrition of about 1 pp per year, or more. One point worth noting is that even at zero economic growth the majority of countries show some improvement. This is good news indeed, if true, because it is a sort of ratchet effect; in good economic times nutrition may improve, but when the economy slows down, it doesn’t fall back to where it was. Moreover, if the relationship is really non-linear, this has important implications for possible acceleration of nutritional rates (ACCISCN, 1994; Mason el al. 1995).One of the most useful outputs from these type of data is the deviation from the average. Those countries significantly below the line in Fig. 10 are those showing a rate of improvement more than would be expected from economic growth. Often, these are the countries expected; Sri Lanka, Zimbabwe, Jamaica, Indonesia, and others that we know are success stories in terms of nutrition are some of these (for details, see Fig. 2 of
ACC/SCN, 1994). But understanding why this improvement took place has crucial implication for future policies elsewhere. A next stage of analysis, which we have only just begun, is to look at these deviations from the average (residuals) in association with likely explanations such as investments in health and education. In fact, even with the crude variable of percentage of government budget on health and education, some association is apparent.
We can learn from policies and programmes especially in South East Asia. These included effective community-level programmes, with high coverage reaching the
632 J. B . M A S O N Y r a, a, zl 3 a, rn C a, a, m .-
2
m E n c Quarter Year 40-
35-
30 l 1 I I I I l 1 I 1 I 1 I I 1 1 . . 2 3 4 1 2 3 4 1 2 3 4 1 2 3 4 1 2 1984I
1985I
1986I
1987I
1988Fig. 11. Percentage of underweight children in the Iringa region of Tanzania, 1984-1988, based on weight-for-age <80% of the Harvard weight standard (Jelliffe, 1966). pp, Percentage points. (From United Nations International Children’s Emergency Fund, 1989.)
poorest areas. In Africa too there have been successes, of which one of the best known is in Iringa in Tanzania (Fig. 11). In 1984, most of the villages in the Iringa region, with UNICEF assistance, adopted community-based activities aimed at nutrition improve- ment (UNICEF, 1989). These had village-level monitoring of children’s growth, activities aimed at improving, for example, household food availability, water and sanitation, access to health care, child feeding and immunization. All these are conventional activities known to improve nutrition, but with the difference that the programme was owned and organized by the communities themselves. As can be seen in
Fig. 11, a rapid improvement in the prevalence of underweight children was seen over the 1.5 years, then levelling out, but still improving at a healthy rate of around 1 pp per year. This experience was repeated in many other regions of Tanzania, which all showed a similar pattern of rapid improvement followed by slower, but still steady, reduction in prevalence. At the UN Sub-committee on Nutrition we undertook a series of case studies in the last 3 or 4 years looking at why nutrition has improved in a number of countries (Gillespie & Mason, 1993). In most cases we concluded that a substantial part of the improved nutrition could be accounted for by village programmes rather like those organized in Tanzania. The conclusions are summarized in Table 1. Sorting out the effects of programmes from other less-direct influences is quite complicated, because those countries doing well economically also tend to have effective nutrition pro- grammes, for example Thailand and Indonesia. However, although further research and analysis is necessary, there seems to be increasing consensus that among the important ways of improving nutrition the fostering of community-level programmes is of high priority.
I think this has political importance too for nutrition. I believe it was a serious mistake soon after the World Food Conference, 20 years ago, for much of the nutrition community to bow out of the business of directly involving itself in nutrition activities.
L O R D B O Y D O R R M E M O R I A L L E C T U R E 633
Table 1. Case studies of ‘why nutrition improves’ (from Gillespie & Mason, 1993)
Underweight prevalence rates (pp/year) Country Regional
rate average Residual Hypothesis
Brazil 1975-1989 -0.8 -0.3 -0.2 Fertility, health, social progress, feeding Egypt 1978-1988 -0.7 -0.4 +0.7 Diarrhoea1 disease control, food subsidy
India 1977-1990 -0.7 -0.6 +0.4 (Low coverage)
Indonesia 19861989 -1.7 -0.7 -0.1 Village programmes
Tanzania 1987-1992 -1.0 0 -0.1 Village programmes
Thailand 1982-1990 -2.9 -0.7 4 . 3 Village programmes, BMN, etc. Zimbabwe 1984-1988 -1.0 0 -0.8 Village health and nutrition
programmes
programmes
pp, Percentage points; BMN, Basic Minimum Needs Programme.
The view that improvement of nutrition was everybody else’s business but theirs (those in economics, in health, in education, etc) effectively dealt the nutritionists out of the policy arena. Nutritionists destroyed their own influence. Now, of course, I am not arguing that nutritionists should reassert themselves for the sake of their profession. I am arguing that because there are in fact effective nutrition interventions, even if they are by no means all that is needed, nutritionists should re-engage, and get back into the business of actually helping, themselves, to improve nutrition.
I would like to mention other areas where knowledge of nutrition has moved on, all of which tend to show that the importance of nutrition has been underestimated, rather than overestimated. The long-term effects of early malnutrition on educability have been demonstrated, particularly by the work of Martorell, Pollitt, and others in Guatemala (Pollitt et al. 1993). Here it was shown that stunting, up to the age of 3 years, was correlated with educational achievement at age 18 years or so; moreover, this tended to respond to early supplementation, and was probably a direct long-term effect of early malnutrition.
The now well-known impact of vitamin A supplementation on child mortality in vitamin A-deficient areas, an average of 23% reduction in the mortality, starting with the observation by Sommer et al. (1986) in Indonesia, since confirmed and meta-analysed by Beaton et al. (1993), is of major importance. It is worth noting that many of the effects of nutrition on health or mortality are estimated to be rather high, of the order of 20% or more. The effects of even mild malnutrition on immunity, for example as summarized by Chandra (1991), now go a long way to both explaining and making credible some of these large-scale effects. Similarly, Pelletier (1994) and Pelletier et al. ( 1 9 9 4 4 have shown that mild malnutrition contributes to probably more child deaths than severe malnutrition.
Other long-term effects of malnutrition are likely to become increasingly recognized as important. Here I’d like to refer to some ‘straws in the wind’. The first of these is the probable importance of inter-generational effects. Here I mean that low birth weight gives rise to small children who grow to be small mothers, who then give birth to underweight babies again. How far this is reversible by better nutrition during childhood and adolescence is not yet clear, but it probably is to a limited extent (for example
634 J. B . M A S O N
Martorell ef al. 1994). Nevertheless, there is a defacto intergenerational effect which has enormous importance; eliminate low birth weight for a generation, and you might eliminate underweight for all time. Perhaps even more important is the emerging body of evidence that intrauterine and early childhood malnutrition can cause long-term damage that increases risk of chronic disease (cardiovascular, diabetes, hypertension) in much later life (Hales ef al. 1991; Barker et al. 1993). Credible mechanisms are now being put forward from animal experiments (Hoet, 1995). If this straw in the wind turns out to be true, it will not only increase our understanding of chronic diseases, which are probably
as common or more so in poor people as in the better off, but it also gives rise to a double jeopardy, in countries where the level of living is improving fast, going from poverty to affluence within a generation. Here a double risk is from being a low-birth-weight baby then becoming an obese adult.
I would like to mention two more effects. First, the stress given by Golden (1991,
1995) and others to different actions of different micronutrients (type 1 and type 2, in Golden’s (1995) terminology) may be of very considerable importance in understanding better what causes malnutrition, and its consequences. Second, intriguing findings relating vitamin A status to vertical human immunodeficiency virus transmission (Semba et al. 1994) may show vitamin A itself, and possibly other micronutrients, to be of importance in acquired immune deficiency syndrome.
Finally, the area that continues to teach us lessons is that of breast-feeding. As research continues, the benefits of breast-feeding in the long term and the short term are always strengthened. Tragically, the world has still been unable to adequately reduce the extent of bottle feeding, despite the well-known benefits of breast-feeding for infant and child health and survival.
I want to suggest a new title for activities aimed at improving the nutrition of
populations. We talk about public policy, public action, and public health. Maybe the time has come to fly the kite of talking about public nutrition. In a letter recently submitted for publication (Mason et al. 1996a) we suggest that public nutrition would
cover:
public policies relevant to nutrition in several sectors, for example economic develop- ment, health. agriculture, education;
programmes or interventions: their design, planning, management, and evaluation; advocacy and linkage with, for example, population and environmental concerns; community nutrition, community-based programmes (including use of growth moni- toring);
understanding and raising awareness of the nature, causes and consequences of nutrition problems in society;
epidemiology, including monitoring, surveillance, and evaluation; public education, especially nutrition education for behavioural change; population nutritional requirements and dietary guidelines;
timely warning and prevention or mitigation of emergencies, including use of emergency food aid.
I would like to suggest that these are the topics that many nutritionists should be engaged in. I believe that the topics should form an important part of education and
training in nutrition, provide useful headings for the necessary research, and be the areas in which public policy makers should be engaged. This idea may help to build on some of the lessons we have learned in the last two decades or so.
L O R D B O Y D O R R M E M O R I A L L E C T U R E 635
W H A T W O U L D IT T A K E T O A C H I E V E A M B I T I O U S G O A L S T O D A Y ?
The idea that ‘Within a decade no child will go to bed hungry’ was an early example of what has become a useful habit, the attempt to focus attention by setting quantitative goals. Detailed goals were set at the World Summit for Children in 1990 (United Nations, 1990), reiterated at the International Conference on Nutrition in 1992 ( F A O N H O , 19926). This conference, sponsored by F A 0 and World Health Organiz- ation, laid out a very broad agenda for nutrition improvement. It included specific endorsement of the earlier goals, which cover most aspects of nutrition, and importantly included as a goal for the year 2000:
‘Reduction in severe, as well as moderate malnutrition among under-five children, by half of 1990 levels’.
So we can also ask the question, what would it take to reach this goal, which is less
dramatic than the World Food Conference’s, although not necessarily much more realistic?
Using the indicator of underweight children, the projections are shown in Fig. 3. This uses the historical best and worst rates of prevalence change (over 5-year periods) to project possible trends over 20 years from 1990. This picture is more worrying than that of food consumption. Only if the best trends of the last 20 years are repeated are we not going to see a continuing rise in the numbers of underweight children, up to 200 million or more. We have to do pretty well to even make the numbers go through a maximum. The challenge is much greater still if we look at the goals of the International Conference on Nutrition, also shown in Fig. 3. A really important turn-around is going to be needed. The experiences of South East Asia, or Iringa and other regions in Tanzania, or Zimbabwe in the 1980s, are going to need to be widely repeated if we are to begin to meet these goals.
What would it take? One answer has to do with resources. The external assistance resources available for nutrition activities are relatively minor (world-wide of the order of $150 million per year (5-year average, 1987-1991; Karlen & Mason, 1995); for Sub-Saharan Africa, for example, external resources for nutrition amount to $1-2 per malnourished child). But the level of funding for making an impact on the problem, perhaps of the order of $1-$2 billion per year in external assistance (for some estimates of WSC goals see Parker & Jasperson, 1994), is not necessarily as unattainable as might be thought. As UNICEF (1995) and many others have pointed out, this is probably only a few minutes worth of world armament expenditure, a few dozen puffs worth of world tobacco consumption, and less than two or three stealth bombers. In the UK the total aid budget amounts to only 7% of military expenditure (Actionaid, 1994). In fact, the New
York Times (International Herald Tribune, 1995) noted the Pentagon’s budget for 1996, of $246.7 billion, was actually $7 billion more than the Pentagon had requested! So I don’t believe that we have any right to be put off by the cost. Were there a will, there would surely be a way.
What would it take? We need to bear in mind the potential policies having an impact on nutrition, and the influence that nutrition goals can actually have on these policies, and the trade-offs involved (Gillespie & Mason, 1991). For example, enlightened and successful economic policies may have a major impact, but nutrition itself does not usually influence decisions on these. Education, especially for women, literacy, and lowered fertility probably all underpin long-term nutrition improvement; here nutrition goals may be closer, and nutrition considerations more useful and influential. But it is
636 J. B . M A S O N
when we come to specific nutrition activities, in health services, schools, and through community-based programmes, that nutrition has a clear influence; for this reason, these should take some priority, even if they may mostly affect immediate rather than basic causes of malnutrition.
We should not tire in our advocacy for more effective and nutrition-relevant policies, in economic development, in education especially for women, and elsewhere. However, I would like to focus on direct nutrition activities, especially in health services, and on community-based programmes, since in these areas we can be reasonably sure of having an influence.
Nutrition in health services
Nutrition in health services represents a golden opportunity that is still being missed. There are clear, incremental, not very costly, interventions that the health services could adopt much more widely, which would have a supportive and generally cumulative impact on nutrition. They include the newly-recognized importance of ‘care’ (UNICEF, 1990; Longhurst & Tomkins, 1995).
Within health services, important nutritional aspects in prevention of disease include promoting the following:
exclusive breast-feeding for 4-6 months, with continued breast-feeding into second year of life;
satisfactory quality and intake of complementary foods; vitamin A supplementation;
protection of women’s nutrition, pre-pregnancy and during pregnancy; Fe supplementation;
promoting adequate care.
In management of disease, the following are relevant: continued breast-feeding during infections;
maintained diet during infection (especially persistent diarrhoea) and for recovery (catch-up);
vitamin A in measles and diarrhoea; other micronutrients; oral rehydration;
control of intestinal parasites;
effective care during sickness and recovery.
Community-based nutrition programmes
Community-based nutrition programmes are nothing really new in terms of activities. We d o not need to keep re-inventing wheels, we need to use them better. There is now reasonable evidence (Iringa was an example) that many of the conventional activities of nutrition, if properly owned and supported by communities, when sustained and carried out, actually work. This does not mean that central government should say ‘over to you’ to communities; on the contrary, crucial support in terms of supplies, training, and information is needed from the centre. Community-based programmes require com- munity ownership, adequate population coverage, targetting, and central support (e.g. supplies, training, information). The activities and interventions relevant to nutrition may include: nutrition and health education; local food production often with sup-
L O R D BOYD O R R M E M O R I A L L E C T U R E 637
plementary feeding; household food security (e.g. seasonal); micronutrients; growth monitoring; maternal nutrition; health referral; water and sanitation; support for improved care.
Not all these activities can be undertaken in all countries. This spectrum of possibilities, which tends to become progressively more feasible with development, can be seen as ‘building blocks’ for improved nutrition:
immunization; medical treatment; water and sanitation; family planning;
nutrition in health services, schools;
community-based programmes including nutrition; social welfare.
This means that with little infrastructure and resources, the poorest countries may have to start with attention to basics like immunization and urgent medical treatment. Their next priorities may be water and sanitation, and family planning services. It simply may not be possible to include nutrition at the poorest levels of administrative development. Fairly quickly though, it does become possible to begin to include some nutrition activities in health services, and in schools. We should remember that development does take place; for example, a large proportion of children even in the poorest countries now go to school. As communities become more organized and as political and administrative systems become more democratic opportunities arise for community-based programmes. Community-based programmes are unlikely to be only or even primarily for nutrition, although nutrition may provide a first stimulus. But nutrition should certainly be a part of them, and its improvement recognized as an outcome. We should not worry that a programme begun with nutrition objectives looks very like a community development programme. What is important, is that these activities get moving.
Finally, in middle-income countries, social security and welfare systems are part of the eventual solution to malnutrition. We nutritionists have a responsibility for moving towards this eventual solution to malnutrition. Professionals in health work towards solving health problems, in development towards alleviating poverty, and nutritionists must work towards solving malnutrition. In the 1960s and 1970s, about the time of the World Food Conference, I believe there was the beginning of a movement. I was not part of political movements at that time, but I did, albeit briefly and incompetently, get involved with the Freedom from Hunger Campaign. Like many others, I did one or two things for Oxfam and other Non-Government Organizations, and with stars in my eyes thought that through the UN we might change the world. Well, that like the World Food Conference ambitions, was probably nayve; but it was not wrong-headed. And we should keep trying.
My colleague Urban Jonsson from UNICEF has called for a movement to abolish hunger and malnutrition (Jonsson, 1991). A t least we, whose role in life is to work for nutrition, should see ourselves as part of such a movement, a movement which is in part political. It means that the nutrition community has to involve itself with lobbying for correct policies, for adequate resources, for public understanding, to deal with this problem. It means we must build on success not failure, it means that we should re-establish confidence. It is possible to make progress, why should we keep interpreting the experience of the last 21 years as disappointing? In many ways, it has been a period of
638 J. B . M A S O N
the most stunning success in human history; infant mortality rates have tumbled, poverty has declined (as a percentage; Tabatabai, 1995), there are fewer people underfed now than for many years, certainly a lower proportion than in living memory, and all this in the face of run-away population growth, pressure on resources, and many other problems. We do actually have one of the potentially ‘good news’ stories, which we need to build on to make even better news. We must communicate better the idea that hunger and malnutrition need not always be with us. They are not intractable problems that a large part of the world must always suffer. I believe we must emphasize the ‘do-ability’ of getting rid of them, and stress the huge benefits to the human condition that would ensue. Jim Grant, the patron saint of ‘do-ability’, called the solution to such problems ‘the unfinished business of the 20th century’ (UNICEF, 1995). The children of the child
who went to bed hungry in the 1970s need not do so in the 21st century.
The author is grateful to Mr Duncan, the archivist of the Rowett Research Institute, for providing interesting material about Lord Boyd Orr.
R E F E R E N C E S
ACC/SCN (1990). Measuring children. The uses of anthropometry. SCN News 5,8-19. ACClSCN (1991). Some Options for Improving Nutrition in the 1990s. SCN News 7 , Suppl.
ACC/SCN (1992). Second Report on the World Nutrition Situation, Vol. I : Global and Regional Results.
ACC/SCN (1993). Second Report on the World Nutrition Situation, Vol. 2. Country Trends, Methods and ACC/SCN (1994). Update on the Nutrition Situation, 1994. Geneva: ACC/SCN.
Actionaid (1994). The Reality of Aid 94. An Independent Review of International A i d , p. 154. London: Hamlyn.
Alexandratos, N. (editor) (1995). In World Agriculture: Towards 2010. An F A 0 Study. Rome: FAO.
Barker, D. J. P., Gluckman, P. D . , Godfrey, J. M., Harding, J. E., Owens, J. A. & Robinson, J. S. (1993). Fetal nutrition and cardiovascular disease in adult life. Lancet 341,938-941.
Beaton, G., Kelly, J., Martorell, R. & Mason, J. (1990). Appropriate Uses of Anthropomerric Indices in Children. ACCISCN State-of-the-Art Series: Nutrition Policy Discussion Paper no. 7 . Geneva: ACC/SCN.
Beaton, G . H., Martorell, R., Aronson, K. J., Edmonston, B., McCabe, G., Ross, A. C. & Harvey, B. (1993). Effectiveness of Vitamin A Supplementation in the Control of Young Child Morbidity and Mortality in Developing Countries. ACCISCN State-of-the-Art Series, Nutrition Policy Discussion Paper no. 13. Geneva:
ACClSCN .
Blaxter, K. (1986). People, Food and Resources. The R. M . Jones Lectures in the Development of Ideas.
Cambridge: Cambridge University Press.
Calder, R. (1966). Introduction in Boyd Orr, J. (1966). A s I Recall. London: McGibbon & Kee.
Chandra, R. K. (1991). 1990 McCollum Award Lecture. Nutrition and immunity: lessons from the past and
new insights for the future. American Journal ofCIinica1 Nutrition 53,1087-1101.
de Onis, M., Monteiro, C., Akre, J. & Clugston, G. (1993). Worldwide magnitude of protein-energy
malnutrition: an overview from the WHO global database on child growth. W H O Bulletin 71,703-712. F A 0 (1977). The Fourth World Food Survey. F A 0 Statistics Series no. 11, F A 0 Food and Nutrition Series no.
10. Rome: FAO.
F A 0 (1987). The Fifth World Food Survey. Rome: FAO.
F A 0 ( 1 9 9 2 ~ ) . World Food Supplies and Prevalence of Chronic Undernutrition in Developing Regions as
F A 0 (19926). FA0 Agrostat-PC. Population, Production, and Food Balance Sheets Domains. Rome: FAO. F A 0 (1993). The State of Food and Agriculture. Mimeograph. Rome: FAO.
F A 0 (1994). World Food Surveys, Agriculture towards 2010. Rome: FAO.
FAO/WHO (1992a). International Conference on Nutrition: Nutrition and Development - a Global Assessment, FAOlWHO (1992b). International Conference on Nutrition: World Declaration und Plan of Action for
Geneva: ACC/SCN.
Statistics. Geneva: ACC/SCN.
Assessed in 1992. ESS/MISC/1/92. Rome: FAO.
PREPCOM/ICN/92/3. Rome: FAO.
L O R D B O Y D O R R M E M O R I A L L E C T U R E 639
Gillespie, S. & Mason, J. (1991). Nu/rifion-Relevant Actions: Some Experiences from the Eighties and Lessons
for the Nineties. ACCISCN State-of-the-Art Series, Nutrition Policy Discussion Paper no. 10. Geneva: ACC/SCN.
Gillespie, S. & Mason, J . (1993). How Nutrition Improves: A Synfhesis of Findings ,from Reviews of
Nutrition-Relevant Actions in Ten Countries. Background Paper for the ACCISCN Workshops on
Nutrition-Relevanr Acfions in Developing Countries - Recent Lessons. X V IUNS Congress. Adelaide.
Australia. Geneva: ACC/SCN.
Golden, M. (1991). The nature of nutritional deficiency in relation to growth failure and poverty. Acta
Paediarrica Scandinavica 374, Suppl., 95-1 10.
Golden. M. (1995), Specific deficiencies versus growth failure: type I and type I1 nutrients. SCN News 12,
10-14.
Grigg, D. (1985). The World Food Problem. Oxford: Basil Blackwell Ltd.
Hales, C. N., Barker, D. J. P., Clark, P. M. S . , Cox, L. J., Fall, C., Osmond, C. &Winter, P. D. (1991). Fetal and infant growth and impaired glucose tolerance at age 64. British Medical Journal 303, 1019-1022.
Hoet, J. J. (1995). Role of foetal and infant growth and nutrition in causality of CVD and diabetes in later life.
Proceedings of SCN Symposium on Nutrition in the Epidemiology and Prevention of Cardiovascular Disease, Diabetes Mellitus, and Obesity in Developing Countries. Geneva: ACCISCN (In the Press).
International Federation of Red Cross and Red Crescent Societies (1995). World Disasters Report l Y Y 5 .
Geneva: International Federation of Red Cross and Red Crescent Societies.
International Herald Tribune (1995). Overdoing it o n defense. International Herald Tribune 3 July, p. 8.
Neuilly-sur-Seine. France: International Herald Tribune.
Jelliffe, D. B. (1966). The Assessment of the Niitritonal Status of the Community. W H O Monograph Series no.
53. Geneva: WHO.
Jonsson. U. (1991). Community-based development - from a programme towards a movement. SCN News 7, Karlen, H . & Mason, J. (1995). Estimarion of External Resource Flows in Relation to Nutrition. Food and
Nutrition Bulletin (In the Press).
Longhurst, R. & Tomkins, A. (1995). The role of care in nutrition - a neglected essential ingredient. SCN News 12. 1-5.
McCalla. A. F. (1994). Agriculture and Food Needs to 2025: Why We Should Be Concerned. Sir John Crawford
Memorial Lectures. Washington, DC: CGIAR.
Martorell, R., Kettel Khan, L. & Schroeder, D . G . (1994). Reversibility of stunting: epidemiological findings in children from developing countries. European Journal of Clinical Nirtrition 48, Suppl. 1, S45-S47. Mason. J .. Habicht, J. P., Greaves, J. P.. Jonsson. U . . Kevany, J.. Martorell. R. & Rogers. B. ( 1 9 9 6 ~ ) . Public
Nutrition. American Journal of Clinical Nufririon ( I n the Press).
Mason, J . , Johnsson, U. & Csete. J. (1995). Is malnutrition being overcome? Meeting on Overcoming Hunger
in the 1990s. Institute of Nutrition. Thailand. November 1994 (In the Press).
Mason, J.. Musgrove, P., Habicht, J . P. & Watson, F. (19966). Malnutrition as a risk factor in the global burden of disease. In The Burden of Disease [C. J . L. Murray and A. D. Lopez, editors]. Geneva:
WHO/World Bank (In the Press).
Parker. D . & Jespersen, E. (1994). 20120 Mobilizing Resources for Children in the 1990s. UNICEF Smff Working Papers no. 12. New York: UNICEF.
Pelletier. D . (1994). The relationship between child anthropometry and mortality in developing countries: implications for policy, programs and future research. Journal of N~tritioii 124, Suppl., 2047.
Pelletier, D.. Frongillo. E., Schroeder, D. & Habicht, J. P. ( 1 9 9 4 ~ ). A methodology for estimating the contribution of malnutrition to child mortality in developing countries. Journal of Niirrition 124, Suppl..
2106s.
Pelletier, D . . Low, J. W . , Johnson, C. & Msukwa, L. A. H. (1994b). Child anthropometry and mortality i n Malawi: testing for effect modification by age and length of follow-up and confounding by socioeconomic factors. Journal of Nutrition 124, Suppl.. 20828.
Pinstrup-Andersen, P. (1994). World Food Trends and Fiiture Food Security, Food Policy Report. Washington.
DC: IFPRI.
Pollitt, E.. Gorman. K. S . , Engle. P. L., Martorell, R. & Rivera, J. (1993). Early Siipplemenmry Feeding arid Cognirion. Monographs ofthe Society for Research in Child De\.elopment, vol. 58. pp. 1-122. Chicago, Ill: The University of Chicago Press.
Refugee Nutrition Information System (1995). Report on the Ntrrrifioti Sitriariori qf Refugee and Displaced Popirlarioris. 1993-1995. Geneva: ACClSCN.
640 J. B . M A S O N
Scrimshaw, N. S., Taylor, C. E. & Gordon, J. E. (1968). Interactions of Nutrition and Infection. W H O
Monograph Series no. 37. Geneva: WHO.
Semba, R. D., Miotti, P. G., Chiphangwi, J. E., Saah, A. J., Canner, J. K., Dallabetta, G . A. & Hoover, D. R. (1994). Maternal vitamin A deficiency and mother-to-child transmission of HIV-1. Lancet 343, Sommer, A., Djunaedi, E., Loeden, A. A., Tarwotjo, I., West, K., Mele, L. & The ACEH Study Group (1986). Impact of vitamin A supplementation on childhood mortality: a randomized controlled community trial. Lancet i, 1169-1173.
Tabatabai, H. (1995). Poverty and inequality in developing countries: a review of evidence. In The Poverty
Agenda: Trends and Policy Options. Vol. 3, New Approaches to Poverty Analysis and Policy. [G. Rodgers
and R. van der Hoeven, editors]. Geneva: ILO.
Toole, M. & Waldman, R. (1990). Prevention of excess mortality in refugee and displaced populations in developing countries. Journal of the American Medical Association 263, 3296-3302.
United Nations (1975). Report of the World Food Conference, EICONF.65120. New York: UN.
United Nations (1990). World Declaration and Plan of Action. World Summit for Children. New York: UN.
UNICEF (1989). Improving Child Survival and Nutrition: The Joint WHOIUNICEF Nutrition Support
Programme in Iringa, Tanzania. New York: UNICEF.
UNICEF (1990). Strategy for Improved Nutrition of Children and Women in Developing Countries. UNICEF
Policy Review, 1990-1. New York: UNICEF.
UNICEF (1995). The State of The World’s Children, 1995. New York: UNICEF.
World Health Organization (1983). Measuring Change in Nutritional Status. Geneva: WHO. 1593-1597.