Energy Cost of Standing in a Multi-Ethnic
Cohort: Are Energy-Savers a Minority or the
Majority?
Cathrı´ona R. Monnard, Jennifer L. Miles-Chan*
Department of Medicine / Physiology, University of Fribourg, Chemin du Muse´e 5, Fribourg, Switzerland
Abstract
Background
The disease risks associated with sedentary behavior are now firmly established, and con-sequently there is much interest in methods of increasing low-intensity physical activity. In this context, it is a widely held belief that altering posture allocation can modify energy expenditure (EE) to impact upon body weight regulation and health. However, we recently showed the existence of two distinct phenotypes pertaining to the energy cost of standing– with the majority of a Caucasian cohort showing no sustained increase in EE during standing relative to sitting. Here we investigated whether this phenomenon is also observed across a multi-ethnic male cohort.
Objective
To determine the magnitude and time-course of changes in EE and respiratory quotient (RQ) during steady-state standing versus sitting, and to explore inter-individual variability in these responses across 4 ethnic groups (European, Indian, Chinese, African)
Design
Min-by-min monitoring using posture-adapted ventilated-hood indirect calorimetry was con-ducted in 35 healthy, men (20–43 years) during 10 min of steady-state standing versus sit-ting comfortably.
Results
69% of subjects showed little or no increase (<5%) in EE during standing compared to sitting (energy savers). Furthermore, the proportion of energy savers did not significantly differ between ethnic groups, despite ethnic differences in anthropometry; with body weight as the primary predictor of the energy cost of standing maintenance (r2= 0.30, p = 0.001).
Conclusion
Our results indicate that the majority of individuals in a multi-ethnic cohort display a postural energy-saver phenotype. The mechanisms by which the large majority of individuals appear a1111111111 a1111111111 a1111111111 a1111111111 a1111111111 OPEN ACCESS
Citation: Monnard CR, Miles-Chan JL (2017)
Energy Cost of Standing in a Multi-Ethnic Cohort: Are Energy-Savers a Minority or the Majority? PLoS ONE 12(1): e0169478. doi:10.1371/journal. pone.0169478
Editor: Shahrad Taheri, Weill Cornell Medical
College in Qatar, QATAR
Received: August 15, 2016 Accepted: December 16, 2016 Published: January 5, 2017
Copyright:© 2017 Monnard, Miles-Chan. This is an open access article distributed under the terms of theCreative Commons Attribution License, which permits unrestricted use, distribution, and reproduction in any medium, provided the original author and source are credited.
Data Availability Statement: All relevant data are
within the paper and its Supporting Information file.
Funding: The authors received no specific funding
for this work.
Competing Interests: The authors have declared
to maintain sitting and standing postures at the same energetic cost remains to be eluci-dated but is of considerable importance to our understanding of the spontaneous physical activity compartment of EE and its potential as a target for weight regulation.
Introduction
With growing awareness of the health-related dangers of a modern, sedentary lifestyle there has been increasing interest in methods to increase levels of physical activity. Of particular inter-est is the low-intensity zone of physical activity, which offers a number of advantages over more traditional, moderate-to-vigorous exercise (i.e., fewer limitations due to individual ability [1] or environmental constraint [2], greater compliance [3–5]). Within this zone, increasing the allo-cation of posture to standing rather than sitting is perhaps the most simplistic approach aimed at increasing activity levels. However, investigations of the energy cost of standing versus that of sitting have been equivocal–with reported mean increase in energy expenditure (EE) between the two postures ranging from <1 to >100% [6–8]. In addition to methodological differences, such large discrepancies in study findings may be due to the large inter-individual variability in the energy cost of posture maintenance. Indeed, we have recently demonstrated the existence of distinct phenotypes pertaining to the energy cost of standing–with the majority of a Caucasian cohort showing no sustained increase in EE during standing relative to sitting [9]. However, it remains to be determined whether or not this heterogeneity can also be observed across other ethnic groups.
The observation that individuals may show markedly different EE responses to the same chal-lenge is supported by a number of research papers investigating the energetic cost of standard-ized activities amongst developing and subsistence-level populations [10–14]. In general, these energetic costs are often lower than those observed in more developed countries [12,15,16]. However, such observations are difficult to interpret given large differences in environmental and methodological parameters. Furthermore, comparisons of the energy cost of low-intensity physical activities, such as standing, across ethnic groups, under the same conditions and experi-mental protocol, are limited [11–14], and do not explore inter-individual variability.
Therefore, the aim of the present study was to determine whether or not the overall energy cost of standing versus sitting is comparable, and if the heterogeneity in response persists, when comparing across four ethnic subgroups (European, Chinese, Indian, and African) under identical, well-standardised measurement conditions. Furthermore, given the influence of body size, proportions and composition on EE, the ethnic-specific differences in these vari-ables [17–19], and their reported association with balance and postural sway [20,21], the pres-ent study also sought to investigate the relationship between anthropometry and the energy cost of standing versus sitting in a multi-ethnic group.
Materials and Methods
Subjects
Thirty five young, healthy men participated in the present study, with a mean (± SEM) age of 27± 1 y, weight of 73 ± 2 kg, and body mass index (BMI; in kg/m2) of 23± 1. Subjects were either of European (n = 9), Chinese (mainland China; n = 7), Indian (n = 10), or African (Sub-Saharan; n = 9) origin, and currently living in Switzerland. All subjects were weight-stable, with less than 3% body weight variation in the six months preceding the study. Smokers, claus-trophobic individuals, individuals taking medication, and those with any metabolic disease
were excluded from participating in this study. This sample size was derived using an online power calculator (http://www.statisticalsolutions.net/pssTtest_calc.php), using a one-sided test (as it was expected that any change in EE between sitting and standing would be in the positive direction) based on the data obtained from our previous study [9], an error probably (α) of 0.05 and power (1-β) of 0.80, which indicated a necessary sample size of 6 subjects per group. The study complied with the Declaration of Helsinki and was approved by the Fribourg can-tonal ethical committee; all subjects gave written consent.
Experimental design
Prior to the day of testing, subjects visited the laboratory in order to complete a questionnaire regarding their lifestyle and medical history, and to familiarize themselves with the experimen-tal procedure and equipment. All subjects were requested to avoid physical activity, caffeine, and dietary supplements in the 24h prior to testing. On the day of testing, subjects arrived at the laboratory at 8h00 following a 12h overnight fast. After the subject voided their bladder, body weight, height and sitting height were measured using a mechanical column scale with integrated stadiometer (Seca model 709, Hamburg, Germany). Leg length was calculated as the difference between height and sitting height, with relative leg length subsequently deter-mined as the ratio of leg length to height. Waist (at the umbilicus), thigh, calf, and mid-arm circumferences were measured to the nearest 1 mm using a non-stretch measuring tape according to the methodology of Lohman et al [22]. EE and respiratory quotient (RQ) were measured using the Deltatrac II ventilated hood system (Datex-Ohmeda, Instrumentarium Corp, Helsinki, Finland) adapted for measurement in a variety of postures. As previously described [9], subjects were seated comfortably in a car seat adapted for calorimetric monitor-ing, with metabolic measurement conducted until stabilization of EE for at least 15 min, after half an hour of rest. During this period, the subject was instructed to relax and avoid move-ments. The ventilated hood was then removed and the subject asked to stand relaxed and avoiding movements in front of a wooden frame (supported by a metal base) to which the hood was fixed in a vertical position [9]. This postural transition took a maximum of 2 min, with the measurements of EE and RQ during the transition being excluded from the analysis. A preliminary study showed this to be the length of time required to remove the hood, the sub-ject to change posture, the hood to be replaced, the measurements of EE to equilibrate and the heart rate to stabilize. After transition, EE and RQ were recorded for 10 min. Following a sec-ond transition period, measurements were continued during a further sitting period lasting at least 15 min. In order to reduce boredom and accompanying stress, subjects were permitted to watch a calm movie or a documentary throughout the metabolic measurements.
Data and statistical analysis
All data are presented as Mean± SEM unless otherwise stated. EE phenotype was defined as before [9], using the following criteria:
1. Energy saver: Those who showed little or no change in EE (a rise in EE of <5%) during 10 min standing period relative to sitting.
2. Energy spender: Those who i) increased EE (a rise in EE of >5%) during first 5 min of the 10 min standing period relative to sitting, andii) maintained an elevated EE throughout the entire 10 min standing period (drop in EE during second 5 min <30% of the rise in EE dur-ing first 5 of standdur-ing period).
The 5% cut-off point used in these criteria is based on data from a previous study [9], which found that energy savers had a significantly lower mean rise in EE than the energy spenders
(EE rise <5% vs 11.5%, respectively; p<0.001). Furthermore, as the measurement error of the Deltatrac II indirect calorimeter in terms of VO2and VCO2has been shown to be <3% [23,24], and within-subject coefficient of variability in resting EE measured within our lab is typically around 2% (with a standard deviation of 0.1 kJ/min), this cut-off value also well exceeds that which can be attributed to measurement error and intra-individual variability.
The statistical treatment of data, by Kruskal-Wallis one-way non-parametric ANOVA fol-lowed by all-pairwise comparisons, Pearson correlation, Fisher’s exact test, or linear regres-sion, was performed using the computer software STATISTIX 8 (Analytical Software, St. Paul, Minnesota, USA).
Results
Energy expenditure (EE) phenotyping
When all subjects were pooled, EE was higher during standing relative to sitting (4.60± 0.12 vs 4.31± 0.09 kJ/min; p<0.001). The average increase in EE integrated across the 10 min stand-ing period was +6.5± 1.1% (0.28 ± 0.04 kJ/min), but a large range of responses was observed: -2.9% to +21.8% (-0.8 to 0.74 kJ/min).
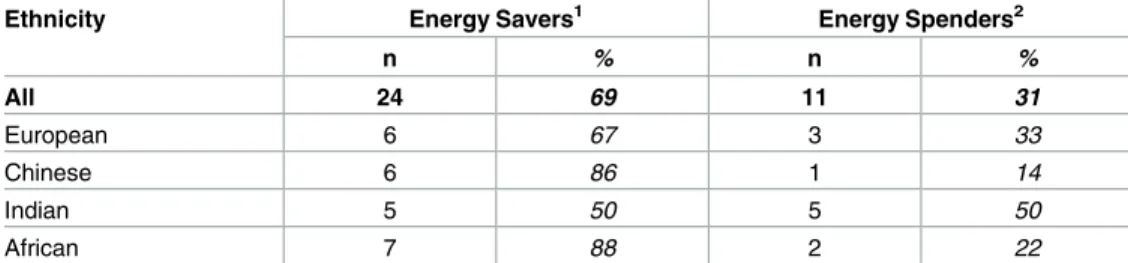
According to the EE response to standing, the majority of subjects (n = 24; 69%) were energy savers, with only 31% (n = 11) showing a sustained increase in EE (on average, 0.63± 0.06 kJ/ min; 13.9± 1.3%) during the 10 min standing period relative to sitting (i.e., energy spenders). The EE and RQ responses of both the energy savers and energy spenders are summarized inFig 1. On average, energy savers had a lower resting EE than energy spenders (4.19± 0.10 vs 4.56 ± 0.15 kJ/min; p<0.05), but did not differ significantly in terms of resting RQ (0.827± 0.010 vs 0.853 ± 0.015). Similarly, regardless of the response during standing, there were no differences in EE (4.31± 0.09 kJ/min vs. 4.34 ± 0.10 kJ/min) or RQ (0.835 ± 0.008 vs 0.843 ± 0.007) between the first (baseline) and second (post-standing) sitting periods, respectively. The distribution of energy savers to energy spenders is shown inTable 1, and did not significantly differ between the four ethnic groups (p = 0.4). Individual EE and RQ responses (grouped by ethnicity) are shown in
Fig 2.
Overall, when all subjects were pooled, RQ decreased during standing relative to sitting (0.835± 0.008 vs 0.817 ± 0.007; p<0.01), with energy spenders experiencing a significantly greater decrease in RQ during the standing period than energy savers (-0.042± 0.007 vs -0.006± 0.007; p<0.01) (Fig 1B). However, no significant correlations were observed between EE and RQ at any point during the experimental protocol, either in terms of raw values or change from baseline.
Anthropometric comparison between ethnic groups
The characteristics of all subjects are summarized inTable 2. There were no significant differ-ences in age, height, weight, BMI or waist circumference between the ethnic groups. However, there were differences between groups in terms of body proportions. Most notably, in the Chi-nese group sitting height was significantly greater than the African group (90.7 + 0.4 cm vs. 85.6 + 1.1 cm, respectively), leg length significantly less than both the European and Indian groups (82.0 + 1.2 vs. 88.9 + 1.6 and 88.6 + 1.0 cm, respectively), and relative leg length (leg length/height) significantly less than both Indian and African groups (0.47 + 0.004 vs 0.50 + 0.004 and 0.51 + 0.004 cm, respectively). Overall, among the 4 ethnic groups studied here, the Chinese group showed the lowest values for body weight, height, leg length, and relative leg length, as well as for arm and waist circumferences.
Relationship between EE phenotype and anthropometry
Energy spenders had significantly greater average body weight (82.3± 4.0 vs 68.8 ± 2.7 kg; p<0.01), waist circumference (91.6± 3.1 vs 82.6 ± 2.1 cm; p<0.05) and leg length (89.8 ± 1.2 vs 86.2± 0.8 cm; p<0.05) compared to energy savers.
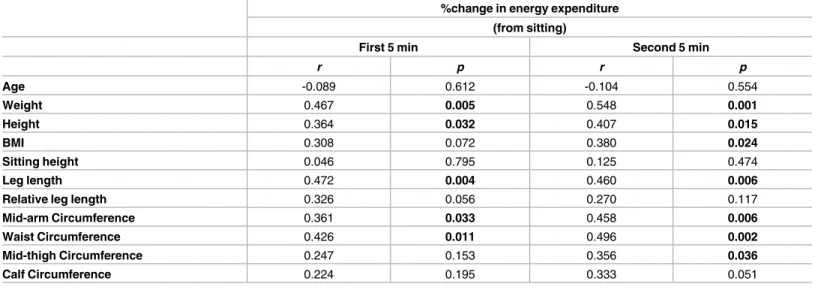
Results of the Pearson correlation analyses between change in EE during the first and sec-ond 5 min standing periods compared to sitting and the various anthropometric variables are shown inTable 3; Significant, positive correlations were observed between the energy cost of standing during thefirst 5 min of the standing period and body weight (Fig 3A) and leg length
Fig 1. Energy expenditure (EE; Panel A) and respiratory quotient (RQ; Panel B) responses to standing compared to sitting (subjects grouped by EE response phenotype). Values mean±SEM. Open circles represent energy savers; closed circles represent energy spenders. Shaded area indicates 10 min standing period.*statistically significant difference from first (baseline) sitting value.
(Fig 3B) (r2= 0.22, both). Significant, positive correlations were also observed between the energy cost of standing during the first 5 min of the standing period and height, mid-arm- and waist circumferences (r2= 0.11–0.22; data shown inTable 3).
Significant, positive correlations were also observed between the energy cost of standing maintenance (i.e., during thesecond 5 min of the standing period) and body weight (Fig 3C) and leg length (Fig 3D) (r2= 0.30 and 0.21, respectively). During this time-period (standing maintenance), significant, positive correlations were also observed between the energy cost of standing maintenance and height, BMI, circumferences of the mid-arm, waist, and mid-thigh (r2= 0.13–0.30; data shown inTable 3).
These correlated anthropometric variables were then included in stepwise linear regression analyses in addition to age and ethnicity to eliminate auto-correlates. Following the application of these analyses, only leg length remained significant during the first 5 min of standing (r2= 0.22, p<0.005), and only weight remained significant during the second 5 min (r2= 0.30, p = 0.001).
Discussion
The majority of individuals show little or no increase in energy expenditure during standing relative to sitting, with results of the present study showing the predominance of the postural energy saver phenotype regardless of ethnicity. Whilst the mechanisms by which the large majority of individuals appear to maintain sitting and standing postures at the same energetic cost remains to be elucidated, this study indicates that this observed heterogeneity may, in part, be related to anthropometric differences. In our previous study, we did not observe any relationship between the energy cost of standing posture maintenance in European subjects and body weight, height or composition, which may have been due to the narrow range of the mono-ethnic study cohort or the fact that the previous study had a smaller sample size than the current study (n = 22 vs. 35). However, in the current study we found body weight to be the most consistent and robust contributor to variability in energy cost; accounting for ~30% of the observed individual variability in energy cost.
Whilst the number of subjects in the present study was too small to make a comprehensive comparison, two previous studies have compared the energy cost of standing compared to sit-ting between ethnic groups, although the results are somewhat discrepant. The first study, by Geissler and Aldouri [12], compared European, Asian (mixed grouping from Hong Kong, South-East Asia, and the Indian subcontinent), and African men, and reported that the energy
Table 1. Distribution of subjects according to energy expenditure (EE) phenotype and ethnicity. Ethnicity Energy Savers1 Energy Spenders2
n % n % All 24 69 11 31 European 6 67 3 33 Chinese 6 86 1 14 Indian 5 50 5 50 African 7 88 2 22 1
Energy saver: Those who showed little or no change in EE (a rise in EE of<5%) during 10 min standing period relative to sitting.
2
Energy spender: Those who i) increased EE (a rise in EE of>5%) during first 5 min of the 10 min standing period relative to sitting, and ii) maintained an elevated EE throughout the entire 10 min standing period (drop in EE during second 5 min<30% of the rise in EE during first 5 of standing period).
cost of standing (compared to lying) was higher in the European subjects (by 10 to 13%). This observed difference, of 10–13%, persisted in a subset of subjects matched by weight, height and BMI, leading the authors to conclude that the ethnic differences existed over and above those due to body size. However, body proportions were not assessed, and the observed differ-ences appear to be primarily due to a large difference in resting metabolic rate between the Europeans and the other two groups. In fact, if considering only the change in EE between sit-ting and standing, the Asian group showed the lowest delta (8% versus 12% and 16% for the European and African groups, respectively). The second study, by Strickland and Ulijaszek [13], compared British and Nepalese (Gurkha) soldiers and found no differences between these two groups in terms of the energy cost of standing, calculated as the difference between standing and lying EE. Again however, when considering only the difference between sitting
Fig 2. Individual energy expenditure (EE; Panel A) and respiratory quotient (RQ; Panel B) responses to standing compared to sitting (subjects grouped by ethnicity).ΔEE is calculated as the change in EE during the second 5 min of the standing period compared to sitting and expressed as a percentage of resting EE. Solid line represents the median value for each ethnic group.
Table 2. Subject characteristics.
All European Chinese Indian African p-value
n = 35 n = 9 n = 7 n = 10 n = 9 Age 27.4±0.7 24.9±1.1 27.3±0.6 27.3±1.0 30.2±1.9 NS (y) (20–43) (20–30) (26–30) (21–32) (25–43) Weight 73.1±2.4 75.4±4.9 66.9±5.6 73.4±4.4 75.1±5.1 NS (kg) (45–106) (54–106) (45–88) (52–103) (56–106) Height 176±1.0 180±2.1 173±1.3 176±1.9 174±2.0 NS (cm) (166–190) (170–190) (168–178) (168–186) (166–183) BMI 23.2±0.7 21.9±1.3 22.3±1.7 23.7±1.3 24.7±1.3 NS (kg/m2) (15.5–32.0) (17.5–29.4) (15.5–29.2) (16.9–31.4) (19.1–32.0)
Sitting height 88.4±0.7 90.6±1.2a,b 90.7±0.4a 87.5±1.4a,b 85.6±1.1b <0.05
(cm) (80–96) (85–96) (90–92) (83–94) (80–90)
Leg length 87.3±0.7 88.9±1.2a 82.0±1.2b 88.6±1.0a 88.4±1.3a,b <0.05
(cm) (77–94) (85–94) (77–86) (85–94) (82–94)
Relative leg 0.50±0.002 0.50±0.003a,b 0.47±0.004b 0.50±0.004a 0.51±0.004a <0.001
length (0.46–0.53) (0.49–0.51) (0.46–0.49) (0.49–0.52) (0.49–0.53)
Mid-arm 30.2±0.7 29.4±0.9a,b 27.0±1.4a 30.7±1.4a,b 33.1±1.4b <0.05
Circumference (cm) (21–42) (25–34) (21–31) (68–104) (29–42) Waist 85.4±1.8 85.8±3.5 82.9±4.6 88.6±3.1 83.6±4.1 NS Circumference (cm) (64–105) (73–105) (64–99) (68–104) (66–105) Mid-thigh 52.0±1.2 52.9±1.8 50.4±2.7 50.7±2.1 53.9±2.8 NS Circumference (cm) (38–68) (43–60) (40–61) (38–63) (43–68) Calf 36.7±0.6 37.8±1.2 37.9±1.5 35.2±1.1 36.4±1.2 NS Circumference (cm) (31–45) (33–45) (32–43) (32–44) (31–43)
Data presented as mean±SEM (range). NS: not significant. Values not sharing superscript (i.e., a,b) are significantly different (p<0.05) from one another by Kruskal-Wallis test.
doi:10.1371/journal.pone.0169478.t002
Table 3. Correlations (Pearson) between the energy cost of standing posture maintenance and various anthropometric measurements. %change in energy expenditure
(from sitting)
First 5 min Second 5 min
r p r p Age -0.089 0.612 -0.104 0.554 Weight 0.467 0.005 0.548 0.001 Height 0.364 0.032 0.407 0.015 BMI 0.308 0.072 0.380 0.024 Sitting height 0.046 0.795 0.125 0.474 Leg length 0.472 0.004 0.460 0.006
Relative leg length 0.326 0.056 0.270 0.117
Mid-arm Circumference 0.361 0.033 0.458 0.006
Waist Circumference 0.426 0.011 0.496 0.002
Mid-thigh Circumference 0.247 0.153 0.356 0.036
Calf Circumference 0.224 0.195 0.333 0.051
Values highlighted in bold represent statistically significant correlations.
and standing EE, the difference in EE observed in the British soldiers was more than twice that of the Gurkhas (0.4 vs 0.9 kJ/min, or +6% vs +13%), but this difference was not discussed. Interestingly, Gurkha soldiers also had, on average, shorter legs and greater leg circumferences (mid-thigh and calf) than their British counterparts. However, body proportions (i.e., the ratio of leg length to height) did not appear to differ between the two groups.
In the present study, we also found an association between leg length and energy cost dur-ing the first 5 min of the standdur-ing period. This association is most likely reflective of the cost of the postural transition (sitting to standing) rather than the maintenance of the standing pos-ture per se; with the cost of transitioning from a chair of equal height greater in those with lon-ger legs [25]. However, the relationship between weight and the energy cost of maintaining a standing posture, and the association with relative leg length, remains to be explained. The answer may indeed lie within leg fat-free mass (either in terms of absolute content, or ratio to fat mass). However, with controversy regarding the appropriateness of most analytic field tech-niques to compare across ethnic groups given known ethnic differences in body proportions [26–30], a comparison would require sophisticated techniques (such as magnetic resonance
Fig 3. Relationship between the energy cost of standing relative to sitting and body weight (left panels), and leg length (right panels).
Panels A and B show the relationship with (A) the percentage change in EE (ΔEE) and body weight and (B)ΔEE and leg length during the first 5
min of the standing period compared to resting EE; Panels C and D show the relationship with (C)ΔEE and body weight and (D)ΔEE and leg length during the second 5 min of the standing period compared to resting EE. Symbols denote ethnic group (defined in Panel A). Solid line indicates the linear regression including all subjects.
imaging), or ethnic-specific algorithms for each ethnic subgroup, which were not available in the present study.
In the current study, energy spenders had greater body weights than energy savers. This association has clinical implications for obese individuals, particularly the energy spenders, who based on their greater body weight, may benefit more in terms of energy expended when substituting standing for sitting. Recent studies highlight modest EE benefits of standing for obese individuals [31,32]. Future studies should focus on uncovering the mechanisms underly-ing these specific EE phenotypes.
The current study has a number of caveats, in particular:i) Given the small sample size for each ethnic group, it is difficult to determine whether some of the large non-significant differ-ences between the groups reflect actual biological differdiffer-ences or simply data variation. Although similar non-significant differences have been shown in sitting / standing interventions among Europeans [9], future work with greater numbers of subjects in each ethnic group is required to explore this further.ii) Females were excluded from the current study in order to remove any confounding effect of female hormones on EE. This represents a limitation of the study as it limits the generalizability of the findings, and therefore future studies should include mixed gender ethnic groups.iii) Another limitation of the study is that no measures of movement or weight shifting were performed. Subjects were requested to refrain from moving while under the ventilated hood and were restricted in their movement simply as a result of the ventilated hood being securely fastened around them. The influence of movement on the results was fur-ther minimized by excluding the two minutes of data associated with the transition from sitting to standing and vice versa; however, it is possible that some individuals performed more micro-movements during standing than others, or more weight-shifting (shifting of body weight from one leg to the other) and that this variability in small movements underlies the differences in energy cost observed. As such, measurement and investigation of these movements merits future investigation, particularly in light of previously reported associations between anthro-pometry, balance and postural sway [20,21]. Strengths of the current study include the fact that EE was measured minute-by-minute by indirect calorimetry allowing us to determine the EE cost of maintaining a standing posture in a multi-ethnic group and combined with standardized measurements of anthropometry and body composition. The EE cost of posture maintenance was correlated with body weight, such that those classified as having the energy spender pheno-type had greater average body weights. This has practical implications for standing interven-tions aimed at increasing EE in obese individuals. Additionally, identifying EE phenotypes (energy spenders and energy savers) provides a greater understanding of the spontaneous physi-cal activity component of EE regulation. This study also identified a novel association between leg length and the EE cost of posture maintenance, which warrants further exploration.
In conclusion, our results indicate that the majority of individuals in a multi-ethnic cohort display a postural energy-saver phenotype. Those who displayed an energy spender phenotype had a significantly greater average body weight, which has important practical implications for interventions designed to increase EE in the obese. With considerable importance to our under-standing of the spontaneous physical activity compartment of EE and its potential as a target for weight regulation, the mechanisms by which the large majority of individuals appear to main-tain sitting and standing postures at the same energetic cost warrant further investigation
Supporting Information
S1 Table. Subject characteristics. Individual demographic, anthropometric, and body com-position data for each study participant.
S2 Table. Individual energy expenditure and respiratory quotient responses to standing compared to sitting.
(PDF)
Acknowledgments
We are grateful to Professor Abdul Dulloo for helpful discussions during the preparation of this manuscript.
Author Contributions
Conceptualization: JLMC. Formal analysis: CRM JLMC. Investigation: CRM JLMC. Methodology: JLMC. Project administration: JLMC. Supervision: JLMC. Validation: JLMC. Visualization: CRM JLMC.Writing – original draft: CRM JLMC. Writing – review & editing: CRM JLMC.
References
1. Hills AP, Byrne NM (1998) Exercise prescription for weight management. Proc Nutr Soc 57: 93–103. PMID:9571714
2. Wendel-Vos W, Droomers M, Kremers S, Brug J, van Lenthe F (2007) Potential environmental determi-nants of physical activity in adults: a systematic review. Obes Rev 8: 425–440. doi: 10.1111/j.1467-789X.2007.00370.xPMID:17716300
3. Perri MG, Anton SD, Durning PE, Ketterson TU, Sydeman SJ, et al. (2002) Adherence to exercise pre-scriptions: effects of prescribing moderate versus higher levels of intensity and frequency. Health Psy-chol 21: 452–458. PMID:12211512
4. Bjorntorp P (1995) Evolution of the understanding of the role of exercise in obesity and its complications. Int J Obes Relat Metab Disord 19 Suppl 4: S1–4.
5. Allen K, Morey MC (2010) Physical activity and adherence. Improving Patient Treatment Adherence: Springer. pp. 9–38.
6. Miller DS (1982) Factors affecting energy expenditure. Proc Nutr Soc 41: 193–202. PMID:7051017
7. Cole AH, Ogbe JO (1987) Energy intake, expenditure and pattern of daily activity of Nigerian male stu-dents. Br J Nutr 58: 357–367. PMID:3689743
8. Lawrence M, Singh J, Lawrence F, Whitehead RG (1985) The energy cost of common daily activities in African women: increased expenditure in pregnancy? Am J Clin Nutr 42: 753–763. PMID:4061341
9. Miles-Chan JL, Sarafian D, Montani JP, Schutz Y, Dulloo A (2013) Heterogeneity in the energy cost of posture maintenance during standing relative to sitting: phenotyping according to magnitude and time-course. PLoS One 8: e65827. doi:10.1371/journal.pone.0065827PMID:23741514
10. Kanade AN, Gokhale MK, Rao S (2001) Energy costs of standard activities among Indian adults. Eur J Clin Nutr 55: 708–713. doi:10.1038/sj.ejcn.1601211PMID:11477470
11. Katzmarzyk PT, Leonard WR, Stephen MA, Berti PR, Ross AG (1996) Differences between observed and predicted energy costs at rest and during exercise in three subsistence-level populations. Am J Phys Anthropol 99: 537–545. doi:10.1002/ajpa.1330990402PMID:8779337
12. Geissler CA, Aldouri MS (1985) Racial differences in the energy cost of standardised activities. Ann Nutr Metab 29: 40–47. PMID:3977293
13. Strickland SS, Ulijaszek SJ (1990) Energetic cost of standard activities in Gurkha and British soldiers. Ann Hum Biol 17: 133–144. PMID:2334108
14. Mahadeva K, Passmore R, Woolf B (1953) Individual variations in the metabolic cost of standardized exercises: The effects of food, age, sex and race. J Physiol 121: 225–231. PMID:13085332
15. Passmore R, Durnin JV (1955) Human energy expenditure. Physiol Rev 35: 801–840. PMID:
13266530
16. Vaz M, Karaolis N, Draper A, Shetty P (2005) A compilation of energy costs of physical activities. Public Health Nutr 8: 1153–1183. PMID:16277826
17. Deurenberg P, Yap M, van Staveren WA (1998) Body mass index and percent body fat: a meta analysis among different ethnic groups. Int J Obes Relat Metab Disord 22: 1164–1171. PMID:9877251
18. Deurenberg P, Deurenberg-Yap M (2003) Validity of body composition methods across ethnic popula-tion groups. Acta Diabetol 40 Suppl 1: S246–249.
19. Norgan NG (1994) Population differences in body composition in relation to the body mass index. Eur J Clin Nutr 48 Suppl 3: S10–25; discussion S26-17.
20. Alonso AC, Mochizuki L, Silva Luna NM, Ayama S, Canonica AC, et al. (2015) Relation between the Sensory and Anthropometric Variables in the Quiet Standing Postural Control: Is the Inverted Pendulum Important for the Static Balance Control? Biomed Res Int 2015: 985312. doi:10.1155/2015/985312
PMID:26539550
21. Cruz-Gomez NS, Plascencia G, Villanueva-Padron LA, Jauregui-Renaud K (2011) Influence of obesity and gender on the postural stability during upright stance. Obes Facts 4: 212–217. doi:10.1159/ 000329408PMID:21701237
22. Lohman TG, Roche AF, Martorell R (1988) Anthropometric standardization reference manual. Cham-paign, IL: Human Kinetics Books. vi, 177 p. p.
23. Phang PT, Rich T, Ronco J (1990) A validation and comparison study of two metabolic monitors. JPEN J Parenter Enteral Nutr 14: 259–261. PMID:2112638
24. Vohra SB, Keegan MA, Campbell IT, McGuinness K (1995) Practical limitations of the Deltatrac indirect calorimeter. Clin Nutr 14: 155–161. PMID:16843926
25. Hatamoto M, Ohtsuki K, Maharjan N, Ono S, Dehama K, et al. (2016) Performance evaluation of the sul-fur-redox-reaction-activated up-flow anaerobic sludge blanket and down-flow hanging sponge anaero-bic/anoxic sequencing batch reactor system for municipal sewage treatment. Bioresour Technol 204: 171–176. doi:10.1016/j.biortech.2015.12.052PMID:26773951
26. Bosy-Westphal A, Schautz B, Later W, Kehayias JJ, Gallagher D, et al. (2013) What makes a BIA equa-tion unique? Validity of eight-electrode multifrequency BIA to estimate body composiequa-tion in a healthy adult population. Eur J Clin Nutr 67 Suppl 1: S14–21.
27. Lee S, Bountziouka V, Lum S, Stocks J, Bonner R, et al. (2014) Ethnic variability in body size, propor-tions and composition in children aged 5 to 11 years: is ethnic-specific calibration of bioelectrical imped-ance required? PLoS One 9: e113883. doi:10.1371/journal.pone.0113883PMID:25478928
28. Nightingale CM, Rudnicka AR, Owen CG, Donin AS, Newton SL, et al. (2013) Are ethnic and gender specific equations needed to derive fat free mass from bioelectrical impedance in children of South asian, black african-Caribbean and white European origin? Results of the assessment of body composi-tion in children study. PLoS One 8: e76426. doi:10.1371/journal.pone.0076426PMID:24204625
29. Aglago KE, Menchawy IE, Kari KE, Hamdouchi AE, Barkat A, et al. (2013) Development and validation of bioelectrical impedance analysis equations for predicting total body water and fat-free mass in North-African adults. Eur J Clin Nutr 67: 1081–1086. doi:10.1038/ejcn.2013.125PMID:23839666
30. Nigam P, Misra A, Colles SL (2013) Comparison of DEXA-derived body fat measurement to two race-specific bioelectrical impedance equations in healthy Indians. Diabetes Metab Syndr 7: 72–77. doi:10. 1016/j.dsx.2013.02.031PMID:23680244
31. Hawari NS, Al-Shayji I, Wilson J, Gill JM (2016) Frequency of Breaks in Sedentary Time and Postpran-dial Metabolic Responses. Med Sci Sports Exerc.
32. Thorp AA, Kingwell BA, English C, Hammond L, Sethi P, et al. (2016) Alternating Sitting and Standing Increases the Workplace Energy Expenditure of Overweight Adults. J Phys Act Health 13: 24–29. doi: