Microstructure of Bentonite in Iron Ore Green Pellets
Iftekhar U. Bhuiyan,1 Johanne Mouzon,1,* Birgit Schröppel,2 Andres Kaech,3 Illia Dobryden,4Seija P.E. Forsmo,5 and Jonas Hedlund1
1Chemical Technology, Luleå University of Technology, SE-971 87 Luleå, Sweden
2Natural and Medical Sciences Institute (NMI), University of Tübingen, 72 770 Reutlingen, Germany 3Center for Microscopy and Image Analysis, University of Zurich, CH-8006 Zurich, Switzerland 4Division of Physics, Luleå University of Technology, SE-971 87 Luleå, Sweden
5LKAB, R&D, SE-983 81 Malmberget, Sweden
Abstract: Sodium-activated calcium bentonite is used as a binder in iron ore pellets and is known to increase
strength of both wet and dry iron ore green pellets. In this article, the microstructure of bentonite in magnetite pellets is revealed for the first time using scanning electron microscopy. The microstructure of bentonite in wet and dry iron ore pellets, as well as in distilled water, was imaged by various imaging techniques ~e.g., imaging at low voltage with monochromatic and decelerated beam or low loss backscattered electrons! and cryogenic methods ~i.e., high pressure freezing and plunge freezing in liquid ethane!. In wet iron ore green pellets, clay tactoids ~stacks of parallel primary clay platelets! were very well dispersed and formed a voluminous network occupying the space available between mineral particles. When the pellet was dried, bentonite was drawn to the contact points between the particles and formed solid bridges, which impart strength to the solid compact.
Key words: microstructure, high pressure freezing, plunge freezing, freeze fracture, cryo-SEM, bentonite,
magnetite, iron ore, green pellets
I
NTR ODUCTIONBentonite is an impure mineral containing mostly montmo-rillonite, a clay of the smectite family. Because of its versatile properties, bentonite is used in many industrial applica-tions, e.g., in drilling muds, as a foundry bond clay, and as a sealant in irrigation ditches and radioactive waste reposito-ries ~Murray, 1991; Pusch & Yong, 2005!. In the iron ore industry, it is utilized as a binder to produce iron ore pellets, since it improves ballability ~Qiu et al., 2004! and the strength of as-prepared wet green pellets ~Forsmo et al., 2006! and of dried pellets ~Volzone & Cavalieri, 1996!. However, there is no reliable microstructural data in the literature that explains the role of bentonite in iron ore pellets and similar materials.
Montmorillonite consists of platelets made of an octa-hedral alumina sheet sandwiched in between two tetra-hedral silica sheets. Because of isomorphous substitutions, the platelets carry a net negative charge, which causes the platelets to separate to different extents when hydrated, depending on the counter ions present ~Luckham & Rossi, 1999!. Sodium-activated bentonite such as that investigated in the present work swells to several times its original volume when immersed in water ~Norrish, 1954!. Numer-ous studies have tried to relate the special properties of smectite clays to the arrangement of the platelets and many structures were proposed over the past century ~Terzaghi, 1925; Goldschmidt, 1926; Freundlich, 1928; Broughton & Squires, 1936; Hauser & Reed, 1937; Goodeve, 1939; Hof-mann & Hausdorf, 1945; Lambe, 1953; Van Olphen, 1956, 1964; M’Ewen & Pratt, 1957; Rosenqvist, 1959; Weiss, 1962;
Norrish & Rausell-Colom, 1963; Callaghan & Ottewill, 1974; Rand et al., 1980; Keren et al., 1988; Lagaly & Ziesmer, 2003; Morris & Zbik, 2009!. Yet, reliable observations of benton-ite, smectbenton-ite, or montmorillonite microstructures are scarce and most reported cryogenic scanning electron microscopy ~SEM! works must be viewed with scepticism because of the doubtful freezing procedures that were utilized.
In order to achieve vitrification of wet samples, i.e. to avoid formation of ice crystals in the samples, which would lead to the formation of artifacts in the samples, effective freezing rates in the range of about 103–105K/s are required
~Moor, 1971!. The vast majority of the cryo-SEM studies on bentonite and related compounds used plunge freezing at ambient pressure of samples larger than 100 mm in liquid cryogens such as chlorofluorocarbons ~Tessier & Pedro, 1982; Tessier et al., 1992! or propane ~Mpofu et al., 2004; McFarlane et al., 2006; Zbik et al., 2008, Morris & Zbik, 2009!. However, freezing of water without crystallization is difficult to achieve by plunge freezing of hydrated samples having a thickness larger than 10–20 mm, depending on water concentration, chemical composition, and other fac-tors ~Steinbrecht & Zierold, 1987!. In the case of smectite clays, Chenu and Tessier ~1995! demonstrated that plunge freezing in liquid nitrogen and chlorofluorocarbons undoubt-edly altered the microstructure of moderately concentrated suspensions of Na-smectite as compared with results ob-tained by small angle X-ray scattering of wet samples. Plunge freezing in liquid nitrogen was also shown to be detrimental in highly concentrated suspensions of benton-ite by Holzer et al. ~2010! in comparison to high pressure freezing ~HPF!. Indeed, HPF is the only technique that enables adequate freezing or even vitrification of samples with thicknesses below 200 mm ~Hohenberg et al., 1994;
Received March 13, 2013; accepted November 6, 2013 *Corresponding author. E-mail: [email protected]
M
icroscopy
M
icroanalysis
Studer et al., 1995! although up to 600 mm is also claimed for biological samples ~Moor, 1987; Galway et al., 1995!. Application of high pressure ~2,100 bar! during the freezing process can preserve the native hydrated physiological state of biological specimens without visible ice crystal formation ~Studer et al., 1989!.
The microstructure of bentonite in aqueous suspension has already been reported as a dispersed structure of clay platelets as revealed by HPF and cryo-SEM ~Holzer et al., 2010!. However, the microstructure of bentonite in wet iron ore pellets might differ from that observed in a pure aque-ous suspension of bentonite because of the mechanical action during balling and the use of processing water. In addition, machining green iron ore pellets to dimensions applicable for HPF ~,500 mm! is difficult and may change its native hydrated state. Therefore, HPF cannot realistically be applied to green iron ore pellets. Nevertheless, plunge freezing pellets in a satisfactory cryogen such as liquid ethane might result in cooling rates sufficient to vitrify water close to the outer surface of the sample. This can be ascertained by comparing the resulting microstructure with that obtained in high pressure frozen model systems.
In the making of iron ore pellets, the green pellets are dried before oxidation and sintering. Drying causes a remark-able increase of strength in iron ore pellets in the presence of bentonite ~Forsmo et al., 2006!. According to Kawatra and Ripke ~2002!, bentonite disperses into individual plate-lets and coats the surfaces of the magnetite particles like a gel. However, direct observation of this type of microstruc-ture has never been reported despite several attempts ~Ka-watra & Ripke, 2001, 2002!. As a matter of fact, bentonite was found to be difficult to resolve among magnetite parti-cles by electron microscopy. These difficulties are a result of the low bentonite content ~;0.5 wt%! and the fineness of the bentonite platelets ~a few nanometers in thickness!, which are nearly invisible at high accelerating voltage with the signal from the magnetite particles being transmitted through the clay platelets. Therefore, special contrast and high resolution imaging techniques are required in order to identify and clearly image dried bentonite in iron ore pel-lets. Another difficulty associated with imaging magnetite ore by SEM is that it is magnetic and therefore final lenses using magnetic field for immersion can be ruled out in order to achieve high resolution, since loose magnetic parti-cles can be attracted by such lenses.
In the present study, we reveal for the first time the microstructure of bentonite in wet and dry iron ore pellets by advanced sample preparation and imaging techniques. First, the microstructure of bentonite in green iron ore pellets frozen by plunge freezing in liquid ethane is investi-gated and compared with that of a high pressure frozen bentonite suspension and an iron ore–bentonite slurry, all with comparable bentonite to water ratio. The microstruc-ture of bentonite in the aqueous suspension is imaged at very low voltage using a monochromatic and decelerated electron beam in combination with an immersion magnetic field to achieve maximum resolution. The resulting images
serve as a reference for comparison with the micrographs obtained with an electrostatic immersion lens on the mag-netic samples to ease interpretation. Second, low loss back-scattered electron imaging at low voltage is used to identify bentonite in dry iron ore pellets and in the next step secondary electron ~SE! imaging is used to gain topograph-ical information.
M
ATERIALS ANDM
ETHODSMaterials
The magnetite concentrate ~collected from LKABs concen-trating plants, in Malmberget, Sweden! had a particle size of 68% less than 45 mm and the mean particle size measured by laser diffraction was 30 mm. The chemical composition of the concentrate was 71% Fe, 0.6% SiO2, and 0.018% P.
The specific surface area of the iron ore concentrate deter-mined from nitrogen adsorption data using the Brunauer– Emmett–Teller ~BET! method ~ASAP2010, Micromeritics! was 0.43 m2
/g. Sodium-activated calcium bentonite clay ~Milos, Greece! with a particle fineness of 94% less than 75 mm was used as a binder. The Enslin swelling value of bentonite was measured to be 580% ~after 2 h!. The BET surface area of the bentonite particles was 40 m2
/g. The bentonite was dried overnight at 1058C and stored in a desiccator before balling. The chemical composition of ben-tonite was of 52% SiO2, 16% Al2O3, 6% CaO, 4% MgO,
2.5% Na2O, 4% Fe, and 0.7% K2O.
Preparation of Iron Ore Green Pellets
Iron ore green pellets were produced by micro-balling as described earlier ~Forsmo, 2007! and a brief description is presented here. First, pellet feed was prepared by mixing 7 kg moist-magnetite concentrate with 0.5% bentonite by weight of concentrate in a laboratory mixer and moisture content was adjusted to 8.2% using tap water. It is notewor-thy that ;50% of the final moisture was because of process-ing water in the concentrate. Second, micro-ballprocess-ing was performed in a rotating drum using a seeding approach. Seeds of 3.5–5 mm in diameter were produced by scattering the pellet feed in small amounts on the rotating drum and spraying water to initiate growth. Then some of these seeds were returned to the drum to grow green pellets by scatter-ing fresh feed and sprayscatter-ing water whenever needed. The final moisture content was 8.23 wt% and wet green pellets with a size between 10 and 12.5 mm were selected by screening. For future characterization by SEM, some of the resulting pellets were immediately placed in an air-tight flask containing a sponge impregnated with a saturated KCl solution in order to preserve the hydration state. The other pellets were dried at 1058C for 24 h for characterization of the dry pellets.
Preparation of the Bentonite Suspension and
Iron Ore–Bentonite Slurry
As pieces of iron ore pellets cannot be accommodated in the limited space of sample carriers for HPF, two model systems
were prepared: a bentonite suspension and an iron ore– bentonite slurry. The bentonite to water ratio in the iron ore green pellets was about 5% ~wt/wt!. Therefore, suspensions with this bentonite content were prepared by dispersing bentonite in distilled water by ball milling to achieve suit-able dispersion. Milling was carried out using ZrO2balls for
24 h in a plastic container rotating at about 300 rpm. Then the suspension was shaken for 6 h in a shaker after remov-ing the balls. Magnetite particles with a size ,36 mm were selected by dry screening in order for the slurry to accom-modate the limited space available in the dedicated HPF sample carriers. This slurry was formed by thoroughly mixing 74 wt% ~36 vol%! magnetite particles with the bentonite suspension. This concentration was selected since the viscosity was still sufficiently low to allow the slurry to flow through the ultrafine tip of a micropipette and to fill the sample carriers for HPF. It corresponds approximately to half the content of magnetite particles in typical iron ore green pellets ~67–69 vol% according to Forsmo et al., 2006!.
High Pressure Freezing
For HPF, the bentonite suspension or the iron ore–bentonite slurry was pipetted into the cylindrical 100 mm cavity of a 3 mm aluminum specimen carrier type A and sandwiched with a flat aluminum specimen carrier type B. Alternatively, samples were sandwiched between two 3 mm aluminum specimen carriers type A with the 100 mm cavities facing each other ~total cavity 200 mm, Leica Microsystems, Vi-enna, Austria!. In the next step, HPF was performed using either a HPM 100 ~Leica Microsystems! or a HPM 010 ~ABRA Fluid AG, Widnau, Switzerland! apparatus. The high pressure frozen samples were kept in liquid nitrogen before observation by cryo-SEM. The flat aluminum specimen carrier was removed from the sandwich in liquid nitrogen and the sample was fractured with a knife. The A type specimen carrier sandwiches were fractured in the freeze-fracturing module of a MED020 machine ~Leica Microsys-tems!. Fractured samples were transferred to the different cryo-SEMs using a vacuum cryo-transfer shuttle ~VCT 100; Leica Microsystems!.
Plunge Freezing and Freeze Fracturing
A 3 mm thick slice was cut from the middle of a wet iron ore green pellet using a scalpel. The sample was immedi-ately plunged into liquid ethane in a liquid nitrogen cooled Dewar. It is worth mentioning that liquid ethane is the most efficient cryogen because of the high cooling rate and of the large difference between boiling ~184 K! and melting points ~90 K! ~Ryan et al., 1990!. Dry butane gas was blown contin-uously to protect the liquid ethane surface in the Dewar from atmospheric contamination. After freezing in liquid ethane, the sample was fractured in liquid nitrogen in the Leica EM VCT100 loading box using a knife and a hammer. The knife was cooled in liquid nitrogen before fracturing. The sample was mounted onto the specimen holder and the fracture surface was shielded by a precooled cover made of a folded copper foil to avoid contamination during transfer to
the Leica EM SCD500 instrument, in which the foil was removed by rotating the sample. Finally, the sample was loaded into the cryo-SEM chamber using the shuttle.
Sample Preparation of the As-Received Bentonite
and Dry Iron Ore Pellet
As-received bentonite powder was deposited on a carbon adhesive disk on the top of a 12.5 mm aluminum pin stub for SEM imaging. Loose particles were removed by blowing with a stream of argon gas. The same preparation procedure was used to prepare samples for atomic force microscopy ~AFM! investigation. A carbon adhesive disk with deposited bentonite powder was placed on a silica substrate to per-form scanning. To study the distribution of bentonite in dried iron ore pellets by SEM, fragments of such samples were glued with silver paint on a 12.5 mm aluminum pin stub.
SEM and AFM Imaging
A Magellan 400 XHR-SEM ~FEI Company, Eindhoven, the Netherlands! equipped with an Elstar electron column was used for imaging of the nonmagnetic samples at high reso-lution. In this instrument, high resolution imaging by the through-the-lens detector is partly achieved by the applica-tion of a strong immersion magnetic field onto the sample to reduce focal length and thus chromatic aberration ~Young et al., 2008!. In addition, the column is provided with a monochromator-like device, which reduces the energy spread of the electrons emitted by the Schottky source to ,0.2 eV ~Henstra et al., 2009!. In addition to the magnetic immer-sion field and monochromatic beam, deceleration was used to reduce the landing energy of the electrons onto the samples by applying a bias voltage to the sample holder. The resulting cathode lens further reduces the aberration of the electron column, which is proportional to the accelerat-ing voltage-landaccelerat-ing energy ratio ~Müllerová & Frank, 1993!. The as-received bentonite sample was imaged at 250 eV landing energy using a stage bias of 2,750 V and a probe current of 13 pA. The quality of the images was compared with what could be obtained with a state-of-the-art AFM. The bentonite sample was scanned with an NTEGRA AFM ~NT-MDT! using a 10 mm sample scanner ~SC210NTF, NT-MDT! with equivalent close-loop. The surface imaging was performed in tapping mode with the use of a NSG-01 probe ~NT-MDT, Moscow! of tetrahedral total tip shape with curvature radius ,10 nm and nominal spring constant of 5.1 N/m. The scan velocity was usually in the range of 4–5 mm/s.
The high pressure frozen bentonite suspension was observed in another Magellan 400 instrument equipped with a Leica cryo-stage. Observation of the freshly frac-tured surface was carried out at⫺1308C. This temperature was found to be the best compromise to prevent ice recrystallization and deposition of contamination. The three-dimensional structure of bentonite was gradually revealed by alternating short temperature cycles down to⫺1108C to cause sublimation of water and back to⫺1308C for
imag-ing. This sample was typically imaged at 500 eV landing energy using a stage bias of 2,500 V and a probe current of 1.6 pA.
Because of the strong magnetic field used for immer-sion, the Elstar column is not particularly suited for the observation of magnetic samples, which might be attracted by the column. Hence, observation of the magnetic samples was conducted in instruments equipped with a Gemini column, which utilizes an electrostatic lens for immersion ~Frosien et al., 1989; Jaksch & Martin, 1995!.
Cryo-SEM investigation of the high pressure frozen iron ore–bentonite slurry and plunge frozen green iron ore pellet was performed on a 1540XB CrossBeam cryo-SEM ~Zeiss, Oberkochen, Germany!, which was equipped with a Leica cryo-stage. Another sample of the high pressure fro-zen bentonite suspension was also investigated for compar-ison with what was obtained with a monochromatic and decelerated beam to ease interpretation of the images. In all cases, a small amount of ice was sublimed carefully by raising the stage temperature to⯝1108C. Imaging was car-ried out at 3 kV and with a current limiting aperture of 20 mm.
The fracture surface of dry iron ore green pellets was observed using an enhanced GEMINI II column on a
Merlin SEM ~Zeiss, Oberkochen, Germany!. This sample was first imaged at 1.50 kV with the energy selective backscatter detector ~an annular in-lens detector!, and the negatively biased filtering grid at 1.45 kV to gain composi-tional contrast ~Steigerwald, 2004!. The regions appearing with distinct gray levels were analyzed by energy dispersive spectroscopy ~EDS! at 3 kV and 1 nA with an X-Max 50 mm2 X-ray detector ~Oxford Instruments, Abingdon,
UK! to distinguish and localize silicates. Subsequently, im-ages with high resolution topographical contrast were re-corded with the annular in-lens SE detector to resolve the microstructure of bentonite.
All SEM imaging in this work was performed without any conductive coating of the samples.
R
ESULTS ANDD
ISCUSSIONMicrostructure of As-Received Bentonite
Bentonite was received as a powder consisting of aggregated particles. Figure 1a shows a low magnification micrograph of such aggregates that consist mainly of stacks of aggre-gated flakes. Such flakes can be distinguished at high magni-fication in Figure 1b. These flakes are composed of tactoids or quasi-crystals ~stacks of parallel primary platelets! as Figure 1. Microstructure of as-received dry bentonite powder: ~a! scanning electron microscopy ~SEM! image at low
magnification, ~b! SEM image at high magnification, and ~c! atomic force microscopy inverse phase image at identical magnification as in ~b!. Arrows indicate smectite clay platelets.
suggested by the weak patterns distinguished on the “smooth” surfaces of the aggregates. This level of resolution was made possible by the immersion field and the monochromator, which greatly reduces chromatic aberration at low accelerat-ing voltages ~,5 kV! ~Michael et al., 2009!, but also by the low landing energy ~250 eV!, which limits penetration of the beam through the samples and maximized topographi-cal contrast of the surface ~Michael, 2010!.
In addition to smectite clay, aggregates of rounded nano-particles ~,100 nm! can be observed in Figure 1b. These were found to be calcium-rich by EDS and are most proba-bly precipitated calcium carbonate, which was formed dur-ing the activation of the calcium bentonite with soda ~sodium carbonate! ~Guyonnet et al., 2005!. These nanoparticles were present everywhere in the sample, mostly intercalated be-tween flakes as revealed at high voltage ~ⱖ1 kV!.
AFM was also used to image the surface of the as-received bentonite. Figure 1c shows an AFM inverse phase image under ambient condition at identical magnification as in Figure 1b. It was found that phase imaging was the most suitable way to characterize the surface of the smectite clay rather than height and amplitude ~error signal! imag-ing. As indicated by the arrows, the edges of a few clay plate-lets can be distinguished in Figure 1c as well as the presence of the nanoparticles in between smectite layers. Comparison
of Figures 1b and 1c underlines the unprecedented SEM resolution observed in this work on such samples.
Bentonite Suspension in Water
Figures 2a–2c show how the microstructure of bentonite dispersed in water by ball milling was progressively revealed during sublimation of ice from a high pressure frozen and fractured suspension. By comparing these micrographs with those of the as-received dry bentonite ~Figs. 1a, 1b!, it is clear that the aggregated smectite flakes were exfoliated into tactoids, which were well dispersed in water. In the frac-tured surface in Figure 2a, only little sublimation of ice has occurred and it is possible to appreciate the real thickness of the tactoids as the surface sectioned by the propagating crack is still fully embedded in ice. After a small amount of ice has been sublimed as in Figure 2b, this type of detail is less obvious unless the tactoids are perfectly parallel to the direction of observation. However, the exact number of platelets involved in each tactoid cannot be resolved by cryo-SEM. However, it has been recently shown to be close to unity for sodium exchanged montmorillonite by cryo-genic transmission electron microscopy ~Segad et al., 2012!. Except in a few aggregates, the tactoids appear well dis-persed in water and the regions of direct contact seem to be limited to a minimum. The space available for free water in Figure 2. Cryo-scanning electron microscopy ~SEM! images of high pressure frozen and freeze-fractured bentonite
suspension in distilled water @5% ~wt/wt!#. Magellan 400 XHR cryo-SEM images with progressive sublimation reveals bentonite flakes ~light gray! in the ice matrix ~dark gray!: ~a! 3 keV landing energy, ~b, c! 500 eV landing energy, and ~d! same as ~c! but imaged with a 1540XB CrossBeam cryo-SEM at 3 kV for comparison.
between tactoids is rarely larger than 500 nm in width. After additional sublimation of ice, the tactoids appear to form a voluminous network as shown in Figure 2c. How continu-ous this potential network is and how far it extends is uncer-tain, but this suspension showed no sign of sedimentation apart from the meniscus after standing several months in a vial. The microstructure of the bentonite suspension after sublimation imaged using an accelerating voltage of 3 kV and an electrostatic immersion lens is shown in Figure 2d. This image should be compared with Figure 2c. The deeper penetration of the beam at 3 kV also provides information from layers located behind the first tactoids. The large faces of the tactoids cannot really be resolved and instead the densest regions encountered by the incident electron beam give rise to more signal and appear brighter. It corresponds to regions where the tactoids are approximately oriented parallel to the beam. Nonetheless, the true microstructure of dispersed bentonite can be recognized from the micrograph shown in Figure 2d after comparison with Figure 2c.
Comparison Between High Pressure Frozen
Iron Ore–Bentonite Slurry and Plunge Frozen
Iron Ore Pellet
A similar microstructure was found for bentonite in the high pressure frozen iron ore–bentonite slurry, as shown in Figure 3a, close to a large magnetite particle corresponding to the bright region on the left-hand side of the image. As expected, the microstructure of well-dispersed smectite
tac-toids extends throughout the slurry and fills the gaps be-tween the iron ore particles. However, two regions with distinctively different smectite microstructures could be dis-tinguished in the ethane plunge frozen section of the iron pellet in regions ~1! and ~2! indicated in Figure 3b.
In region ~1!, close to the outer surface of the sample ~Fig. 3c!, the microstructure of well-dispersed smectite tac-toids was again observed. As a matter of fact, there are no clay-free spaces larger than 500 nm, which are typical of clay microstructures affected by slow freezing and ice crys-tallization ~Vali & Bachmann, 1988!. Thus no signs of artifacts can be observed in the microstructure in Figure 3c, close to the outer surface of the specimen, even though the latter had dimensions in the mm range and was frozen by plunge freezing at ambient pressure.
However, a much coarser honeycomb-like microstruc-ture comprised of thicker tactoids was observed in region ~2!, as shown in Figure 3d. This coarse honeycomb-like microstructure is most likely an artifact because of the insufficient cooling rate reached in the interior of the sam-ple extending beyond about 100 mm from the outer surface of the sample to the center of the sample. Crystallization probably led to segregation of the initially well-dispersed tactoids, which became stacked at the grain boundaries of the ice crystals, resulting in a coarse honeycomb-like struc-ture, as indicated by the arrows in Figure 3d. This type of rearrangement is now utilized for preparation of ceramic green-bodies with columnar structures in a process denoted Figure 3. a: Cryo-scanning electron microscopy ~SEM! image of the high pressure frozen and freeze-fractured iron
ore–bentonite slurry, ~b! schematic drawing illustrating the location of regions ~1! and ~2! with different microstructural properties after plunge freezing a section of iron ore green pellet in liquid ethane, ~c! cryo-SEM image of the pellet in region ~1! ~the arrows indicate possible face-to-face association of smectite tactoids!, and ~d! cryo-SEM image of the pellet in region ~2! ~the arrows indicate the probable segregation of initially dispersed tactoids by ice crystallization and growth because of insufficient cooling rate in this region!. All images were recorded on a 1540XB CrossBeam cryo-SEM at 3 kV.
as freeze-casting ~Deville, 2008!. It is noteworthy that such coarse honeycomb-like microstructures for clays has been reported in numerous previous works on clays and soils. Yet, this coarse microstructure was probably an artifact because of an insufficient cooling rate of the sample.
The level of resolution achieved by cryo-SEM in this study does not allow determination of whether or not the use of tap and processing water influenced the thickness of the tactoids, as expected with the introduction of polyvalent ions at higher ionic strength ~Vali & Bachmann, 1988; Gu & Doner, 1993!. In fact, this must be considered since face-to-face association of tactoids can be distinguished as indicated by arrows in Figure 3c.
Dry Iron Ore Green Pellets
In order to identify bentonite in the dry iron ore pellets, scanning electron micrographs were recorded at a landing energy 1.50 keV using backscattered electrons with an
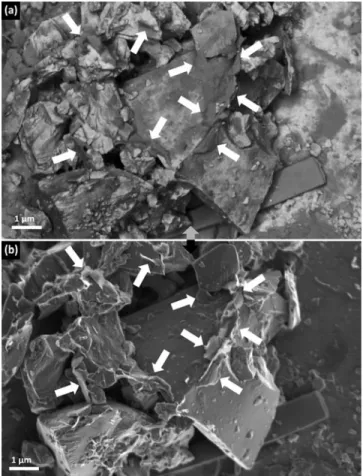
en-ergy in the range of 1.45–1.50 keV. These low-loss backscat-tered electrons are useful in distinguishing between regions of different composition in inorganic ~Gault et al., 2010! as well as organic materials ~Kim & Jaksch, 2009!. Two clearly different gray levels were obtained under these conditions, as shown in Figure 4a. EDS analysis of the area shown in Figure 4b confirmed that the bright gray phase corre-sponded to magnetite ~Fe-rich, Fig. 4c!, while the dark gray phase could be attributed to a thin layer of aluminosilicates ~Si, Al, and Mg-rich, Figs. 4d–4f!. These results illustrate the potential of using low-loss backscattered electrons to detect the thin smectite tactoids. Figure 5a shows a region with several magnetite grains imaged using low-loss backscat-tered electrons. Dark gray regions comprised of bentonite could be identified between the brighter magnetite parti-cles, as indicated by the white arrows. Subsequent imaging using the in-lens secondary electron detector shows that the bentonite between the magnetite grains has a flake-like morphology, most probably inherited from the dispersed clay tactoids ~Fig. 5b!. Therefore, it can be concluded that Figure 4. a: Low-loss backscattered electron image of iron ore
green pellet fracture surface revealing magnetite ~white gray! and aluminosilicates ~dark gray!. b: High magnification image of ~a! and ~c–f ! compositional maps of ~b! for Fe, Si, Al, and Mg,
respec-tively. ~a! and ~b! were recorded with the energy selective backscat-ter detector of a Merlin scanning electron microscope at a landing voltage of 1.50 kV and with the negatively biased filtering grid at 1.45 kV.
Figure 5. Scanning electron microscopy ~SEM! images of dry iron
ore pellet fracture surface: ~a! low-loss backscattered electron compositional images revealing bentonite as dark gray phase indi-cated by arrows, and ~b! secondary electron topographical image showing bentonite flakes forming bridges between magnetite par-ticles. ~a! was recorded with the energy selective backscatter detec-tor of a Merlin SEM at a landing voltage of 1.50 kV and with the negatively biased filtering grid at 1.45 kV. ~b! was recorded at 1.50 kV with the in-lens secondary detector.
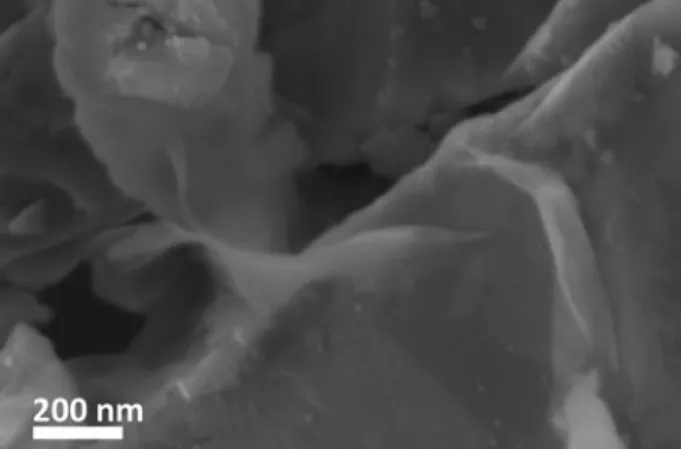
bentonite accumulates at the contact points between iron ore particles during drying, forming solid bridges, and improving the cohesiveness between iron ore grains in the pellet. Figure 6 shows such a bridge at higher magnification. The darker nuances of gray observed at the surface of magnetite particles in Figure 5a and the aluminosilicate layer identified in Figures 4a and 4b suggests that very finely divided aluminosilicates are formed by mechano-chemical action during processing of iron ore pellets.
C
ONCLUSIONSThe microstructure of bentonite in iron ore green pellets was studied using SEM and a combination of advanced imaging techniques. As-received bentonite was imaged at very high resolution and was found to consist of aggregated smectite flakes and calcium carbonate nanoparticles. The impact of plunge freezing on the microstructure of benton-ite in wet iron ore green pellets was investigated and com-pared with that obtained by HPF. The true microstructure of bentonite was preserved close to the outer surface of the section of the iron ore pellet prepared by plunge freezing. In this region, clay tactoids were very well dispersed and ap-peared to form a voluminous network occupying the space between mineral particles. When the pellet was dried, ben-tonite was drawn to the surface of the iron ore grains and to the contact points between the iron ore particles forming solid bridges, which eventually impart strength to the solid compact.
A
CKNOWLEDGMENTSVinnova, LKAB, and New Boliden are acknowledged for financial support of the project through the Agricola Re-search Center-Multi-component Mineral System ~ARC-MMS! program at Luleå University of Technology, Sweden. Centre of Advanced Mining and Metallurgy ~CAMM! is also acknowledged for financial support. The Knut and Alice Wallenberg Foundation is acknowledged for financial support of the Magellan SEM instrument. The authors also
wish to thank Adriaan van Aelst for his assistance with the cryo-Magellan SEM at the Wageningen Electron Micros-copy Centre ~WEMC!.
R
EFER ENCESBroughton, G. & Squires, L. ~1936!. The gelation of bentonite suspensions. J Phys Chem 40~8!, 1041–1053.
Callaghan, I.C. & Ottewill, R.H. ~1974!. Interparticle forces in montmorillonite gels. Faraday Discuss Chem Soc 57, 110–118. Chenu, C. & Tessier, D. ~1995!. Low temperature scanning
elec-tron microscopy of clay and organic constituents and their relevance to soil microstructures. Scan Microsc 9~4!, 989–1010. Deville, S. ~2008!. Freeze-casting of porous ceramics: A review of current achievements and issues. Adv Eng Mater 10~3!, 155–169. Forsmo, S.P.E. ~2007!. Influence of green pellet properties on pelletizing of magnetite iron ore. PhD Doctoral Thesis, Luleå University of Technology, Luleå. Available at http://epubl.ltu.se /1402-1544/2007/14/.
Forsmo, S.P.E., Apelqvist, A.J., Bjorkman, B.M.T. & Samskog, P.O. ~2006!. Binding mechanisms in wet iron ore green pellets with a bentonite binder. Powd Tech 169~3!, 147–158.
Freundlich, H. ~1928!. Ueber thixotropie. Colloid Polym Sci 46~4!, 289–299.
Frosien, J., Plies, E. & Anger, K. ~1989!. Compound magnetic and electrostatic lenses for low-voltage applications. J Vac Sci
Tech B 7~6!, 1874–1877.
Galway, M.E., Heckman, J.W., Hyde, G.J. & Fowke, L.C. ~1995!. Advances in high-pressure and plunge-freeze fixation. In
Meth-ods in Plant Cell Biology, Galbraith, D.W., Bohnert, H.J. &
Bourque, D.P. ~Eds.!, pp. 3–19. New York: Academic Press. Gault, B., Marquis, E.A., Saxey, D.W., Hughes, G.M.,
Mange-linck, D., Toberer, E.S. & Snyder, G.J. ~2010!. High-resolution nanostructural investigation of Zn4Sb3 alloys. Scripta
Mate-rialia 63~7!, 784–787.
Goldschmidt, V.M. ~1926!. Undersøkelser over lersedimenter.
Nordisk jordbrugsforskning 4–7, 434–445.
Goodeve, C.F. ~1939!. A general theory of thixotropy and viscos-ity. Trans Faraday Soc 35, 342–358.
Gu, B.H. & Doner, H.E. ~1993!. The microstructure of dilute clay and humic-acid suspensions revealed by freeze-fracture electron-microscopy—A reply. Clays Clay Miner 41~1!, 114–116. Guyonnet, D., Gaucher, E., Gaboriau, H., Pons, C.H.,
Cli-nard, C., Norotte, W. & Didier, G. ~2005!. Geosynthetic clay liner interaction with leachate: Correlation between permeabil-ity, microstructure, and surface chemistry. J Geotech Geoenviron
Eng 131~6!, 740–749.
Hauser, E.A. & Reed, C.E. ~1937!. Studies in thixotropy II. The thixotropic behavior structure of bentonite. J Phys Chem 41~7!, 911–934.
Henstra, A., Chmelik, J., Dingle, T., Mangnus, A. & van Veen, G. ~2009!. Versatile monochromator module for XHR SEM.
Microsc Microanal 15~S2!, 168.
Hofmann, U. & Hausdorf, A. ~1945!. Über das Sedimentvolumen und die Quellung von Bentonit. Colloid Polym Sci 110~1!, 1–17. Hohenberg, H., Mannweiler, K. & Muller, M. ~1994!. High-pressure freezing of cell-suspensions in cellulose capillary tubes.
J Microsc 175, 34–43.
Holzer, L., Munch, B., Rizzi, M., Wepf, R., Marschall, P. & Graule, T. ~2010!. 3D-microstructure analysis of hydrated bentonite with cryo-stabilized pore water. Appl Clay Sci
47~3–4!, 330–342. Figure 6. Scanning electron microscopy ~SEM! image of the
frac-ture surface of a dry iron ore pellet showing bentonite platelets forming bridges between magnetite particles.
Jaksch, H. & Martin, J.P. ~1995!. High-resolution, low-voltage SEM for true surface imaging and analysis. Fresenius J Anal
Chem 353~3–4!, 378–382.
Kawatra, S.K. & Ripke, S.J. ~2001!. Developing and understand-ing the bentonite fiber bondunderstand-ing mechanism. Miner Eng 14~6!, 647–659.
Kawatra, S.K. & Ripke, S.J. ~2002!. Effects of bentonite fiber formation in iron ore pelletization. Int J Miner Process 65~3–4!, 141–149.
Keren, R., Shainberg, I. & Klein, E. ~1988!. Settling and floccu-lation value of sodium-montmorillonite particles in aqueous media. Soil Sci Soc Am J 52~1!, 76–80.
Kim, K.W. & Jaksch, H. ~2009!. Compositional contrast of un-coated fungal spores and stained section-face by low-loss back-scattered electron imaging. Micron 40~7!, 724–729.
Lagaly, G. & Ziesmer, S. ~2003!. Colloid chemistry of clay miner-als: The coagulation of montmorillonite dispersions. Adv
Col-loid Interface Sci 100, 105–128.
Lambe, T.W. ~1953!. The structure of inorganic soil. Paper pre-sented at the Proc ASCE 79~1!, 1–49.
Luckham, P.F. & Rossi, S. ~1999!. The colloidal and rheological properties of bentonite suspensions. Adv Colloid Interface Sci
82~1–3!, 43–92.
McFarlane, A., Bremmell, K. & Addai-Mensah, J. ~2006!. Im-proved dewatering behavior of clay minerals dispersions via interfacial chemistry and particle interactions optimization. J
Colloid Interface Sci 293~1!, 116–127.
M’Ewen, M.B. & Pratt, M.I. ~1957!. The gelation of montmoril-lonite. Part 1—The formation of a structural framework in sols of Wyoming bentonite. Trans Faraday Soc 53, 535–547. Michael, J.R. ~2010!. Use of sample bias voltage for low-energy
high-resolution imaging in the SEM. Microsc Microanal 16~S2!, 614–615.
Michael, J.R., Joy, D.C. & Griffin, B.J. ~2009!. Challenges in achieving high resolution at low voltages in the SEM. Microsc
Microanal 15, 660–661.
Moor, H. ~1971!. Recent progress in the freeze-etching technique.
Phil Trans R Soc Lond B 261~837!, 121–131.
Moor, H. ~1987!. Theory and practice of high pressure freezing. In
Cryotechniques in Biological Electron Microscopy, Steinbrech,
R.A. & Zierold, K. ~Eds.!, pp. 175–191. Berlin: Springer-Verlag. Morris, G.E. & Zbik, M.S. ~2009!. Smectite suspension structural
behaviour. Int J Miner Process 93~1!, 20–25.
Mpofu, P., Addai-Mensah, J. & Ralston, J. ~2004!. Flocculation and dewatering behaviour of smectite dispersions: Effect of polymer structure type. Miner Eng 17~3!, 411–423.
Müllerová, I. & Frank, L. ~1993!. Very low energy microscopy in commercial SEMs. Scanning 15~4!, 193.
Murray, H.H. ~1991!. Overview—Clay mineral applications. Appl
Clay Sci 5~5–6!, 379.
Norrish, K. ~1954!. The swelling of montmorillonite. Discuss
Faraday Soc 18, 120.
Norrish, K. & Rausell-Colom, J.A. ~1963!. Low-angle X-ray diffraction studies of the swelling of montmorillonite and vermiculite. Clays Clay Miner 10~1!, 123.
Pusch, R. & Yong, R. ~2005!. Microstructure of Smectite Clays and
Engineering Performance. London, New York: Taylor & Francis.
Qiu, G.Z., Jiang, T., Fan, X.H., Zhu, D.Q. & Huang, Z.C. ~2004!. Effects of binders on balling behaviors of iron ore concentrates.
Scand J Metall 33~1!, 39–46.
Rand, B., Pekenc´, E., Goodwin, J.W. & Smith, R.W. ~1980!. Investigation into the existence of edge—Face coagulated struc-tures in Na-montmorillonite suspensions. J Chem Soc Faraday
Trans 1 76, 225–235.
Rosenqvist, I.T. ~1959!. Physico-chemical properties of soils: Soil-water system. J Soil Mech Fdns Div, Am Soc Civ Engrs 85, 31–53.
Ryan, K.P., Bald, W.B., Neumann, K., Simonsberger, P., Purse, D.H. & Nicholson, D.N. ~1990!. Cooling rate and ice-crystal measurement in biological specimens plunged into liquid eth-ane, propeth-ane, and freon-22. J Microsc 158, 365–378.
Segad, M., Hanski, S., Olsson, U., Ruokolainen, J., Akesson, T. & Jonsson, B. ~2012!. Microstructural and swelling properties of Ca and Na montmorillonite: ~In Situ! Observations with Cryo-TEM and SAXS. J Phys Chem C 116~13!, 7596–7601. Steigerwald, M.D.G. ~2004!. New detection system for GEMINI.
Microsc Microanal 10~S02!, 1372.
Steinbrecht, R.A. & Zierold, K. ~1987!. Cryotechniques in
Biolog-ical Electron Microscopy. Berlin, Heidelberg, New York:
Springer-Verlag.
Studer, D., Michel, M. & Muller, M. ~1989!. High-pressure freezing comes of age. Scan Microsc Suppl 3, 253–269. Studer, D., Michel, M., Wohlwend, M., Hunziker, E.B. &
Buschmann, M.D. ~1995!. Vitrification of articular-cartilage by high-pressure freezing. J Microsc 179, 321–332.
Terzaghi, K. ~1925!. Erdbaummechanik auf Bodenphysikalischer Grundlage. Franz Deuticke Press: Leipzig 399, ill.
Tessier, D., Lajudie, A. & Petit, J.C. ~1992!. Relation between the macroscopic behavior of clays and their microstructural prop-erties. Appl Geochem 7, 151–161.
Tessier, D. & Pedro, G. ~1982!. Electron microscopy study of Na smectite fabric—Role of layer charge, salt concentration and suction parameters. Int Clay Conf 1981, Proc. 7th Conf. Bologna/
Pavia, pp. 165–176.
Vali, H. & Bachmann, L. ~1988!. Ultrastructure and flow behav-ior of colloidal smectite dispersions. J Colloid Interface Sci
126~1!, 278–291.
Van Olphen, H. ~1956!. Forces between suspended bentonite particles. Clays Clay Miner 4, 204–224.
Van Olphen, H. ~1964!. An introduction to clay colloid chemistry.
Soil Sci 97~4!, 290.
Volzone, C. & Cavalieri, A.L. ~1996!. Influence of smectites on magnetite pellet strengths. J Mater Sci Lett 15~17!, 1532–1535. Weiss, A. ~1962!. Neuere Untersuchungen über die Struktur
thixo-troper Gele. Rheologica Acta 2~4!, 292–304.
Young, R., Templeton, T., Roussel, L.Y., Gestmann, I., van Veen, G., Dingle, T. & Henstra, S. ~2008!. Extreme high resolution SEM: A paradigm shift. Microsc Today 16~4!, 24. Zbik, M.S., Martens, W.N., Frost, R.L., Song, Y.F., Chen, Y.M. &
Chen, J.H. ~2008!. Transmission X-ray microscopy ~TXM! reveals the nanostructure of a smectite gel. Langmuir 24~16!, 8954–8958.