Heart rate variability does not discriminate between
different levels of haemodynamic responsiveness during
surgical anaesthesia
†M. Luginbu¨hl
1*, H. Yppa¨rila¨-Wolters
2, M. Ru¨fenacht
1, S. Petersen-Felix
1and I. Korhonen
21
Department of Anaesthesiology, University Hospital of Bern, University of Bern, Bern, Switzerland.
2
VTT Technical Research Centre of Finland, Tampere, Finland
*Corresponding author: Department of Anaesthesiology, University Hospital, CH-3010 Bern, Switzerland. E-mail: [email protected]
Background. Hypnotic depth but not haemodynamic responsiveness is measured with EEG-based monitors. In this study we compared heart rate variability (HRV) in unstimulated patients and stimulation-induced HRV at different levels of anaesthesia.
Methods. A total of 95 ASA I or II patients were randomly assigned to five groups (Group 1: BIS 45(5), remifentanil 1 ng ml21; Group 2: BIS 45(5), remifentanil 2 ng ml21; Group 3: BIS 45(5), remifentanil 4 ng ml21; Group 4: BIS 30(5), remifentanil 2 ng ml21; Group 5: BIS 60(5), remifentanil 2 ng ml21). A time- and frequency-domain analysis of the RR interval (RRI) from the electrocardiogram was performed. HRV before induction, before and after a 5 s tetanic stimulus of the ulnar nerve, and before and after tracheal intubation was compared between groups, between stimuli, and between responders to intubation [systolic arterial pressure (SAP) increase .20 mm Hg, a maximal heart rate (HR) after intubation .90 min21or both] and non-responders (ANOVA).
Results. Induction of anaesthesia significantly lowered HR and HRV. Mean RRI before stimu-lation was higher in G3 than in G1, G2, and G4 (P,0.001), whereas the other HRV parameters were similar. Intubation induced a greater HRV response than tetanic stimulation. The mean RRI after intubation was lower in G3 compared with the other groups and theSDof the RRI
after tetanic stimulation was lower in G3 compared with G5. Otherwise, unstimulated HRV and stimulation-induced HRV were similar in responders and non-responders.
Conclusion. HRV parameters discriminate between awake and general anaesthesia, are differ-ent after tracheal intubation and a 5 s ulnar nerve stimulation, but do not discriminate between different levels of haemodynamic responsiveness during surgical anaesthesia.
Br J Anaesth 2007; 98: 728–36
Keywords: anaesthetics i.v., propofol; analgesics opioid, remifentanil; heart, heart rate variability; monitoring, bispectral index; Poincare´ analysis
Accepted for publication: February 25, 2007
Although several types of hypnotic state monitors are now available,1 2there is no monitor measuring haemodynamic responsiveness to noxious stimulation during general anaesthesia. The EEG-based hypnotic state monitors do not provide parameters predictive of haemodynamic reac-tion or movement,3although the EEG response to noxious stimulation may reflect the analgesic drug concentration.4 Anaesthetic drug concentrations, although inversely corre-lated with the probability of a haemodynamic response, do not allow reliable prediction in every individual subject because of the variation in anaesthetic drug requirements.
A short electrical stimulation of the ulnar nerve elicits a short vasoconstriction, which is measurable with pulse plethysmography5or laser Doppler,6and is suppressed by increasing plasma concentrations of alfentanil5or sevoflur-ane.6 This concept of applying a defined sub-maximal noxious stimulus during general anaesthesia and using the pulse plethysmography signal as response failed to
†The data were presented in part at the annual meeting of the
European Society of Anaesthesiologists June 5 – 8, 2004, in Lisbon. doi:10.1093/bja/aem085 Advance Access publication April 27, 2007
improve the prediction of the haemodynamic response to tracheal intubation based on hypnotic depth and predicted effect site remifentanil concentration in a recent random-ized double-blinded study.7The same stimulus also elicits a short increase followed by a short decrease in the heart rate (HR), as measured with RR intervals (RRI). HR vari-ability (HRV) is known to discriminate between awake and sedated or anaesthetized patients.8
The purpose of this study was to compare linear and non-linear parameters of HRV in patients at different levels of haemodynamic responsiveness during surgical anaesthesia before and after two standardized noxious stimuli. We hypothesized that some HRV parameters would discrimi-nate between haemodynamic responsiveness at different levels of surgical anaesthesia, which were defined by differ-ent BIS levels and differdiffer-ent effect-site remifdiffer-entanil concen-trations in a previous study.7HRV data recorded during a previous study on pulse plethysmography,7 which was recently published in this journal, were evaluated.
Methods
PatientsData of the same, 95 ASA I or II patients enrolled in the pulse plethysmography study7 were evaluated. Patients with cardiovascular disease (e.g. arterial hypertension or antihypertensive treatment, cardiac, cerebrovascular, or peripheral vascular disease), any relevant pulmonary liver, kidney, or central nervous system disease, diabetes melli-tus, alcohol or drug abuse, patients with a difficult airway (i.e. Mallampati class 3 or higher), or patients unable to give informed consent were excluded.
Study plan
The study plan has been described previously in detail.7 Briefly, the premedicated patients (midazolam 7.5 mg orally 30 min before induction) were monitored with ECG, non-invasive blood pressure cuff, and pulse oximeter (Datex AS3 monitor, Datex-Ohmeda, Instrumentarium Corporation, Helsinki, Finland). A venous cannula was inserted in the non-dominant arm. An A-2000 XP-BIS monitor (BIS software version 3.3, Aspect Medical Systems, Nattick, CA, USA) was installed with the sensor placed frontally, according to the manufacturer’s instructions.
Skin electrodes for electrical stimulation of the ulnar nerve were placed on the dominant arm 15 and 23 cm distal to the cubital fold,6 and connected to a Digitimer DS7 constant current stimulator with a Digitimer DG2 trigger generator (Digitimer LTD, Hertfordshire, UK) and a timer device (constructed in our laboratory) with the positive pole attached proximally.
Before induction, the patients were randomly assigned to five treatment groups differing in target BIS level, and in remifentanil bolus and infusion rates using a stratified
randomization protocol. In Groups 1 – 3, a propofol target-controlled infusion (Diprifusorw, AstraZeneca, Grafenau, Switzerland) was titrated to achieve a BIS level of 45(5), whereas in Groups 4 and 5 the target BIS levels were 30(5) and 60(5), respectively. In Groups 1 – 3, remifentanil was administered with an initial bolus of 0.2, 0.4, and 0.8 mg kg21 immediately followed by an infusion of 0.04, 0.08, and 0.2 mg kg21min21, respectively. In Groups 4 and 5, the remifentanil bolus was 0.4 mg kg21 and the infusion rate was 0.08 mg kg21min21.
After recording of baseline data for 5 min, the selected bolus of remifentanil was given by i.v., and the related remifentanil infusion was started immediately, followed by a target-controlled infusion of propofol. The target plasma propofol concentration was adjusted to achieve and main-tain the selected BIS level. Muscle relaxation was achieved with vecuronium 0.15 mg kg21i.v., injected after loss of consciousness. After the requested effect of vecuro-nium was verified by train-of-four (suppression of at least three of four twitches), a 5 s, 60 mA, 50 Hz, and 0.25 ms square-wave electrical stimulus7 9was applied to the ulnar nerve. After arterial pressure and HR had returned to the pre-stimulation level, an experienced anaesthetist blinded to the anaesthetic drug doses and the BIS level performed orotracheal intubation. During the study, arterial pressure was measured non-invasively (oscillometric method) at 1 min intervals (arterial pressure cuff on the arm opposite the pulse oximeter probe). The study was terminated 5 min after tracheal intubation.
Data recording
Arterial pressure, HR, end-tidal CO2, and SpO2 were
recorded on a laptop computer every 10 s. The BIS values from the A2000 monitor were recorded every 5 s. The quality of visualization of the vocal cords according to Wilson and colleagues10 and the duration of intubation were recorded. Patients with prolonged intubation (.45 s) were excluded from the study. The infusion rate of remi-fentanil was also recorded on a laptop computer every 10 s. The target plasma propofol concentration before tra-cheal intubation was recorded manually. The ECG signal was digitized at 128 Hz (A/D conversion card, National Instruments Corporation, Austin, TX, USA) for off-line analysis.
Time of induction was defined as the start of the propo-fol infusion, time of stimulations as start of tetanic stimu-lation, and time of intubation as start of laryngoscopy. Heart rate (beats min21), systolic and diastolic arterial pressure (mm Hg), and BIS values were extracted from the files, and the mean (SD) value was calculated for the 120 s periods before induction, before stimulation (with stable anaesthetic drug concentrations), and before laryngoscopy. The maximal HR, arterial pressure, and BIS in the 300 s after intubation were determined. An increase in SAP by .20 mm Hg compared with pre-laryngoscopy, a maximal
Heart rate variability and haemodynamic responsiveness
HR after intubation .90 or both were defined as a response to tracheal intubation.7 11The effect-site remifen-tanil concentration at stimulation and intubation was com-puted from the recorded dosing history using the pharmacokinetic and pharmacodynamic parameter set of Minto and colleagues.12
Analysis of HRV
The R-waves of the ECG were detected automatically. This automatic detection was later verified visually, and separated arrhythmia, misclassified beats or both were manually corrected. A beat-to-beat RR interval (RRI) signal was constructed as a series of time differences between the successive R-waves.
The recorded signals from the pre-induction (120 – 60 s before the start of propofol), the pre-stimulation (60 – 0 s before tetanic stimulation), the post-stimulation (0 – 60 s after stimulation onset), the pre-intubation (60 – 0 s before start of laryngoscopy), and the post-intubation (0 – 180 s after intubation) periods were analysed off-line.
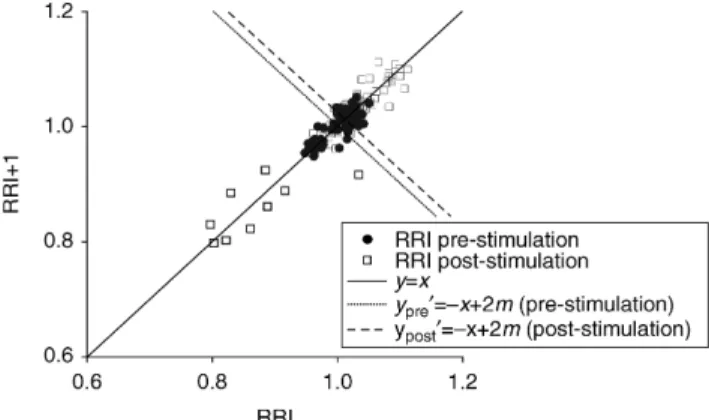
Heart rate variability was quantified with time- and frequency-domain parameters.13 14 The computed time-domain parameters were mean RRI, RRI standard devi-ation (RRI SD), and root of mean squared difference between successive RRI (RMSSD). The frequency-domain parameters—low-frequency (LF) power (0.04 – 0.15 Hz), high-frequency (HF) power (0.15 – 0.4 Hz), the LF/HF ratio, spectral entropy of RRI (0.04 – 0.4 Hz), HF spectral entropy (0.12 – 0.4 Hz)—and the amplitude of RRI varia-bility (RRI amplitude) were computed. The quantitative Poincare´ analysis was carried out as described by Tulppo and colleagues.14 In this analysis, RRI is plotted on an x – y plane (Fig. 1) so that the current RRI (on the y-axis) is related to the previous RRI (on the x-axis). This analysis provides a qualitative way of detecting deterministic pat-terns in complex data. For quantitative analysis of the plot, the standard deviations of the Poincare´ plot against the axes y¼x (SD1) and y0¼2x þ 2m (SD2), where m is the mean RRI during the epoch of interest, and their ratio
(SD1/SD2) were calculated. SD1 mainly describes the fast beat-to-beat HRV, whileSD2 describes slower components of HRV.14
Statistics
The randomization procedure has been described pre-viously.7 The HRV values after the events (induction, stimulation, and intubation) were normalized to the pre-event values by dividing the post-event values by the pre-event values. The post-induction window corresponded to the pre-stimulation window.
A two-way analysis of variance on ranks was performed to detect the induction effect and the group effect on the normalized HRV parameters. Repeated measurements of two-way analysis of variance on ranks with multiple pair-wise comparisons among groups (Holm – Sidak test) was performed on the normalized HRV parameters to detect a stimulus effect (tetanic stimulation of ulnar nerve, tracheal intubation) and the group effect. P,0.05 was considered statistically significant. SigmaStat for Windows Version 3.0 (SPSS Inc., Chicago, IL, USA) was used for the stat-istical analyses.
The different event-induced HRV variables in respon-ders and non-responrespon-ders to tracheal intubation were com-pared with a Mann – Whitney rank test. A logistic regression analysis was performed to determine the predic-tive value on the responder status of the following vari-ables: the BIS value, the predicted effect-site remifentanil concentration, the predicted plasma propofol concen-tration, and the HRV parameters related to tetanic stimu-lation, which were significantly different between responders and non-responders.
Results
PatientsA total of 95 patients (57 women and 38 men) were enrolled. The characteristics of the five treatment groups were similar (Table 1). Two patients of Group 1 were excluded from data analysis because of serious arrhyth-mias throughout the study. Various additional subjects were excluded from the analysis of induction and stimu-lation (see below).
Anaesthetic drug concentrations, BIS levels, and response to intubation
The computed effect-site remifentanil concentrations, the BIS levels before laryngoscopy, the SAP and mean arterial pressure (MAP), HRs before induction and before laryngo-scopy, the quality of vocal cord visualization, and duration of laryngoscopy and intubation are presented in Table 2. The increase in SAP, MAP, and HR in response to tracheal intubation and thus the probability of a response to tra-cheal intubation (SAP increase .20 mm Hg or maximal
Fig 1 Poincare´ plot of the heart rate (HR) response to tetanic stimulation. RR intervals (RRI) of the pre- and post-stimulation window.
HR .90 min21) were significantly different among groups (one-wayANOVAand x2test P,0.001, respectively).
HRV before and after induction: comparison among treatment groups
Because of bad data quality in the pre-induction window, eight additional patients of Groups 2 – 5 were excluded, leaving data of 85 patients for analysis (Tables 3 and 4). All HRV parameters (time domain and frequency domain) except for the ratio of Poincare´SD1/SD2 and LF/HF power were significantly different before and after induction (stable anaesthetic conditions, Tables 3 and 4). Except for mean RRI, which was significantly higher in Group 3 than in Groups 1, 2, and 4, reflecting the lower HR in the sub-jects with the highest remifentanil concentration, the HRV parameters after induction were similar among the groups.
Stimulation-induced HRV: stimulation and group effect
For the analysis of the effect of tetanic simulation, no further subjects were excluded, so that data of 93 patients
were analysed. For the analysis of the effect of tracheal intubation, four additional subjects of Group 1 were excluded because of prolonged intubation (.45 s) and a further seven subjects were excluded because of insuffi-cient data quality in the pre-intubation window. The effect of tracheal intubation on HRV was therefore analysed in 82 subjects (Tables 5 and 6).
Tetanic stimulation induced a smaller HRV response (RRI SD and Poincare´ SD2) in Group 3 compared with Group 5, whereas spectral entropy was higher in Group 2 than in all other groups after tetanic stimulation (Tables 5 and 6).
Tracheal intubation induced a stronger HRV response than the 5 s tetanic stimulation of the ulnar nerve, in all parameters of HRV except for root mean squared SD of RRI and Poincare´ SD1 (Tables 5 and 6). There was a sig-nificant interaction between group effect and stimulation effect, implying that the group effect was stimulation dependent. Mean RRI after tracheal intubation was signifi-cantly higher in Group 3 compared with Groups 1, 2, and 5, indicating that intubation induced less tachycardia in subjects with the highest remifentanil concentrations.
Table 1Characteristics of the study population. The data are given as mean (SD) or numbers of patients. Groups were compared with one-wayANOVAand x2as appropriate. SAP, systolic arterial pressure; DAP, diastolic arterial pressure; HR, heart rate
Group 1 Group 2 Group 3 Group 4 Group 5 P-values
Age 38.2(8.9) 40.9(10.5) 39.1(10.1) 35.8(9.0) 40.5(11.0) 0.639 Gender (M/F) 8/9 7/12 7/12 8/11 8/11 0.991 Weight (kg) 70.2(13.6) 68.4(11.6) 69.3(13.2) 69.1(14.9) 74.9(17.1) 0.654 BMI 24.1(3.5) 23.9(3.8) 23.8(3.2) 22.9(3.1) 25.4(4.2) 0.335 ASA I/II 14/3 14/5 16/3 14/5 16/3 0.797 SAP ward (mm Hg) 120(9) 118(12) 118(14) 122(12) 120(12) 0.889 DAP ward (mm Hg) 79(8) 74(8) 75(9) 74(8) 76(10) 0.661 HR ward (min21) 72(10) 75(6) 75(8) 74(12) 73(10) 0.904
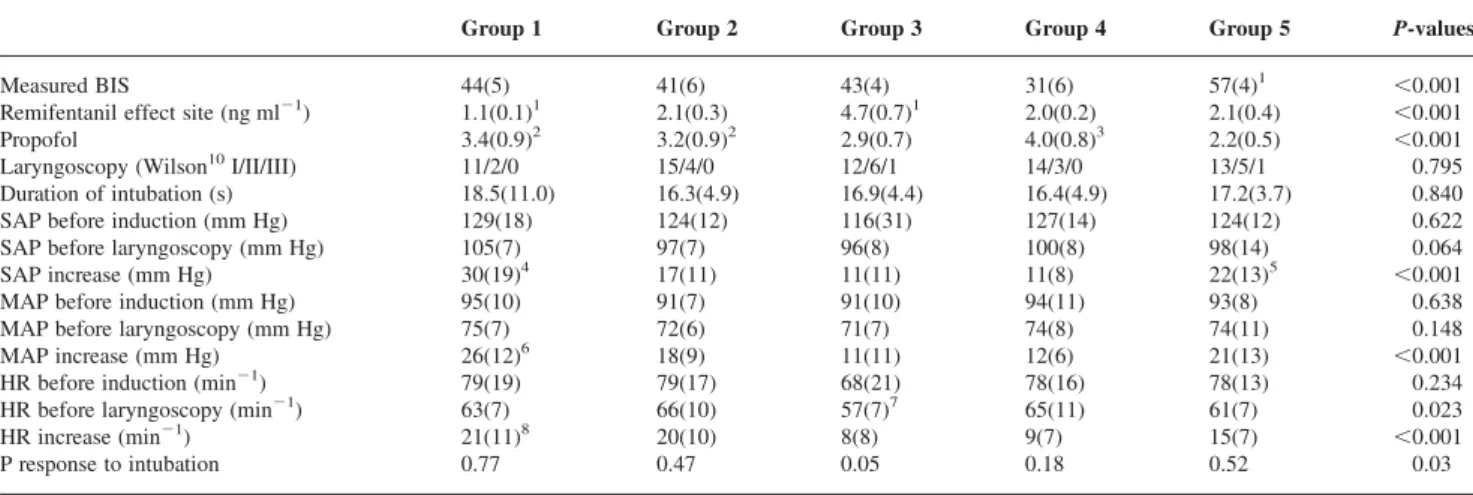
Table 2BIS level, predicted effect-site remifentanil concentrations, predicted plasma propofol concentrations, and haemodynamic response to intubation.7 Numbers are mean (SD). BIS, BIS level before tracheal intubation; Remifentanil, predicted effect-site remifentanil concentration (ng ml21); Propofol, predicted plasma propofol concentration (mg ml21) before laryngoscopy; P response to intubation, probability of haemodynamic response defined as increase of SAP .20 mm Hg compared with pre-laryngoscopy, a maximal heart rate after intubation or both .90 min21; SAP, systolic arterial pressure; MAP, mean arterial pressure; HR, heart rate; SAP-, MAP-, and HR-increase, maximum value after intubation—mean value during 120 s before intubation. One-wayANOVAon ranks with multiple pairwise comparisons (Dunn’s test):1P , 0.05 compared with all other treatment groups.2P,0.05 compared with Group 5,3P,0.05 compared with Groups 3 and 5,4P,0.05 compared with Groups 2 and 3,5P,0.05 compared with Group 3,6P,0.05 compared with Groups 3 and 4,7P,0.05 compared with Groups 2 and 4,8P,0.05 compared with Group 3
Group 1 Group 2 Group 3 Group 4 Group 5 P-values
Measured BIS 44(5) 41(6) 43(4) 31(6) 57(4)1 ,0.001
Remifentanil effect site (ng ml21) 1.1(0.1)1 2.1(0.3) 4.7(0.7)1 2.0(0.2) 2.1(0.4) ,0.001
Propofol 3.4(0.9)2 3.2(0.9)2 2.9(0.7) 4.0(0.8)3 2.2(0.5) ,0.001
Laryngoscopy (Wilson10I/II/III) 11/2/0 15/4/0 12/6/1 14/3/0 13/5/1 0.795
Duration of intubation (s) 18.5(11.0) 16.3(4.9) 16.9(4.4) 16.4(4.9) 17.2(3.7) 0.840
SAP before induction (mm Hg) 129(18) 124(12) 116(31) 127(14) 124(12) 0.622
SAP before laryngoscopy (mm Hg) 105(7) 97(7) 96(8) 100(8) 98(14) 0.064
SAP increase (mm Hg) 30(19)4 17(11) 11(11) 11(8) 22(13)5 ,0.001
MAP before induction (mm Hg) 95(10) 91(7) 91(10) 94(11) 93(8) 0.638
MAP before laryngoscopy (mm Hg) 75(7) 72(6) 71(7) 74(8) 74(11) 0.148
MAP increase (mm Hg) 26(12)6 18(9) 11(11) 12(6) 21(13) ,0.001
HR before induction (min21) 79(19) 79(17) 68(21) 78(16) 78(13) 0.234
HR before laryngoscopy (min21) 63(7) 66(10) 57(7)7 65(11) 61(7) 0.023
HR increase (min21) 21(11)8 20(10) 8(8) 9(7) 15(7) ,0.001
P response to intubation 0.77 0.47 0.05 0.18 0.52 0.03
Heart rate variability and haemodynamic responsiveness
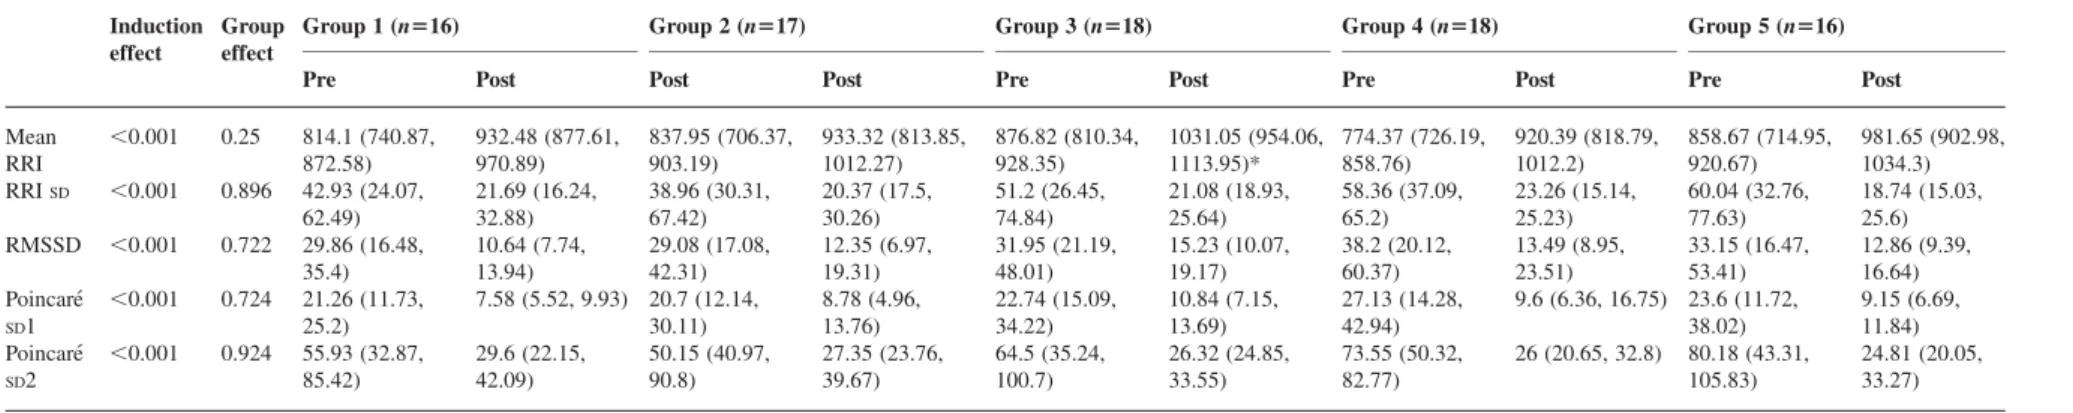
stimulation of the ulnar nerve (after induction, under stable anaesthetic conditions, Post). Numbers are median (inter-quartile range). Mean RRI, mean RR interval; RRISD, standard deviation of RRI; RMSSD, root mean-squared standard deviation of RRI; Poincare´SD1 and Poincare´SD2 (see Fig. 2 for details). Two-way ANOVA on ranks with multiple pairwise comparison among groups to detect induction effect and group effect (Holm – Sidak test). *Group effect: P,0.05 compared with Groups 1, 2, and 4
Induction effect
Group effect
Group 1 (n516) Group 2 (n517) Group 3 (n518) Group 4 (n518) Group 5 (n516)
Pre Post Post Post Pre Post Pre Post Pre Post
Mean RRI ,0.001 0.25 814.1 (740.87, 872.58) 932.48 (877.61, 970.89) 837.95 (706.37, 903.19) 933.32 (813.85, 1012.27) 876.82 (810.34, 928.35) 1031.05 (954.06, 1113.95)* 774.37 (726.19, 858.76) 920.39 (818.79, 1012.2) 858.67 (714.95, 920.67) 981.65 (902.98, 1034.3) RRISD ,0.001 0.896 42.93 (24.07, 62.49) 21.69 (16.24, 32.88) 38.96 (30.31, 67.42) 20.37 (17.5, 30.26) 51.2 (26.45, 74.84) 21.08 (18.93, 25.64) 58.36 (37.09, 65.2) 23.26 (15.14, 25.23) 60.04 (32.76, 77.63) 18.74 (15.03, 25.6) RMSSD ,0.001 0.722 29.86 (16.48, 35.4) 10.64 (7.74, 13.94) 29.08 (17.08, 42.31) 12.35 (6.97, 19.31) 31.95 (21.19, 48.01) 15.23 (10.07, 19.17) 38.2 (20.12, 60.37) 13.49 (8.95, 23.51) 33.15 (16.47, 53.41) 12.86 (9.39, 16.64) Poincare´ SD1 ,0.001 0.724 21.26 (11.73, 25.2) 7.58 (5.52, 9.93) 20.7 (12.14, 30.11) 8.78 (4.96, 13.76) 22.74 (15.09, 34.22) 10.84 (7.15, 13.69) 27.13 (14.28, 42.94) 9.6 (6.36, 16.75) 23.6 (11.72, 38.02) 9.15 (6.69, 11.84) Poincare´ SD2 ,0.001 0.924 55.93 (32.87, 85.42) 29.6 (22.15, 42.09) 50.15 (40.97, 90.8) 27.35 (23.76, 39.67) 64.5 (35.24, 100.7) 26.32 (24.85, 33.55) 73.55 (50.32, 82.77) 26 (20.65, 32.8) 80.18 (43.31, 105.83) 24.81 (20.05, 33.27)
Table 4HRV before and after induction: induction effect and group effect measured with frequency-domain parameters. Heart rate variability before induction of anaesthesia (Pre) and before tetanic stimulation of the ulnar nerve (after induction, under stable anaesthetic conditions, Post). Numbers are median (inter-quartile range). LF power, low-frequency power of RRI variability (0.04 – 015 Hz); HF power, high-frequency power of RRI variability (0.15 – 0.4 Hz); LF/HF ratio, ratio of low- to high-frequency power; entropy, spectral entropy of RRI variability (0.04 – 0.4 Hz); HF entropy, high-frequency spectral entropy (0.12 – 0.4 Hz). Two-way ANOVAon ranks with multiple pairwise comparisons among groups to detect induction effect and group effect (Holm – Sidak test)
Induction effect
Group effect
Group 1 (n516) Group 2 (n517) Group 3 (n518) Group 4 (n518) Group 5 (n516)
Pre Post Pre Post Pre Post Pre Post Pre Post
LF power ,0.001 0.464 57.54 (10.6, 89.1) 6.16 (2.26, 19.32) 44.69 (16.37, 72.62) 8.62 (3.36, 27.85) 47.32 (8.83, 214.01) 5.17 (3.37, 7.46) 85.09 (32.21, 144.5) 7.31 (3.28, 10.31) 120.57 (35.45, 228.51) 4.75 (3.94, 12.33) HF power ,0.001 0.641 26.51 (2.38, 40.02) 1.98 (0.84, 3.49) 26.31 (3.08, 54.17) 3.88 (1.18, 7.54) 18.64 (7.72, 47.77) 4.61 (1.78, 9.41) 29.66 (6.65, 120.25) 5.77 (1.5, 7.86) 29.36 (7.73, 121.44) 2.17 (1.68, 3.89) LF/HF ratio 0.068 0.462 2.91 (1.58, 6.99) 2.77 (0.95, 7.52) 1.97 (0.92, 4.98) 2.7 (1.45, 5.95) 2.0 (0.83, 8.77) 0.98 (0.43, 2.6) 3.55 (1.54, 7.67) 1.99 (1.07, 2.48) 6.64 (1.64, 9.82) 2.71 (1.28, 4.31) Entropy ,0.001 0.679 0.78 (0.71, 0.87) 0.83 (0.79, 0.88) 0.77 (0.69, 0.85) 0.81 (0.71, 0.87) 0.79 (0.67, 0.89) 0.84 (0.77, 0.87) 0.76 (0.72, 0.81) 0.85 (0.81, 0.88) 0.73 (0.68, 0.8) 0.85 (0.79, 0.87) HF entropy ,0.001 0.502 0.83 (0.75, 0.86) 0.86 (0.81, 0.9) 0.8 (0.73, 0.84) 0.84 (0.81, 0.88) 0.81 (0.75, 0.9) 0.84 (0.8, 0.89) 0.82 (0.76, 0.88) 0.87 (0.8, 0.92) 0.79 (0.77, 0.84) 0.86 (0.81, 0.88) Luginbu ¨hl et al. 732
Table 5Stimulation-induced HRV: stimulus and group effects, group – stimulus interaction in time-domain parameters. Numbers are median (inter-quartile range) of post-stimulation values normalized to pre-stimulation values (post-stimulation/pre-stimulation). TET, tetanic stimulation of the ulnar nerve (n¼94); INT, tracheal intubation (n¼82). Two-wayANOVAon ranks with stimulus type, group, and group – stimulus interaction as factors and normalized post-stimulation HRV variables as dependant variables.†P-values of two-wayANOVAon ranks for group effects, stimulus effects, and group – stimulus interaction. One-wayANOVAon ranks: group effects at each stimulus: *P,0.05 compared with Groups 1, 2, and 5; **P,0.05 compared with Group 5. Significant values are highlighted bold-italic
Group effect† Stimulus effect† G – S interaction† Group 1 (TET, n517) (INT, n512) Group 2 (TET, n519) (INT, n518) Group 3 (TET, n519) (INT, n518) Group 4 (TET, n5 9) (INT, n516)
Group 5 (TET, n519) (INT, n518)
TET INT TET INT TET INT TET INT TET INT
Mean RRI 0.133 <0.001 0.038 1.015 (0.996, 1.035) 0.894 (0.854, 0.962) 1.017 (0.995, 1.025) 0.909 (0.832, 0.968) 1.007 (1.001, 1.02) 0.961 (0.946, 1.021)* 1.012 (1.004, 1.023) 0.938 (0.901, 0.997) 1.011 (0.996, 1.021) 0.913 (0.871, 0.947) RRISD 0.053 < 0.001 0.042 1.671 (1.266, 2.281) 2.41 (1.647, 3.826) 1.566 (1.187, 2.107) 3.531 (2.148, 4.445) 1.354 (1.088, 1.704)** 2.278 (1.823, 3.589) 1.615 (1.459, 2.025) 1.943 (1.389, 2.593) 2.314 (1.702, 3.087) 2.448 (1.729, 2.873) RMSSD 0.865 0.132 0.200 1.148 (0.948, 1.623) 1.128 (0.879, 1.428) 1.23 (1.008, 1.376) 1.018 (0.679, 1.665) 1.094 (0.995, 1.266) 1.233 (1.13, 1.729) 1.2 (1.126, 1.584) 0.985 (0.811, 1.163) 1.402 (0.99, 1.952) 1.082 (0.924, 1.854) Poincare´SD1 0.876 0.123 0.200 1.148 (0.954, 1.63) 1.122 (0.875, 1.42) 1.23 (1.009, 1.375) 1.019 (0.674, 1.646) 1.091 (0.995, 1.263) 1.225 (1.124, 1.722) 1.197 (1.126, 1.58) 0.994 (0.806, 1.156) 1.39 (0.988, 1.954) 1.082 (0.919, 1.843) Poincare´SD2 0.082 < 0.001 0.034 1.776 (1.254, 2.357) 2.53 (1.653, 4.046) 1.629 (1.234, 2.217) 3.669 (2.276, 4.94) 1.373 (1.119, 1.835)** 2.63 (2.007, 3.884) 1.702 (1.521, 2.23) 2.026 (1.537, 2.868) 2.353 (1.903, 3.26) 2.581(1.803, 3.036)
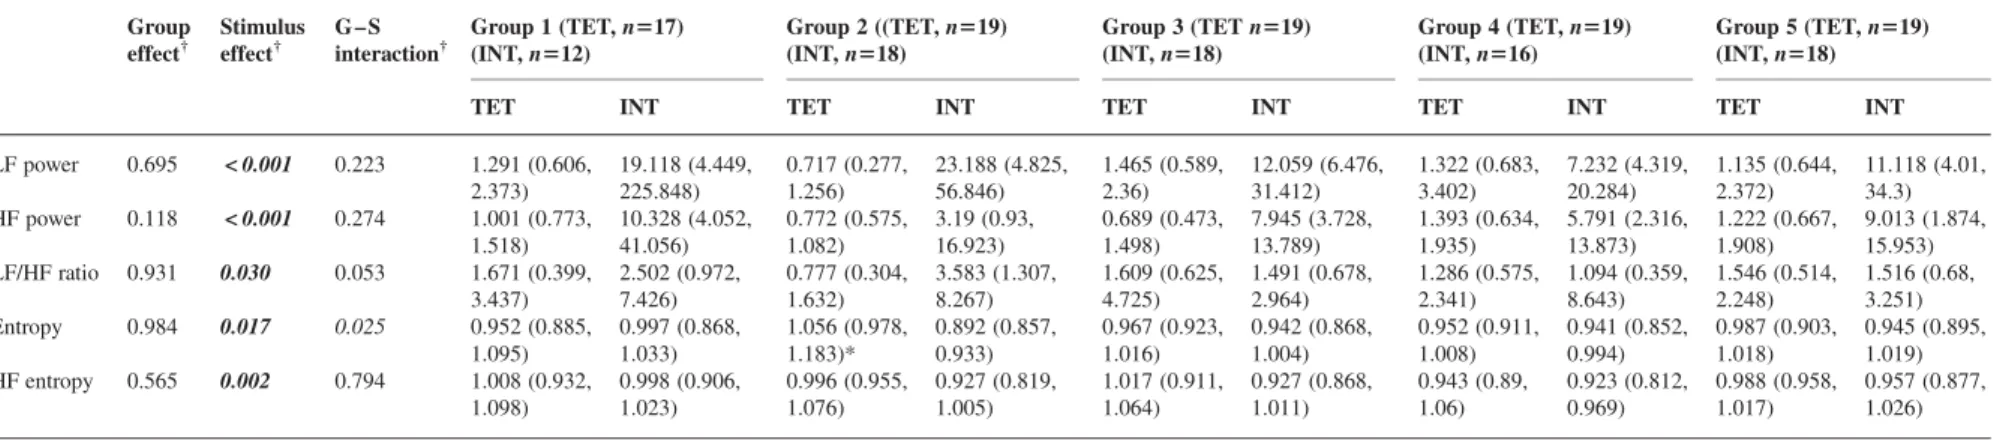
Table 6 Stimulation-induced HRV: stimulus and group effects, group – stimulus interaction in frequency-domain parameters. Numbers are median (inter-quartile range) of post-stimulation values normalized to pre-stimulation values (post-stimulation/pre-stimulation). TET, tetanic stimulation of the ulnar nerve (n¼94); INT, tracheal intubation (n¼82). Two-wayANOVAon ranks with stimulus type, group, and group – stimulus interaction as factors and normalized post-stimulation HRV variables as dependant variables.†P-values of two-wayANOVAon ranks for group effects, stimulus effects, and group – stimulus interaction. One-wayANOVAon ranks: group effects at each stimulus: *P , 0.05 compared with Groups 1, and 3 – 5. Significant values are highlighted bold-italic
Group effect† Stimulus effect† G – S interaction† Group 1 (TET, n517) (INT, n512) Group 2 ((TET, n519) (INT, n518) Group 3 (TET n519) (INT, n518) Group 4 (TET, n519) (INT, n516) Group 5 (TET, n519) (INT, n518)
TET INT TET INT TET INT TET INT TET INT
LF power 0.695 < 0.001 0.223 1.291 (0.606, 2.373) 19.118 (4.449, 225.848) 0.717 (0.277, 1.256) 23.188 (4.825, 56.846) 1.465 (0.589, 2.36) 12.059 (6.476, 31.412) 1.322 (0.683, 3.402) 7.232 (4.319, 20.284) 1.135 (0.644, 2.372) 11.118 (4.01, 34.3) HF power 0.118 < 0.001 0.274 1.001 (0.773, 1.518) 10.328 (4.052, 41.056) 0.772 (0.575, 1.082) 3.19 (0.93, 16.923) 0.689 (0.473, 1.498) 7.945 (3.728, 13.789) 1.393 (0.634, 1.935) 5.791 (2.316, 13.873) 1.222 (0.667, 1.908) 9.013 (1.874, 15.953) LF/HF ratio 0.931 0.030 0.053 1.671 (0.399, 3.437) 2.502 (0.972, 7.426) 0.777 (0.304, 1.632) 3.583 (1.307, 8.267) 1.609 (0.625, 4.725) 1.491 (0.678, 2.964) 1.286 (0.575, 2.341) 1.094 (0.359, 8.643) 1.546 (0.514, 2.248) 1.516 (0.68, 3.251) Entropy 0.984 0.017 0.025 0.952 (0.885, 1.095) 0.997 (0.868, 1.033) 1.056 (0.978, 1.183)* 0.892 (0.857, 0.933) 0.967 (0.923, 1.016) 0.942 (0.868, 1.004) 0.952 (0.911, 1.008) 0.941 (0.852, 0.994) 0.987 (0.903, 1.018) 0.945 (0.895, 1.019) HF entropy 0.565 0.002 0.794 1.008 (0.932, 1.098) 0.998 (0.906, 1.023) 0.996 (0.955, 1.076) 0.927 (0.819, 1.005) 1.017 (0.911, 1.064) 0.927 (0.868, 1.011) 0.943 (0.89, 1.06) 0.923 (0.812, 0.969) 0.988 (0.958, 1.017) 0.957 (0.877, 1.026) Heart ra te variability and haemodyn amic responsiv eness 733
The grand averages of RRI before and after tetanic stimulation and tracheal intubation in the five treatment groups are presented in Figures 2 and 3.
HRV: comparison between responders and non-responders to tracheal intubation
Of the 91 patients with uneventful intubation, 35 were responders and 56 were non-responders. Of 82 patients
included in the analysis of intubation-induced HRV, 31 were responders and 51 were non-responders. A total of 17 patients showed purely an arterial pressure response, 6 purely a HR response, and 8 a combined response.
HRV before ulnar nerve stimulation and before the start of laryngoscopy (i.e. unstimulated HRV) were similar in responders and non-responders to tracheal intubation (data not shown). The mean (inter-quartile range) normalized RRI after intubation in responders and non-responders was 0.867 (0.825 – 0.912) and 0.959 (0.914 – 1.001), respect-ively (P,0.001; i.e. responders became more tachycardic than non-responders). The other parameters of HRV response were similar (data not shown).
The HRV induced by ulnar nerve stimulation was also similar in responders and non-responders (data not shown). In the logistic regression analysis the BIS level, the predicted effect-site remifentanil concentration and the predicted plasma propofol concentration but not HRV variables were kept as independent parameters. The BIS level and the predicted effect-site remifentanil concentration, but not the propofol concentration, were significant predictors of the responder status. The logistic regression equation to calculate the probability of response was therefore similar to a previously published equation.7
Discussion
Induction of general anaesthesia significantly and substan-tially changed HRV. Different levels of haemodynamic responsiveness during general anaesthesia expressed by the post-hoc probability of blood pressure and HR response were not reflected by any parameter of HRV, except that patients with high remifentanil concentrations were more bradycardic. TheSD of the RRI after induction, the Poincare´ SD1 and SD2, and the RMSSD of RRI were lower and the entropy of RRI was higher after induction, reflecting a reduced HRV compared with the awake state. The LF and the HF power significantly decreased, with the LF/HF power ratio decreasing in Groups 3 – 5 and increas-ing in Groups 1 and 2. The stimulation-induced HRV response was similar among the groups, but dependent on the stimulus intensity; intubation induced a stronger HR response (reflected by most of the parameters) than the 5 s ulnar nerve stimulation. Responders and non-responders to tracheal intubation had similar HRV parameters except for a lower post-intubation HR in non-responders. The predic-tion of the response to tracheal intubapredic-tion estimated from the pre-intubation BIS level and effect-site remifentanil concentration was not improved by adding HRV parameters.
HRV reflects autonomic nervous system activity and is affected by anaesthesia. Several linear and non-linear methods have been used to assess HRV. The most fre-quently used linear method is the (frequency domain)
Fig 2 The grand average values of RRI before and after tetanic stimulation of the ulnar nerve are plotted for each group. The RRI are normalized to the mean RRI before stimulation (measured RRI/mean RRI before stimulation). The stimulation induced first a short decrease of RRI (¼increase of heart rate), which was equal in all groups, followed by an increase (¼decrease of heart rate). The difference in increase among the groups visible on the plot was not statistically significant.
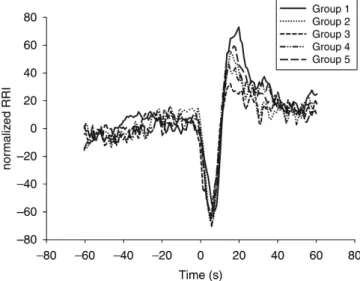
Fig 3 The grand average values of RRI before and after tracheal intubation. The stimulation-induced RRI is similar among the five treatment groups. The RRI are normalized to the mean RRI before intubation (measured RRI/mean RRI before intubation). Intubation was followed by a decrease of RRI (¼tachycardia), which was significantly smaller in Group 3 (P , 0.05).
power spectral analysis of RRI, defining a LF band between 0.04 and 0.15 Hz, and a HF band between 0.15 and 0.4 or 0.5 Hz.15Another linear method calculates RRI SD and RMSSD of HRV (time-domain parameters). Non-linear methods such as spectral entropy or Poincare´ analysis, in contrast to linear methods, are better suited for non-stationary signals as may occur in patients under noxious stimulation.16
Our results on the induction effect confirm a previous study using power spectral analysis of HRV. In that study, total power, LF power (representing sympathetic tone) and HF power (representing parasympathetic tone), the LF/HF ratio, and the HR entropy were significantly reduced in propofol sedated spontaneously breathing patients (OAA/S 3) compared with awake patients.17
Other studies have reported partially conflicting results on induction-induced HRV. Induction with propofol (to a BIS level of 30) reduced HF but not LF power and LF/HF ratio, induction with sevoflurane reduced LF but not HF power, whereas entropy was reduced with both induction methods in patients under assisted spontaneous respir-ation.8 Thiopenthal or etomidate induction markedly reduced both LF power and HF power of HRV,18 whereas induction with midazolam and intermediate to high-dose fentanyl in cardiac surgery patients only decreased LF power independent of the dose.19 Conversely, midazolam sedation in ICU patients dose-dependently reduced HRV (frequency-domain parameters) correlating with the Ramsay score.20The clinical meaning of a change in HRV at induction of anaesthesia is limited, because the effect of induction agents is monitored clinically and eventually by EEG-derived parameters.
Because opioids predominantly reduce LF power,19 21 reflecting an increased parasympathetic tone, and because opioids are known to reduce HR increase after noxious stimulation, one might expect that a relative reduction in the sympathetic tone by opioids would reduce haemo-dynamic responsiveness to noxious stimulations. Our data show that HR increase after intubation was significantly lower in patients with predicted effect-site remifentanil concentration of 4.7 ng ml21(Group 3) compared with the other groups. Nevertheless, the stimulation-induced HRV response did not discriminate between the treatment groups or between responders and non-responders to tra-cheal intubation, except that RRISDand Poincare´ RRISD2 responses after tetanic stimulation were lower in Group 3 (highest remifentanil concentration) compared with Group 5 (highest BIS level, intermediate remifentanil concen-tration). In another study, intraoperative noxious stimu-lation did not affect power spectral HRV, and HRV did not correlate with the humoral stress response in adults.22 Conversely, painful stimulation induced a significant increase in RRI SD, LF power, and LF/HF ratio, and a decrease in approximate entropy in propofol-anaesthetized children.23 Tachycardia induced by surgical skin incision in adults was reflected by a decrease in mean RRI, an
increase in RRI SD, and a decrease in HF power in patients under sevoflurane anesthesia.16
Not surprisingly, we found a significant difference of HRV response induced by two stimuli of different inten-sity. Tracheal intubation, which is one of the strongest stimuli, elicited a significantly stronger HRV response than 5 s tetanic stimulation on the ulnar nerve, which is weaker than surgical skin incision. In a recent study, the RRI response to a 30 s tetanic stimulus discriminated between patients with a plasma remifentanil concentration of 1 ng ml21 24 and those with 3 or 5 ng ml21. In our study, the RRI response induced by our 5 s tetanic stimu-lation was detectable, but did not discriminate between predicted effect-site remifentanil concentrations of 1.1, 2.1, and 4.7 ng ml21 (Fig. 2). The RRI response to tra-cheal intubation (Fig. 3), however, discriminated between 4.7 ng ml21 and the lower remifentanil concentrations. This suggests that only strong or even very strong stimuli allow discrimination between different remifentanil con-centrations or different states of haemodynamic respon-siveness during general anaesthesia.
The prediction of the arterial pressure and HR response to tracheal intubation based on the BIS level and the pre-dicted remifentanil concentration was therefore not improved by HRV response induced by the tetanic stimu-lation. At present, the state of haemodynamic responsive-ness during general anaesthesia is best assessed by the predicted plasma or effect-site opioid concentrations and using a depth of sedation monitor (e.g. BIS).
The definition of the responder status in this study may be a limitation. The pre-intubation arterial pressure was lower than the pre-induction arterial pressure (Table 2). The maximal SAP after intubation therefore was generally ,160 mm Hg, also including blood pressure responders. Only an SAP .160 mm Hg was associated with an increased risk of stroke in heart surgery patients.25 In the same study, only an HR .100 min21was associated with an increased incidence of postoperative myocardial infarc-tion, and an HR .120 min21 was even associated with increased mortality.25Only two patients in our study had a maximal HR .100 min21, and another two had a maximal SAP .160 mm Hg after intubation (all in Groups 1 and 2). The HRV parameters of these ‘heavy responders’ did not differ from the other responders, however (data not shown). Although our responder defi-nition potentially limits the clinical relevance of the response in the current study, we could not change it, because our current study re-evaluates data from our pre-vious study, and thus the same definition had to be used.7
We conclude that HRV in the unstimulated patient dis-criminates between awake and anaesthetized subjects, and stimulation-induced HRV response is affected by the stimulus intensity. The different HRV parameters are similar in a wide range of surgical anaesthesia with con-trolled ventilation and are therefore of limited value in assessing haemodynamic responsiveness.
Heart rate variability and haemodynamic responsiveness
Acknowledgement
This research was funded by the Department of Anaesthesiology, University Hospital of Bern, Switzerland
References
1 Rampil IJ. A primer for EEG signal processing in anesthesia. Anesthesiology 1998; 89: 980 – 1002
2 Dutton RC, Smith WD, Rampil IJ, Chortkoff BS, Eger EI. Forty-hertz midlatency auditory evoked potential activity predicts wakeful response during desflurane and propofol anesthesia in volunteers. Anesthesiology 1999; 91: 1209 – 20
3 Kalkman CJ, Drummond JC. Monitors of depth of anesthesia, quo vadis? Anesthesiology 2002; 96: 784 – 7
4 Guignard B, Menigaux C, Dupont X, Fletcher D, Chauvin M. The effect of remifentanil on the bispectral index change and hemody-namic responses after orotracheal intubation. Anesth Analg 2000; 90: 161 – 7
5 Luginbuhl M, Reichlin F, Sigurdsson GH, Zbinden AM, Petersen-Felix S. Prediction of the haemodynamic response to tracheal intubation: comparison of laser-Doppler skin vasomotor reflex and pulse wave reflex. Br J Anaesth 2002; 89: 389 – 97 6 Shimoda O, Ikuta Y, Sakamoto M, Terasaki H. Skin vasomotor
reflex predicts circulatory responses to laryngoscopy and intuba-tion. Anesthesiology 1998; 88: 297 – 304
7 Luginbuhl M, Rufenacht M, Korhonen I, et al. Stimulation induced variability of pulse plethysmography does not discriminate responsiveness to intubation. Br J Anaesth 2006; 93: 323 – 9 8 Kanaya N, Hirata N, Kurosawa S, Nakayama M, Namiki A.
Differential effects of propofol and sevoflurane on heart rate variability. Anesthesiology 2003; 98: 34 – 40
9 Petersen-Felix S, Zbinden AM, Fischer M, Thomson DA. Isoflurane minimum alveolar concentration decreases during anesthesia and surgery. Anesthesiology 1993; 79: 959 – 65
10 Wilson ME, Spiegelhalter D, Robertson JA, Lesser P. Predicting difficult intubation. Br J Anaesth 1988; 61: 211 – 6
11 Gan TJ, Glass PS, Windsor A, et al. Bispectral index monitoring allows faster emergence and improved recovery from propofol, alfentanil, and nitrous oxide anesthesia. BIS Utility Study Group. Anesthesiology 1997; 87: 808 – 15
12 Minto CF, Schnider TW, Egan TD, et al. The influence of age and gender on the pharmacokinetics and pharmacodynamics of
remifentanil I. Model developement. Anesthesiology 1997; 86: 10 – 23
13 Task Force of the European Society of Cardiology and the North American Society of Pacing and Electrophysiology. Heart rate variability: standards of measurement, physiological interpretation and clinical use. Circulation 1996; 93: 1043 – 65
14 Tulppo MP, Makikallio TH, Takala TE, Seppanen T, Huikuri HV. Quantitative beat-to-beat analysis of heart rate dynamics during exercise. Am J Physiol 1996; 271: H244 – 252.
15 Pomfrett CJ. Heart rate variability, BIS and ‘depth of anaesthesia’. Br J Anaesth 1999; 82: 659 – 62
16 Seitsonen ER, Korhonen IK, van Gils MJ, et al. EEG spectral entropy, heart rate, photoplethysmography and motor responses to skin incision during sevoflurane anaesthesia. Acta Anaesthesiol Scand 2005; 49: 284 – 92
17 Win NN, Fukayama H, Kohase H, Umino M. The different effects of intravenous propofol and midazolam sedation on hemody-namic and heart rate variability. Anesth Analg 2005; 101: 97 – 102 18 Latson TW, McCarroll SM, Mirhej MA, et al. Effects of three
anesthetic induction techniques on heart rate variability. J Clin Anesth 1992; 4: 265 – 76
19 Zickmann B, Hofmann HC, Pottkamper C, et al. Changes in heart rate variability during induction of anesthesia with fentanyl and midazolam. J Cardiothorac Vasc Anesth 1996; 10: 609 – 13 20 Haberthur C, Lehmann F, Ritz R. Assessment of depth of
midazo-lam sedation using objective parameters. Intensive Care Med 1996; 22: 1385 – 90
21 Michaloudis D, Kochiadakis G, Georgopoulou G, et al. The influ-ence of premedication on heart rate variability. Anaesthesia 1998; 53: 446 – 53
22 Ledowski T, Bein B, Hanss R, et al. Neuroendocrine stress response and heart rate variability: a comparison of total intrave-nous versus balanced anesthesia. Anesth Analg 2005; 101: 1700 – 5 23 Toweill DL, Kovarik WD, Carr R, et al. Linear and nonlinear analysis of heart rate variability during propofol anesthesia for short-duration procedures in children. Pediatr Crit Care Med 2003; 4: 308 – 14
24 Rantanen M, Yppa¨rila¨-Wolters H, Yli-Hankala A, Kyma¨la¨inen M, Korhonen I. Tetanic stimulus of the ulnar nerve as a predictor of heart rate response to skin incision in propofol-remifentanil anaesthesia. Eur J Anaesthesiol 2006; 23(Suppl 37): pA95
25 Reich DL, Bodian CA, Krol M, et al. Intraoperative hemodynamic predictors of mortality, stroke, and myocardial infarction after coronary artery bypass surgery. Anesth Analg 1999; 89: 814 – 22