Original Research
Survey of current Swiss pig feeding practices and potential for ammonia
emission reduction
P. Spring1 and A. Bracher1,2
1Berne University of Applied Sciences, HALF-Agricultural Sciences, Länggasse 85, 3052 Zollikofen, Switzerland 2Agroscope, Rte de la Tioleyre 4, 1725 Posieux, Switzerland
Summary
Controlling potentially harmful and polluting emissions from farms is important in the developed world, where legislation exists in many countries limiting emissions such as ammonia and controlling how manure is disposed of from intensive farm-ing operations. In Switzerland, there are legal agreements concernfarm-ing controls of ammonia emissions, most especially from farms. Ammonia production from pig farms can be controlled by dietary intervention, such as reducing protein levels, which in turn reduces excretion, mainly via urine. The following paper surveys current practices for nitrogen use on Swiss pig farms, and how feeding strategies may assist in controlling ammonia production from pig production systems. The survey found that 70-75% of all feeds used for pigs of all categories were reduced in protein and nitrogen, with 90% being reduced in protein in high animal density areas. Regression analysis showed that CP levels explained up to 49% of the nitrogen efficiency, suggesting that other factors are important in pollution control. Although piglet diets are more tightly regulated in terms of controlling N input, excessive protein levels in so-called reduced protein diets for finisher pigs and dry sows are common in the market. Hence, there is considerable potential to reduce N-input and ammonia emissions from Swiss pig production, which could be implemented at no or minimal extra cost.
Keywords:pigs: feed: protein: nitrogen: ammonia: emissions
(Received 11 September 2013– Accepted 10 February 2014)
Introduction
As for most European countries, Switzerland signed the Gothenburg-Protocol to abate acidification,
eutrophica-tion and ground-level ozone in 1999 (UNECE, 2010).
Among other pollutants, the protocol set maximum per-mitted emission levels for ammonia. To achieve these goals, mitigation programs were applied to focus on mea-sures that diminish ammonia losses from animal hous-ings, manure storage and spreading (KOLAS, 2006).
Dietary modifications are considered to affect all emis-sion stages from barn tofield (Agrammon,2010, Kupper et al.,2010) and are an important aspect of the mitigation programs. Feeding manipulations are considered an eco-nomical and effective way of reducing ammonia emission
from pig houses (Canh et al., 1998). About 20% of the total ingested nitrogen by growing pigs is excreted in the faeces, with approximately 50% lost in urine (Jongbloed, and Lenis, 1992). The nitrogen in the urine is mainly present as urea, which, when in contact with faecal matter in the barn or the slurry pit, can be rapidly
converted to ammonia and CO2, and forms the major
source of ammonia emissions. An efficient approach to reducing emissions is the reduction of the crude protein, and hence nitrogen, concentration of the diet (Dourmad et al.,1992; Jongbloed et al.,2007). However, when redu-cing the crude protein concentrations it is important that all essential amino acids remain present at required levels to avoid reducing animal performance. Other relevant
Corresponding author:[email protected]
© Cambridge University Press and Journal of Applied Animal Nutrition Ltd. 2014
Journal
of
Applied
Animal
dietary factors are non-starch polysaccharides and acid-ifying salts (Jongbloed et al., 2007; Le, 2006).
Cahn et al. (1998) investigated the effects of dietary protein on nitrogen excretion and ammonia emission from slurry of growing–finishing pigs fed diets with 16.5, 14.5 and 12.5% crude protein, respectively. They reported no effect of dietary CP concentration on faecal nitrogen excretion, however urinary nitrogen excretion and slurry pH decreased with a reductions in dietary CP. Ammonia emission was reduced by 10–12.5% for each percent decrease in dietary CP. Emission reductions of comparable magnitude were also reported by Le (2007).
In intensive animal production regions in Switzerland, a significant proportion of the farms feed reduced crude protein diets and monitor the nutrient flow as a farm import-export balance (IMPEX) (Agridea, 2010). Such monitoring allows farms to claim lower than standard nutrient accumulation in the slurry which reduces the land area needed to achieve a balanced nutrient cycle. IMPEX data offers considerable information on the cur-rent state of pig nutrition and on-farm nutrient flow, however, to date, no systematic analyses of such data has been conducted.
The aim of the present study was to survey the current feeding practices on Swiss pig farms based on farm IMPEX and market data, and to identify potential for ammonia reduction through dietary adaptation.
Materials and methods
The survey was conducted based on data analyses from: a) product specification and market data from Swiss feed manufactures, b) farm IMPEX data (Import-Export data) from the state of Lucerne, c) data from the official Swiss Feed Control programmes. The feed mill dataset comprised information from seven manufacturers with a market share of approximately 75% of the total Swiss feed market. The information on ‘sold’ products (prod-uct line) was completed with information from farm IMPEX-data and web-based information. In total, over 1500 different feeds were evaluated. Based on diet specifications and sales volumes, the usage of N and P reduced feed (NPr) and the average nutrient content of different feed types were calculated.
In addition, IMPEX-data from 1665 farms based in the Lucerne region during 2008 were analysed. The IMPEX-data gave information on farm N-inputs via feed and purchased pigs and farm N-outputs via pigs
sold (Agridea, 2010). All data were processed and then grouped by farm type, animal category, feed type and feeding strategy in order to compile detailed information on the dietary composition in those groups.
Data from 887 grower-finisher pig farms were
sub-jected to more detailed analyses. For growing-finishing pigs, the farm N-Input and output was based on body weight (BW) with 24.6 g N/kg BW (<60 kg live weight) for smaller and 22.2 g /kg BW (>60 kg live weight) for larger pigs, respectively (Agridea, 2010). In the present
study fix values for nitrogen concentrations were
assumed as not sufficient details were available to adjust the parameters based on genotype, feeding strategy or carcass composition (Bracher und Spring, 2010). Based on this information, and the diet type entering the farm, the N-efficiency and the N-excretion rates via fae-ces and urine were calculated for different feeding strategies. The calculations were based on a ‘standard’ finishing pig from 26-108 kg BW with a net N-export per pig of 1.758 kg. For ‘farrowing to finishing’ farms it was often not possible to assign all feeds to the corre-sponding pig categories. Therefore, analyses were only conducted over the entire farm without analyses for spe-cific animal categories.
The data set from the feed mills and the IMPEX data are both based on declared nutrient values. To verify if declared diet specifications corresponded with the actual concentrations, declared and analysed data from 108 diets produced in 2008, were compared. Potential areas for reducing ammonia were analysed by comparing the practice with Swiss recommendations for nutrient requirements (ALP, 2004) and by simulating the effect of dietary differences in N-input on ammonia emissions
with the program Agrommon (Agrammon, 2010,
Kupper,2010).
Data were analysed using descriptive statistics. As all data from feed mill, IMPEX and feed control are con fi-dential in nature, the results are presented as average values in different categories in an anonym form.
Results
The survey showed that depending on feed category 70% to 75% of the feed sold on the Swiss market in 2008 were NPr feeds. This percentage was highly variable within regions and between feed mills, reaching over 90% in animal-dense areas. For grower/finisher animals, 82% of the feed was sold as complete compound feed.
Journal
of
Applied
Animal
Among the 18% of complementary feed sold, the largest portion was fed to supplement liquid fresh whey.
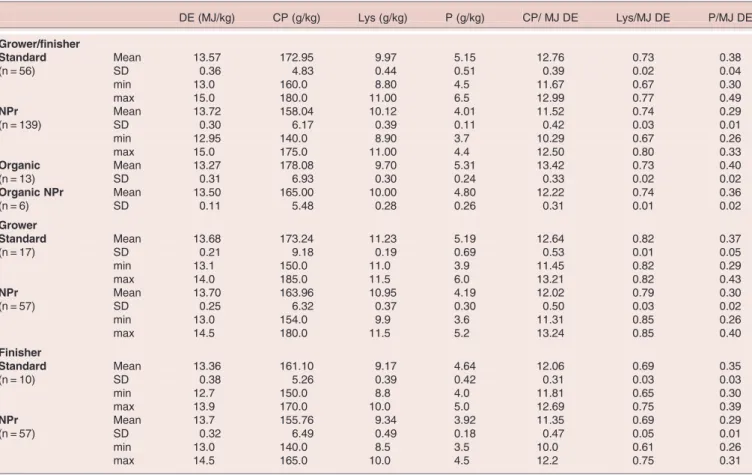
The average CP concentrations for complete grower-finisher pig diets were 172.95 ± 4.83 g/kg (13.57 MJ DE) and 158.04 ± 6.17 g/kg (13.72 MJ DE) for standard and NPr diets, respectively (Table 1). Based on a diet with 13.5 MJ DE, this corresponds to crude protein con-centrations of 172.1 g/kg and 155.5 g/kg. The average lysine concentration in grower/finisher diets was 0.74 g/MJ DE. When using phase feeding programs, the lysine concentrations (and all other amino acids if the ideal protein concept is followed) in the finisher diets were reduced compared to grower/finisher diets, how-ever CP concentrations were not found to be reduced accordingly, leading to an oversupply of crude protein.
In organic production the addition of crystalline amino acids is not allowed. Therefore, crude protein concentra-tions have to be increased to meet the dietary amino acid requirements. The crude protein concentrations in organ-ic diets were found to be 178.08 ± 6.93 g/kg and 165.00 ± 5.48 g/kg for standard and NPr diets, respectively.
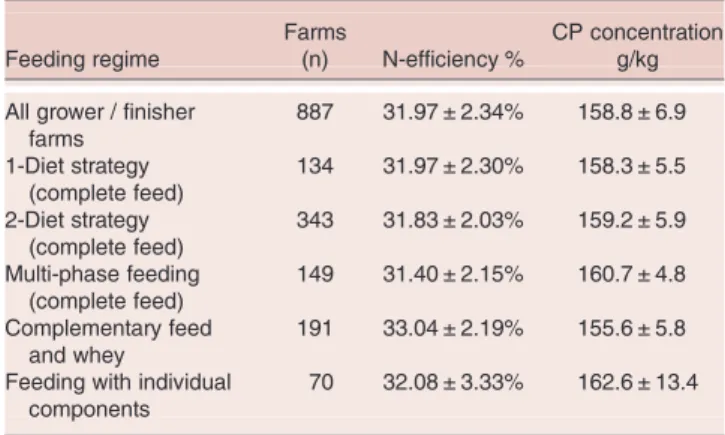
Based on the IMPEX data from 887 grower/finisher farms in the state of Lucerne, the effects of different
feeding strategies on N-efficiency (N-Export/N-Import) were analysed. Feeding strategies (phases, complementary feed, individual components) had little effect (158– 163 g/kg) on the average dietary CP concentration. The
average N-efficiency over all farms surveyed was
31.97%. Interestingly, multi-phase feeding systems did not yield a lower average CP concentration in the overall diet compared to 1-phase feeding, as phase 2 and 3 diets contained no to only moderate reductions in CP con-centrations (Table 2). Based on simulations with the pro-gram Apro-gramon (2010) it was estimated that farms which use standard diets could reduce their ammonia emission between 13 and 17 % (Bracher and Spring, 2010) when switching to NPr. The reduction potential is variable due to differences in housing and slurry management. Farms which already use NPr-diets could still achieve a considerable reduction in CP-input and thus ammonia emissions when lowering the CP concentration in the fin-isher diet from 156 g/kg to the recommended 145 g/kg (ALP,2004).
The N-efficiency in grower-finisher farms is negatively correlated with the CP concentration (per MJ DE) of the diet (Figure 1). In general the CP concentrations were a Table 1. Nutrient concentrations of grower/finisher, grower and finisher feed
DE (MJ/kg) CP (g/kg) Lys (g/kg) P (g/kg) CP/ MJ DE Lys/MJ DE P/MJ DE Grower/finisher Standard Mean 13.57 172.95 9.97 5.15 12.76 0.73 0.38 (n = 56) SD 0.36 4.83 0.44 0.51 0.39 0.02 0.04 min 13.0 160.0 8.80 4.5 11.67 0.67 0.30 max 15.0 180.0 11.00 6.5 12.99 0.77 0.49 NPr Mean 13.72 158.04 10.12 4.01 11.52 0.74 0.29 (n = 139) SD 0.30 6.17 0.39 0.11 0.42 0.03 0.01 min 12.95 140.0 8.90 3.7 10.29 0.67 0.26 max 15.0 175.0 11.00 4.4 12.50 0.80 0.33 Organic Mean 13.27 178.08 9.70 5.31 13.42 0.73 0.40 (n = 13) SD 0.31 6.93 0.30 0.24 0.33 0.02 0.02 Organic NPr Mean 13.50 165.00 10.00 4.80 12.22 0.74 0.36 (n = 6) SD 0.11 5.48 0.28 0.26 0.31 0.01 0.02 Grower Standard Mean 13.68 173.24 11.23 5.19 12.64 0.82 0.37 (n = 17) SD 0.21 9.18 0.19 0.69 0.53 0.01 0.05 min 13.1 150.0 11.0 3.9 11.45 0.82 0.29 max 14.0 185.0 11.5 6.0 13.21 0.82 0.43 NPr Mean 13.70 163.96 10.95 4.19 12.02 0.79 0.30 (n = 57) SD 0.25 6.32 0.37 0.30 0.50 0.03 0.02 min 13.0 154.0 9.9 3.6 11.31 0.85 0.26 max 14.5 180.0 11.5 5.2 13.24 0.85 0.40 Finisher Standard Mean 13.36 161.10 9.17 4.64 12.06 0.69 0.35 (n = 10) SD 0.38 5.26 0.39 0.42 0.31 0.03 0.03 min 12.7 150.0 8.8 4.0 11.81 0.65 0.30 max 13.9 170.0 10.0 5.0 12.69 0.75 0.39 NPr Mean 13.7 155.76 9.34 3.92 11.35 0.69 0.29 (n = 57) SD 0.32 6.49 0.49 0.18 0.47 0.05 0.01 min 13.0 140.0 8.5 3.5 10.0 0.61 0.26 max 14.5 165.0 10.0 4.5 12.2 0.75 0.31
NPr: Feed with reduced crude protein (N) and phosphorus concentrations.
Journal
of
Applied
Animal
little higher in farms that feed with individual compo-nents (on-farm mixers). However, feeding strategies and dietary CP concentrations can only explain between 23 and 49% of the variation. The data suggested that farm factors other than CP concentrations or feeding regime have important effects on N-efficiency.
N-export per pig as excreta was calculated as the differ-ence between N-import via diet and N deposition. Among the analysed farms, N-export per pig ranged from 2.4 kg N to 5.4 kg N (Figure 2). Farms feeding a complete diet averaged 3.64 kg N ± 0.44 and farms that fed with individual components (on-farm mixers) 4.06 kg N ± 0.70. Assuming 3.3 rotations per year, the
minimal output of 2.4 kg would lead to an overall output of 7.92 kg N per grower space.
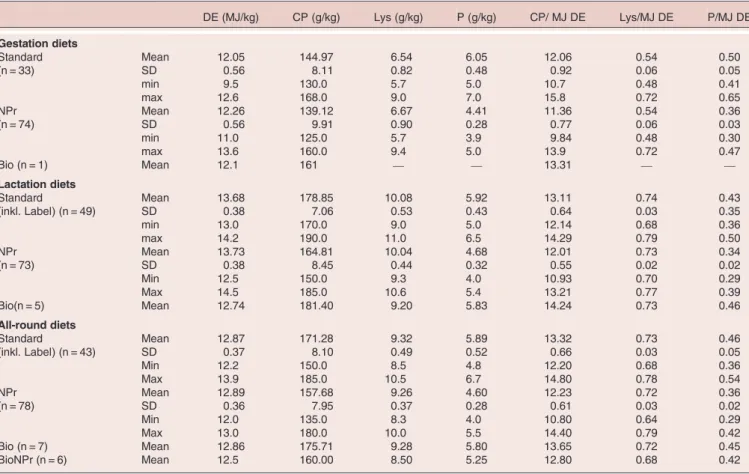
Average CP concentrations for dry sow diets were 144.97 ± 8.1 g (12.05 MJ DE) and 139.12 ± 9.9 g (12.26 MJ DE) and for lactating sow diets 178.85 ± 7.1 g (13.68 MJ DE) and 164.81 ± 8.4 g (13.73 MJ DE) for standard and NPr diets, respective (Table 3). Some smaller farms were still using all-round diets for both the gestation and lactation phase. On some farms, those diets were diluted during gestation with high fibre/low protein forages. If this was not done, these diets lead to a massive CP oversup-ply during gestation. In particular, for gestation diets, the difference in CP concentration between standard and NPr diets were quite small. As for grower/finisher animals, the CP concentrations of organic diets were considerably higher than for standard diets.
Based on simulations with the program Agramon (2010) it was estimated that farms could reduce their ammonia emission between 8 and 11% when switching to NPr-diets (Bracher and Spring, 2010). The effect is smaller compared to fattening farms due to a smaller dif-ference in CP concentrations between NPr and standard feeds. Farms which already use NPr-diets could still achieve a moderate reduction in CP-input by optimizing gestation diets. Lactation NPr-diets are formulated close to requirement (ALP, 2004) thus offering no consider-able potential to further reducing CP concentration. Table 2. Crude protein concentrations and N-efficiency grouped per
feeding regime Feeding regime Farms (n) N-efficiency % CP concentration g/kg All grower / finisher
farms 887 31.97 ± 2.34% 158.8 ± 6.9 1-Diet strategy (complete feed) 134 31.97 ± 2.30% 158.3 ± 5.5 2-Diet strategy (complete feed) 343 31.83 ± 2.03% 159.2 ± 5.9 Multi-phase feeding (complete feed) 149 31.40 ± 2.15% 160.7 ± 4.8 Complementary feed and whey 191 33.04 ± 2.19% 155.6 ± 5.8 Feeding with individual
components 70 32.08 ± 3.33% 162.6 ± 13.4
Journal
of
Applied
Animal
Nutrition
Figure 2. N-output per pig (26– 108 kg LG) in relation to dietary CP concentration (n = 899)
Table 3. Nutrient concentrations of gestation and lactation sow diets and all-round sow diets
DE (MJ/kg) CP (g/kg) Lys (g/kg) P (g/kg) CP/ MJ DE Lys/MJ DE P/MJ DE Gestation diets Standard Mean 12.05 144.97 6.54 6.05 12.06 0.54 0.50 (n = 33) SD 0.56 8.11 0.82 0.48 0.92 0.06 0.05 min 9.5 130.0 5.7 5.0 10.7 0.48 0.41 max 12.6 168.0 9.0 7.0 15.8 0.72 0.65 NPr Mean 12.26 139.12 6.67 4.41 11.36 0.54 0.36 (n = 74) SD 0.56 9.91 0.90 0.28 0.77 0.06 0.03 min 11.0 125.0 5.7 3.9 9.84 0.48 0.30 max 13.6 160.0 9.4 5.0 13.9 0.72 0.47 Bio (n = 1) Mean 12.1 161 — — 13.31 — — Lactation diets Standard Mean 13.68 178.85 10.08 5.92 13.11 0.74 0.43 (inkl. Label) (n = 49) SD 0.38 7.06 0.53 0.43 0.64 0.03 0.35 min 13.0 170.0 9.0 5.0 12.14 0.68 0.36 max 14.2 190.0 11.0 6.5 14.29 0.79 0.50 NPr Mean 13.73 164.81 10.04 4.68 12.01 0.73 0.34 (n = 73) SD 0.38 8.45 0.44 0.32 0.55 0.02 0.02 Min 12.5 150.0 9.3 4.0 10.93 0.70 0.29 Max 14.5 185.0 10.6 5.4 13.21 0.77 0.39 Bio(n = 5) Mean 12.74 181.40 9.20 5.83 14.24 0.73 0.46 All-round diets Standard Mean 12.87 171.28 9.32 5.89 13.32 0.73 0.46 (inkl. Label) (n = 43) SD 0.37 8.10 0.49 0.52 0.66 0.03 0.05 Min 12.2 150.0 8.5 4.8 12.20 0.68 0.36 Max 13.9 185.0 10.5 6.7 14.80 0.78 0.54 NPr Mean 12.89 157.68 9.26 4.60 12.23 0.72 0.36 (n = 78) SD 0.36 7.95 0.37 0.28 0.61 0.03 0.02 Min 12.0 135.0 8.3 4.0 10.80 0.64 0.29 Max 13.0 180.0 10.0 5.5 14.40 0.79 0.42 Bio (n = 7) Mean 12.86 175.71 9.28 5.80 13.65 0.72 0.45 BioNPr (n = 6) Mean 12.5 160.00 8.50 5.25 12.80 0.68 0.42
NPr: Feed with reduced crude protein (N) and phosphorus concentrations
Journal
of
Applied
Animal
N efficiency calculated based on the IMPEX averaged (depending on the feeding strategy) from 29.3 to 32.7%
for sow units. During the gestation phase the
N-efficiency was low, reaching only 15%.
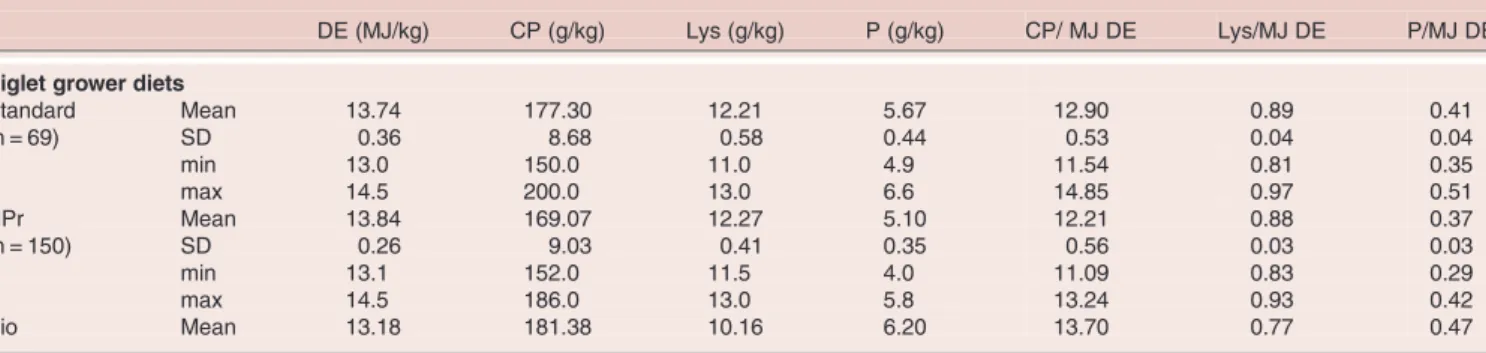
Piglet diets were difficult to group as the terms ‘pre-starter’ ‘‘pre-starter’ and ‘piglet diet 1 or 2’ are not used consistently in the industry. Therefore only the piglet grower diets, which are normally fed from 8–25 kg or 12–25 kg body weight, were analysed in detail (Table 4).
The analyses of 108 randomly selected diets revealed no protein over-formulation compared to the declared values (Figure 3). The analysed energy values surpassed declared values on average by +0.4 MJ DE/kg (3.05%) and analysed crude protein contents deviated
from declared contents by, on average, –0.46 g/kg
(0.25%).
Discussion
This survey was based on declared dietary nutrient concentrations. The verifications of these with analysed values, based on a data set from Swiss Feed Control, revealed a good accordance and indicated no protein over formulation. This comparison suggested that declared values are suitable for assessing current feed-ing practices in Swiss pig production. All samples were within Swiss feed regulations (EVD, 2010) which allow a larger deviation for over-formulation (20%) versus under-formulation (10%). More stringent rules (max 7% deviation) regarding over-formulation are defined in the Suisse-Bilanz (BLW, 2010), which allows farms to claim lower than standard nutrient accumulation in the slurry and therefore reduce the land area needed to achieve a balanced nutrient cycle. With ammonia emission being a major challenge to Swiss and global Table 4. Nutrient concentrations of piglet grower diets
DE (MJ/kg) CP (g/kg) Lys (g/kg) P (g/kg) CP/ MJ DE Lys/MJ DE P/MJ DE
Piglet grower diets
Standard Mean 13.74 177.30 12.21 5.67 12.90 0.89 0.41 (n = 69) SD 0.36 8.68 0.58 0.44 0.53 0.04 0.04 min 13.0 150.0 11.0 4.9 11.54 0.81 0.35 max 14.5 200.0 13.0 6.6 14.85 0.97 0.51 NPr Mean 13.84 169.07 12.27 5.10 12.21 0.88 0.37 (n = 150) SD 0.26 9.03 0.41 0.35 0.56 0.03 0.03 min 13.1 152.0 11.5 4.0 11.09 0.83 0.29 max 14.5 186.0 13.0 5.8 13.24 0.93 0.42 Bio Mean 13.18 181.38 10.16 6.20 13.70 0.77 0.47
NPr: Feed with reduced crude protein (N) and phosphorus concentrations
Journal
of
Applied
Animal
animal production, it makes little sense to allow larger deviations for over formulation. This practice should be reconsidered. In contrast to crude protein values, declared values for digestible energy were, on average, 0.40 MJ lower than those based on feed analyses. No explanation was found for this discrepancy. However, as nutrient requirements for pigs are commonly expressed in relation to dietary energy, this discrepancy should be assessed further in order to optimise diet formulation.
The survey shows that depending on the feed categor-ies 25 to 30% of the feeds are still sold at standard CP concentrations. Standard diets for growr/finisher pigs contain an average of 173 g CP. Kessler et al. (1994) reported for 1992/93 average CP concentrations for grower/finisher diets of 184 g/kg. Those levels have been reduced considerably over the last 20 year. Compared to standard diets the CP concentration in NPr-grower/finisher diets is on average 15 g CP / kg of feed lower. This difference allows to reduce CP intake
per finished pig by about 3 kg (assuming 200 kg feed
consumption per pig). Estimations with the program
Agrammon (2010) show, that if farms switch from
standard to NPr-feed, they can reduce their ammonia
emissions by 13–17%. CP concentration in finisher
NPr-diets are above recommendations. If these finisher diets would be reduced from the current 156 g to the recommended (ALP, 2004) 145 g while maintaining the
amino acid supply and further 8–11% reduction in
ammonia emissions could be achieved. For all other ani-mal categories the differences in CP concentrations between standard and NPr-diets are smaller thus offer-ing a smaller reduction potential. On sow farms the switch from standard to NPr-diets would still offer an ammonia reduction potential of 8–11%. In piglets the differences between standard and NPr-diets regarding CP concentrations were moderate and limited potential for further reductions exist. CP concentrations are already highly restricted in standard piglet diets, as a high CP concentration enhance the risk for post weaning diarrhoea (Le Bellego and Noblet2002, Heo et al.,2009). Reducing CP is one approach to reduce emissions. A second approach is to improve N-efficiency. The detailed data analyses on grower/finisher farms shows that large differences exist in N-efficiency between farms. The reasons for these differences need to be investigated and key factors contributing to high N-efficiency determined and more efficiently implemen-ted in Swiss swine production.
Conclusions
The survey showed that 25–30% of all feed was still being sold at standard CP concentrations. In addition excessive protein levels in NPr-diets forfinisher pigs and dry sows are common in the market. This offers a considerable potential to reduce N-input and ammonia emissions from Swiss pig production. At least a part of this potential could be implemented at no or minimal extra cost.
Acknowledgements
The authors would like to thanks the Federal Office for Agriculture, Switzerland for theirfinancial support of this project
Declaration of Interest None.
References
Agrammon. (2010)http://www.agrammon.ch/modell-agrammon/
Agridea. (2010). Impex Version 2.5.http://www.agridea.ch/de/software/
software/downloads/impex_version_25/
ALP, Agroscope Liebefeld-Posieux. (2004) Fütterungsempfehlungen und Nährwerttabellen für Schweine. (LmZ, Zollikofen).
BLW, Bundesamt für Landwirtschaft. (2010) Weisungen zur Berücksichtigung von nährstoffreduziertem Futter in der
Suisse-Bilanz.http://www.qualinova.ch/upload/qualinova/files/Weisungen_
NPr-Futter_Suisse-Bilanz.pdf
Bracher A. and Spring P.(2010) Survey of current Swiss pig feeding
practices and potential for ammonia emission reduction. Book of abstract of the 61s Annual Meeting of the EAAP, Heraklion, p. 326.
Bracher A. und Spring P. (2010) Möglichkeiten zur Reduktion der
Ammoniakemissionen durch Fütterungsmassnahmen bei Schweinen. Bericht der Vorstudie. Publ. SHL Zollikofen und Agroscope
Liebefeld-Posieux ALP, Zollikofen. 98 S. pp 22.
http://www.agro-scope.ch/schwein/01780/index.html?lang=en&sort%5B3_0%5D=0 &dir%5B3_0%5D=asc&page%5B3_0%5D=3
Canh T.T., Aarninka A.J.A., Schutte J.B., Sutton A., Langhout D.J.
and Verstegen M.W.A.(1998) Dietary protein affects nitrogen
excre-tion and ammonia emission from slurry of growing–finishing pigs. Livestock Production Science, 56: 181–191.
Dourmad J.Y., Guillou D. and Noblet J.(1992) Development of a
cal-culation model for predicting the amount of N excreted by the pig: effect of feeding, physiological stage and performance. Livestock Production Science, 31: 95–107.
EVD, Eidgenössisches Volksdepartment. (2010) Verordnung des EVD über die Produktion und das Inverkehrbringen von Futtermitteln,
Zusatzstoffen für die Tierernährung, Silierungszusätzen und
Diätfuttermitteln (Futtermittelbuch-Verordnung, FMBV).http://www.
admin.ch/ch/d/sr/9/916.307.1.de.pdf
Heo J., Kim J.C., Hansen C.F., Mullan B.P., Hampson D.J. and
Pluske J.R. (2009) Feeding a diet with decreased protein content
reduces indices of protein fermentation and the incidence of post-weaning diarrhea in weaned pigs challenged with an enterotoxigenic strain of Escherichia coli. Journal of Animal Science, 87: 2833–2843. Kupper T., Bonjour C., Zaucker F., Achermann B. and Menzi H. (2010) Agrammon: An internet based model for the estimation of
Journal
of
Applied
Animal
ammonia emissions, in: Cordovil C. & Ferreira L., (Eds.) pp. 334–337. (Lisbon, Portugal).
Jongbloed A.W., Aarnink A.J.A., and Van Der Peet-Schwering C.M.
C. (2007) Nutritional options to reduce ammonia emission from
excreta of pigs, in: Monteny G.J. & Hartung E. (Eds) Ammonia emis-sions in agriculture, p.403 (Wageningen, Academic Publishers).
Jongbloed A.W. and Lenis N.P.(1992) Alteration of nutrition as means
to reduce environmental pollution by pigs. Livestock Production Science,
31: 75–94.
Kessler J., Zogg M. and Bächler E.(1994) Ein kritischer Blick in den
Schweinetrog. Agrarforschung 1: 313–316.
KOLAS, Konferenz der Landwirtschaftsämter der Schweiz (Eds).
(2006) Empfehlungen zur Reduktion der Ammoniakverluste aus der Landwirtschaft. Sissach 28. Juni 2006, 27 S.
Le Bellego L. and Noblet J.(2002) Performance and utilization of
diet-ary energy and amino acids in piglets fed low protein diets. Livestock
Production Science 76: 45–58.
Le D.P. (2006) Odour from pig production: its relation to diet.
Dissertation. Wageningen.
UNECE. (2010) Protocol to Abate Acidification, Eutrophication
and Ground-level Ozone. http://www.unece.org/env/lrtap/multi_
h1.htm