An analysis of simultaneous variation in protein structures
Gareth Chelvanayagam1,2,3, Andreas Eggenschwiler1, 1975; Chothia and Lesk, 1986). The persistence of the fold
Lukas Knecht1, Gaston H.Gonnet1and in highly divergent proteins also underlies homology-based
Steven A.Benner1,4 modelling methods (Blundell et al., 1987), profile analysis
(Hilbert et al., 1993; Zhang and Eisenberg, 1994), threading 1Computational Biochemistry Research Group, ETH Zurich,
(Jones et al., 1992; Bryant and Lawrence, 1993) and other CH-8092 Switzerland,2John Curtin School of Medical Research, ANCI
tools where a three-dimensional model for one protein is Canberra, 2601, Australia and4Department of Chemistry, University of
built by extrapolation from an experimental structure of a Florida, Gainesville, FL 32611, USA
homologue. 3To whom correspondence should be addressed (Switzerland)
The conservation of the overall fold after many amino The simultaneous substitution of pairs of buried amino acid acid substitutions also raises the possibility that amino acid side chains during divergent evolution has been examined in substitutions at one position in a polypeptide chain might be a set of protein families with known crystal structures. A compensated for by substitutions elsewhere in a protein. For weak signal is found that shows that amino acid pairs near example, if a Gly at one position inside the folded protein in space in the folded structure preferentially undergo core is replaced by a Trp, it might be necessary to substitute substitution in a compensatory way. Three different a Trp by a Gly at a position distant in the sequence but near physicochemical types of covariation ‘signals’ were then in space to conserve the overall volume of the core and, examined separately, with consideration given to the evolu- therefore, the overall folded structure.
tionary distance at which different types of compensation Individual examples of compensatory changes in proteins occur. Where the compensatory covariation tends towards have been documented (Oosawa and Simon, 1986), both by retaining the combined residue volumes, the signal is analysis of the families of natural proteins with known struc-significant only at very low evolutionary distances. Where tures (Lesk and Chothia, 1980, 1982; Chothia and Lesk, 1982; the covariation compensates for changes in the hydrogen Altschuh et al., 1987a,b, 1988; Bordo and Argos, 1990) and bonding, the signal is strongest at intermediate evolutionary in proteins into which point mutations have been introduced distances. Covariations that compensate for charge vari- by site-directed mutagenesis (Lim and Sauer, 1989; Lim et al., ations appeared with equal strength at all the evolutionary 1992; Baldwin et al., 1993). In these examples, amino acid distances examined. A recipe is suggested for using the residues distant in the sequence but near in three-dimensional weak covariation signal to assemble the predicted secondary space in the folded structure have been observed to undergo structural elements, where the evolutionary distance, simultaneous compensatory variation to conserve the overall covariation type and weighting are considered together volume, charge or hydrophobicity.
with the tertiary structural context (interior or surface) of These examples raise the possibility that compensatory
the residues being examined. covariation can be used as a prediction tool in a set of proteins
Keywords: constraints from multiple alignments/protein that has suffered substitution during functionally constrained engineering/protein folding/protein modelling/protein structure divergent evolution. In its simplest form, a set of aligned homologous sequences might be examined to find a pair of positions distant in the sequence where substitution during
Introduction divergent evolution is both simultaneous and compensatory.
Such an observation might indicate that this pair of amino The analysis of patterns of variation and conservation in
acids is near in the folded form of the protein. homologous protein sequences has provided tools for
identify-That such an approach might be problematic was indicated ing amino acids that lie in the active site (Zvelebil et al., 1987;
in early work by Lesk and Chothia, whose studies of the Benner, 1989), distinguishing amino acids that lie on the
globin family found that replacements of hydrophobic residues surface of a folded protein from those that lie inside (Benner,
in the core of the protein fold are usually accommodated by 1989; Overington et al., 1992; Benner et al., 1994a) and
small shifts of secondary structure rather than by complement-finding polypeptide segments that divide or ‘parse’ the primary
ary amino acid substitutions (Lesk and Chothia, 1980, 1982; sequence into separate secondary structural elements (Cohen
Chothia and Lesk, 1982). More recent studies have suggested
et al., 1986; Benner and Gerloff, 1991). This information can
that a weak compensatory covariation signal might exist (Go¨bel in turn be used to obtain reasonably reliable predictions of
et al., 1994; Neher, 1994; Shindyalov et al., 1994; Taylor and
secondary structure, as shown to date by some 20 bona
Hatrick, 1994). Some authors have doubted, however, that the fide structure predictions (reviewed in Benner et al., 1994b;
signal is adequate enough to be useful in structure prediction, S.A.Benner, G.Chelvanayagam and M.Turcotte, submitted),
at least in comparison with simpler signals, for example those made and announced before an experimental structure
clustering of the conserved residues in the protein core and is known.
active sites (Benner and Gerloff, 1991; Taylor and Hatrick, Such analyses depend on the fact that the core conformation
1994). Others have been more optimistic (Neher, 1994; of homologous proteins persists long after the statistically
Overlooked in the recent literature on compensatory covari- multiple sequence alignments and corresponding phylogenetic trees for each family using the DARWIN package. The aligned ation is the fact that such analyses have been successful in
specific instances in bona fide prediction settings. For example, sequences within each protein family were then used to search for covariations.
in the bona fide prediction of the supersecondary structure of
protein kinase (Benner and Gerloff, 1991), an antiparallelβ- Definitions sheet was proposed for the core of the first domain by
The interior positions are defined as those where the relative identifying two specific compensatory changes in consecutive
residue surface accessibility in the template crystal structure strands in the predicted secondary structural model. The
is ,40%, as calculated by the DSSP program (Kabsch and
subsequently determined crystal structure (Knighton et al.,
Sander, 1983) and normalized by the expected fully exposed 1991) showed not only that an antiparallelβ-sheet existed, but
accessibility in a Gly-X-Gly tripeptide, for each amino acid that the side chains of the two residues undergoing
compensat-type X (Zielenkiewicz and Sanger, 1992). In the structures ory covariation were indeed in contact. More recently,
com-used in this work (Table I), approximately one-quarter of pensatory covariation analysis was used to build a consensus
the residues have surface accessibilities of ,10%, while prediction for the fibrinogen family (Benner and Gerloff, 1996).
approximately half have accessibilities of,40%. The recent discussions of compensatory covariation in the
The simultaneous variation is defined as an instance where literature (Go¨bel et al., 1994; Neher, 1994; Shindyalov et al.,
two positions in an aligned pair of homologous protein 1994; Taylor and Hatrick, 1994) have prompted us to report
sequences have both undergone substitution. The proximal in more detail our own efforts in this area (Benner, 1989;
variations are defined as simultaneous variations where both Benner and Gerloff, 1991), which have been directed towards
the positions are interior and have a separation distance of,6 learning how to use compensatory covariation signals in the
Å in the corresponding template structure. The distance was context of bona fide structure predictions. Recent developments
calculated from the centre of mass of each residue, which was in structure prediction have shown that patterns of conservation
obtained by including the Cαatom and all heavy atoms of the and covariation yield more structural information if they are
side chain. Simultaneous variations at positions whose centres analysed within the context of specific measures of evolutionary
of mass are.6 Å distant are referred to as distal variations. distance and defined evolutionary models (Benner, 1989;
The 6 Å distance cut-off was arbitrarily chosen to distinguish Benner and Gerloff, 1991; S.A.Benner, G.Chelvanayagam and
between residues in contact (or near contact) from those more M.Turcotte, submitted). This report defines more precisely the
distant. Similar distance cut-offs are used in the calculation of effect of evolutionary distance on the compensatory covariation
non-bonded interactions in molecular dynamic studies (Paulsen signal. This in turn suggests approaches by which this signal
and Ornstein, 1991). might be ‘filtered’ to increase our ability to detect it above
Covariation is a special case of proximal variation and the ‘noise’ observed in the divergent evolution of protein
corresponds to those instances where the variation can be sequences.
categorized as compensatory with respect to a physicochemical property such as volume or charge.
Materials and methods
Simultaneous variation matrices Data set
Simultaneous variations are represented as a pair of variations Algorithms for the automatic selection of representative subsets [A→B][C→D], where A, B, C and D are elements of the set of protein with solved three-dimensional structures from the of standard amino acids. Through symmetry, of all the possible Brookhaven Protein Data Bank (Bernstein et al., 1977) have permutations of the amino acid types represented by A, B, C been reported (Heringa et al., 1992; Hobohm et al., 1992). and D, exactly four correspond to the same simultaneous The structures listed by Hobohm et al. (1992), which contained variation: [A→B][C→D], [B→A][D→C], [D→C][B→A] and no two proteins with sequences.30% identical, were used as [C→D][A→B]. The proximal variation counts were stored in a starting set. The sequences in the starting set were matched a 400 3 400 matrix M with each row and each column against SWISS-PROT (Version 28) (Bairoch and Boeckman, corresponding to a particular variation of the type A→B. 1991) using the DARWIN package (Gonnet, 1993) to identify Similarly, the distal variations were recorded in a matrix N. the SWISS-PROT accession that contained an exact match of For each simultaneous variation found, each of the correspond-the sequence with correspond-the solved structure. Sequences in correspond-the ing four elements in such a matrix M was incremented. starting set not exactly matched within SWISS-PROT, either Of the 160 000 matrix elements in M and N, elements of completely or as a subsequence, were discarded. Homologues the form [X→X][C→D] correspond to single variations and not of the retrieved SWISS-PROT sequences were then extracted simultaneous variations. These elements were not considered in from the exhaustive matching of the entire SWISS-PROT this work. A total of 36 290 distinguishable simultaneous sequence database (Gonnet et al., 1992). Sequences were variations are possible, and can be classified as belonging to extracted only if they could be aligned over at least 75% of one of five different morphologies (Figure 1).
the length of the sequence in the starting set, had a similarity
PAM ranges
score.100 compared to that sequence and were ,100 PAM
units distant from the sequence, where a PAM unit is the To determine whether the evolutionary distance has an effect on the covariation signal, individual proximal and distal number of point-accepted mutations per 100 amino acid
residues (Dayhoff et al., 1978). Each index sequence and its variation matrices were calculated for pairs of sequences collected at different PAM windows. A sliding window of 30 homologues constituted a protein family. Families containing
only one sequence were discarded. A total of 44 families PAM units was used to create eight PAM ranges from 0–30 to 70–100 PAM units, in steps of 10 PAM units. Simultaneous (Table I) ranging from 21 to 385 amino acids in length and
containing between two and 37 members were considered. variation matrices were then constructed for each protein family. After normalization (see below), the M and N matrices The sequences within a protein family were used to generate the
Table I. List of Brookhaven template structures
Family Length Number of pairs of sequences in PAM range Total number of
sequences in 0–30 10–40 20–50 30–60 40–70 50–80 60–90 70–100 family 1cbh 36 1 0 0 0 0 0 0 0 2 1cc5 83 0 1 1 1 0 0 0 0 2 1cd4 173 3 1 1 0 6 6 6 0 5 1crn 46 2 2 3 5 5 5 6 6 7 1ctf 68 4 5 23 30 30 30 0 0 13 1gcn 29 1 1 0 0 0 0 0 0 2 1mbd 153 14 14 16 16 16 0 0 15 17 1mrt 31 5 5 5 8 24 24 24 0 10 1paz 120 0 1 1 1 0 2 2 2 3 1pcy 99 8 8 8 1 27 27 27 0 12 1ppt 36 10 19 18 18 4 22 44 44 15 1rmu_4 40 12 2 2 23 10 33 33 33 14 1sn3 65 0 0 1 1 1 0 0 0 2 1ubq 76 21 0 0 0 0 0 0 0 10 1wsy_B 385 1 1 2 3 8 8 8 0 6 2gbp 309 1 0 0 0 0 0 0 0 2 2gn5 87 0 0 0 0 0 0 1 1 2 2i1b 153 0 3 3 6 6 6 0 0 5 2ltn_B 47 3 3 0 1 3 12 12 12 8 2mev_4 58 2 0 3 3 3 0 0 0 4 2mhr 118 2 2 2 1 1 1 8 8 6 2mrb 31 41 41 29 22 22 22 105 0 23 2ovo 56 3 4 7 6 6 10 10 10 7 2sod_O 151 21 25 64 99 99 36 36 36 37 2ssi 107 1 1 2 2 2 0 0 0 3 2tmv_P 154 10 10 0 0 0 0 8 8 9 3adk 194 2 2 2 0 4 4 8 8 6 3b5c 85 6 6 1 0 0 0 0 0 7 3fxc 98 5 6 6 6 0 0 0 0 7 3gap_A 208 2 2 2 0 0 0 0 0 3 3hla_B 99 2 4 4 4 0 5 5 5 6 3icb 75 8 5 3 0 0 5 22 56 15 3ins_A 21 1 1 0 0 2 2 2 0 3 3ins_B 30 7 38 27 27 30 30 30 0 17 451c 82 1 2 2 2 6 6 6 1 7 4cpv 108 3 16 30 30 30 2 0 0 13 4fxn 138 0 0 0 0 0 0 1 1 2 4mdh_A 333 1 0 0 1 1 1 4 4 4 4sgb_I 51 1 1 2 3 3 3 0 0 4 5hir 49 12 12 0 14 14 14 13 0 15 5pti 58 1 1 0 0 0 0 0 0 2 7rsa 124 111 230 35 35 35 1 1 66 36 8adh 374 11 7 1 36 36 13 13 13 14 9api_B 36 8 9 20 34 19 20 105 66 25 Total pairs 348 491 326 439 453 350 540 395 Total subtrees 77 60 46 34 33 32 28 20
See Bernstein et al. (1977). The length of the polypeptide sequence in each of the protein structures is indicated, as is the number of sequence pairs in the protein family (see Materials and methods) in each of the PAM ranges considered.
for each PAM range were averaged over all families. The respect to a particular physicochemical property (see below window size of 30 PAM units was arbitrarily selected. Empiric- and Figure 1), the average of the ratios S over all compensatory ally, a smaller window contained too few pairs to fill the simultaneous variations of a particular morphology can be simultaneous variation matrices, while a larger window compared with the average of the ratios S over all neutral obscured the influence of the PAM distance on the matrices. simultaneous variations and the average of the ratio S over all The number of sequence pairs compared in each PAM window anticompensatory simultaneous variations. These averages (S for each family is listed in Table I. Within each of the resulting scores) were computed and plotted for each of the eight eight proximal and distal variation matrices, the ratio PAM ranges.
S5 M[A→B][C→D]/(M[A→B][C→D]1 N[A→B][C→D]),
Weighting functions
where A is not equal to B and C is not equal to D, was used
Simultaneous variations were counted over all pairs of to indicate the preference for a specific simultaneous variation
sequences within a family. During counting, a weighting [A→B][C→D] to occur at positions near in space in the
function and several normalizations were used. Weighting was three-dimensional protein fold. Whenever the sum of
introduced to compensate for the non-homogeneous distribu-M[A→B][C→D] and N[A→B][C→D] was zero, that element
tion of proteins across the evolutionary tree relating pairwise was ignored. By considering each simultaneous variation to
large distortions in the results. Further, the scheme has the advantage of not requiring any parameters to compute the weights.
When considering individual PAM ranges, this weighting scheme must be applied separately to each subtree delineated by a PAM range (Figure 2). As a single protein family can contribute more than one subtree to the analysis within a given PAM range, before combining matrices calculated separately for each subtree, the matrices are normalized so that their elements lie between zero and one and so that the most significant simultaneous variation within the matrix has a value
Fig. 1. The five simultaneous variation morphologies. Given a biochemical
of one. After summing the matrices for each subtree in a PAM alphabet of n elements, the number of unique covariations for each type is
indicated. range, the resulting matrix was then divided by the number of
subtrees in that PAM range to keep all the values between zero and one. Thus, for a family f, in a PAM range R with p
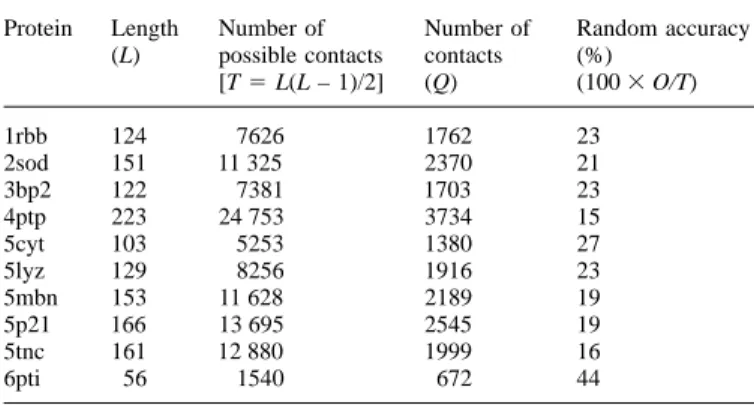
Table II. List of Brookhaven structures used to test the prediction method subtrees t, each proximal and distal variation abcd is given by
Protein Length Number of Number of Random accuracy M
fRabcd5 1/p ΣMtabcd/max(Mt) (L) possible contacts contacts (%)
[T5 L(L – 1)/2] (Q) (1003 O/T) and
1rbb 124 7626 1762 23 NfRabcd5 1/p ΣNtabcd/max(Nt),
2sod 151 11 325 2370 21
3bp2 122 7381 1703 23 respectively, where the summation is done all over p subtrees.
4ptp 223 24 753 3734 15 Before averaging the corresponding matrices in different
famil-5cyt 103 5253 1380 27 ies, the same normalization is again applied so that the
5lyz 129 8256 1916 23
most prominent simultaneous variation in each matrix carries
5mbn 153 11 628 2189 19
equal weight:
5p21 166 13 695 2545 19
5tnc 161 12 880 1999 16
MRabcd5 1/qΣMfabcd/max(Mf)
6pti 56 1540 672 44
and The structures not found in Table I were not used in the development set.
The sequence length, L, the number of possible contacts, [L(L – 1)/2]5 P,
NRabcd5 1/qΣNfabcd/max(Nf), the number of observed contacts (O) using a distance criterion of 6 A˚ (see
text) and the random accuracy of a covariation prediction (1003 O/P) as a
where q is the number of protein families over which the percentage are given.
summation is performed.
The number of simultaneous variations rises proportionally highly homologous sequences having residue A at position x
with [n(n – 1)]/2, where n is the number of residues being and residue C at position y and a single distantly related
considered. The number of residues in a protein increases with sequence having residue B at position x and residue D at
the length of the polypeptide sequence. To be consistent with position y, the simultaneous variation [A→B][C→D] between
the notion that any two pairs of sequences in the same PAM the distantly related sequence and the 10 close homologues
range should contribute equally to the simultaneous variation should not be scored 10 times (once for each of the pairings
matrix, a second normalization was done. Each simultaneous of the distantly related sequence to each of the close
homo-variation was weighted to increment the respective matrix logues) but only once, since it is likely that only two
evolution-element (in M or N) cell by dividing one by the total number ary events (the conversion of B to A at position x in the time
of simultaneous variations counted for that pair of sequences, before the 10 close homologues diverged and the conversion
multiplied by the weight w attributed to that pair of sequences. of D to C at position y in the time before the 10 close
This is introduced simply to counter the fact that shorter homologues diverged) yielded all 10 simultaneous variations.
sequence pairs have less opportunity to generate simultaneous To avoid bias, the evolutionary relationship between the
variations than longer ones: the number of pairs of positions sequences must be considered.
grows approximately quadratically with the sequence length. To this end, phylogenetic trees were constructed for each
Covariation classes
family and the weight w5 2–(ki1 kj– 2) applied to each pair
of sequences i and j, where kiis the number of nodes above In this work, three physicochemical classes of simultaneous variation were considered: the residue volume, the residue side leaf i in the phylogenetic tree, including a hypothetical root
representing simply the evolutionary centre of the mass of the chain hydrogen bonding potential and the residue charge. Since the amount of sequence data is not sufficient to fill all 36 290 tree (Figure 2) and kjis the number of nodes above leaf j in
the phylogenetic tree, including a hypothetical root representing matrix elements to a level desired for a statistically significant interpretation, the 20 amino acids were aggregated into groups the centre of the mass of the tree. Such a weighting scheme
has the property that the sum of the weights equals unity. This according to their volume, charge and hydrogen bonding potential as indicated in Figure 3.
weighting based purely on the topology of the tree is simpler
to apply than a more precise weighting, which would consider Within each class, the simultaneous variation was viewed as compensatory, neutral or anticompensatory, depending on the evolutionary distances between the nodes (including the
internal nodes) in the tree. However, because the evolutionary the residue substitutions observed. Simultaneous variations were defined to be compensatory in volume when the total distances between the sequence pairs were limited to only 100
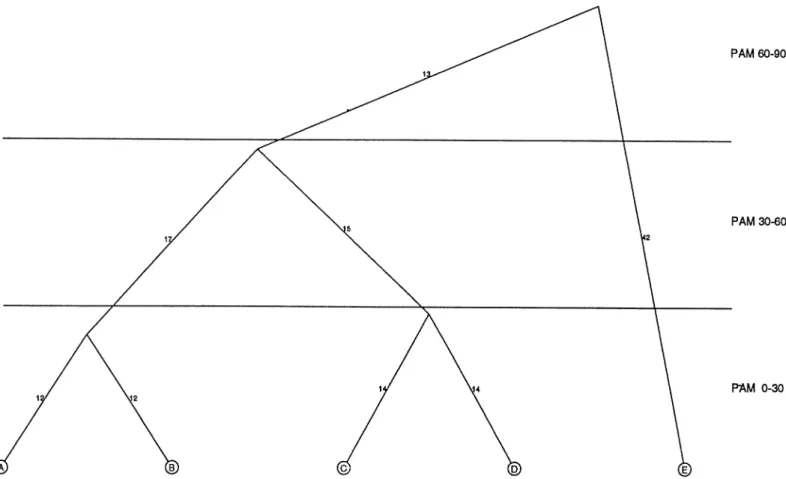
Fig. 2. Phylogenetic tree of a hypothetical protein family consisting of five sequences A–E. Three PAM ranges are indicated. For the PAM range 0–30, there
are two subtrees. The weight ascribed to the sequence pair AB would be 1. Likewise the sequence pair CD, in a different subtree, would also have a weight of 1. In the PAM range 30–60 there is only one subtree involving sequence pairs AC, AD, BC and BD each with weight 0.25. The whole tree is considered in the PAM range 60–90 but only individual sequence pairs AE, BE, CE and DE, separated by at least 60 PAM units are considered, each with weight 0.25.
analysis of a volume compensatory simultaneous variation, only non-charged residues were considered.
Simultaneous variations involving changes in the charged side chains were defined as compensatory only if the net charge was conserved. In all other cases, the covariation was treated as anticompensatory.
Simultaneous variations involving changes in the side chains that had a hydrogen bonding potential were defined to be compensatory if either a hydrogen bond donor at one covarying position and an acceptor at the second covarying position interchange with an acceptor at the first position and a donor at the second position or if a donor and acceptor side chains were replaced by side chains with no hydrogen bonding capacity (‘inert’ side chains). If only inert side chains or only side chains that contain both side-chain donor or acceptor groups were involved, the simultaneous variation was also qualified as compensatory. The remaining simultaneous
vari-Fig. 3. Groupings for the standard amino acids for the compensatory classes
ations involving side chains with hydrogen bonding potential volume, charge and hydrogen bonding. Only non-charged amino acid types
were used for the volume class and therefore group 7 is omitted. The were defined as anticompensatory.
volumes were taken from Chothia (1975). The proximal and distal variation matrices were calculated using a sliding window of 30 PAM units for each of the covariation classes: volume, charge and hydrogen bonding. changed by more than the volume of a methyl group (~30 Å).
For each PAM window, the structure prediction scores S were Simultaneous variations were defined to be neutral when the
averaged over all the simultaneous variations defined to be total volume of the residues at the covarying positions changed
compensatory and a covariation signal was extracted. Similar from between one and two methyl groups. Larger changes in
non-Fig. 6. A plot of the S score for simultaneous variations involving changes
in the charge averaged over a sliding window of 30 PAM units, at 10 PAM
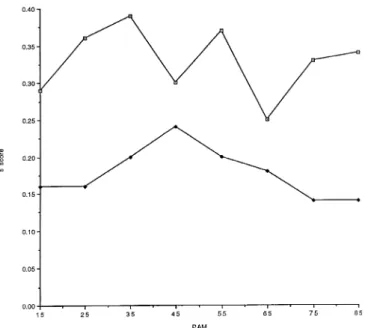
Fig. 4. A plot of the S scores for the simultaneous variations involving unit intervals against the PAM. The compensatory S scores are indicated by
changes in the residue side chain volumes, averaged over a sliding window open squares and the anticompensatory S scores by filled diamonds. of 30 PAM units, at 10 PAM unit intervals against the PAM. The
compensatory S scores are indicated by open squares, the neutral S scores by filled diamonds and the anticompensatory S scores by filled squares.
in the protein structure, all the compensatory simultaneous variations in each pair of sequences in a phylogenetic subtree are tallied in an n3 n pairwise position matrix Q, where n is the length of the alignment. Any pair of alignment positions l and m, in a pair of sequences i and j, in a subtree t, in a PAM range R, will either be compensatory or not, with respect to a physicochemical parameter. A matrix QRt is created for each subtree t in each PAM range R. The compensatory simultaneous variations at positions l and m in the sequence pair i and j increment the matrix elements QRtlm and QRtmlby the weight
w5 2–(ki1 kj– 2), where k
iis the number of nodes above leaf
i in the subtree t and kj is the number of nodes above leaf j in the phylogenetic tree. The corresponding elements of all matrices QRtin the same PAM range are summed together to form the matrix QR. Prior to summing, the matrices are normalized so that QRtlm5 QRtlm/max(QRt). QRis then divided by the number of subtrees in that PAM range. After scoring all the pairs of positions in all the pairs of sequences, the pairwise position matrix is sorted and the high scoring values taken to indicate interacting positions, which are called covari-ations. This procedure was applied to 10 representative protein families (Table II) using different PAM ranges to define the subtrees over which to tally the covariations.
Fig. 5. A plot of the S score for simultaneous variations involving hydrogen
Results bonding side chains averaged over a sliding window of 30 PAM units, at 10
PAM unit intervals against the PAM. The compensatory S scores are PAM dependence of compensatory, neutral and anti-indicated by open squares and the anticompensatory S scores by filled
compensatory covariation
diamonds.
Figure 4 shows a plot of the number of compensatory, neutral and anticompensatory simultaneous variations near in space compensatory and neutral simultaneous variations. The average
divided by the total number of simultaneous variations (S
S score values are plotted in Figures 4–6. scores), considering the volume of the residue side chains, Prediction of contacts using a sliding window of 30 PAM units at increments of 10
PAM units. At low evolutionary distances, the S scores Given a multiple alignment, a procedure similar to that used
to count the observed simultaneous variations can be used to for compensatory covariation (where the total volume in a simultaneous substitution changes by less than the volume of assign a score to a pair of positions to reflect the likelihood
that these positions are close in space in the tertiary fold of a single methyl group) are significantly greater than those for both the neutral and anticompensatory covariation, where the the protein. To predict the alignment positions in contact
total volume change is between 1 and 2 methyl groups and statistics are undoubtedly responsible, at least in part, for the conclusion of some other authors that compensatory covariation by more than 2 methyl groups respectively (Figure 4). As
either does not exist or yields only a faint signal. protein sequences diverge, however, the S scores for the neutral
However, such averages obscure trends within the PAM covariations rise rapidly, overtaking the compensatory changes
distances. Again, the ability of covariation analysis to detect by 40 PAM units. The frequency of the anticompensatory
residue pairs in contact in the folded structure depends on changes (where the volume changes are still larger) rises more
the evolutionary distance separating the protein pairs being slowly. After the protein sequences have diverged by 100 PAM
examined. Thus, volume compensation is no better than random units, the S score for the compensatory changes is the same
chance at indicating two residues in contact when examining as the score for the neutral changes and only slightly greater
protein pairs that have suffered 70–100 accepted point than the score for the anticompensatory changes.
mutations per 100 amino acids (PAM units). Volume compensa-Figure 5 shows a plot of the number of compensatory and
tion is, however, 21% more likely than random selection to anticompensatory simultaneous variations that involve amino
identify two residues in contact when examining protein pairs acid side chains that can form hydrogen bonds. The
compensat-that have diverged 30 or fewer PAM units. Likewise, charge ory S scores are greatest (~0.3) when two proteins have
compensation is actually worse in this test set than random diverged by 30–70 PAM units. At lower and higher PAM
chance in identifying two residues in contact when examining ranges, the S scores are not significantly greater than the
protein pairs that have diverged 70–100 PAM units. Charge anticompensatory scores, which remain roughly constant at
compensation is, however, 22% more likely than random ~0.2.
change to identify two residues in contact when examining Figure 6 shows a plot of the number of compensatory and
protein pairs that have diverged 30 or fewer PAM units. anticompensatory simultaneous variations that involve charged
residues (Figure 6). Here, both the compensatory and
anticom-Discussion pensatory S scores remain approximately constant across the
The analysis of compensatory covariation presents a paradox. entire PAM range examined. The average compensatory S
On the one hand, examples exist where compensation has score is ~0.33 and the average anticompensatory score is
been used ‘semi-manually’ in a bona fide prediction setting to ~0.18. Regardless of the evolutionary distance between the
provide an accurate guide to the tertiary structure (Benner and sequence pairs, approximately one-third of all the charge
Gerloff, 1991). On the other hand, analyses based on fully compensatory variations at internal positions are therefore
automated computer tools suggest that in general, the signal compensated.
should be weak or unreliable (Go¨bel et al., 1994; Neher, 1994;
Retrodiction of amino acids near in space in 10
Shindyalov et al., 1994; Taylor and Hatrick, 1994). While
representative proteins
human intervention and intuition can be used in a ‘semi-To learn more about whether a simple compensatory analysis manual’ prediction to good effect (Gerloff and Benner, 1993), alone might be useful in predicting three-dimensional struc- it is clear that compensatory covariation is one area where full tures, the algorithm described in Materials and methods was automation is highly desirable and manual implementation applied to 10 protein structures, using multiple alignments clouds efforts to evaluate the generality of the approach. obtained from the HSSP databank (Sander and Schneider, On the one hand, the results reported here are not more 1991). Simultaneous variations that were compensatory in encouraging. With 10 test proteins, the covariation analysis terms of their charge and volume were examined. The method improved the identification of residue contacts by only a few was applied separately for protein pairs separated by different per cent. A closer inspection of these results suggests, however, PAM ranges. The highest k scores in the pairwise position that several expedients might improve the value of compensat-matrix, where k was arbitrarily set to one-fifth of the sequence ory covariation as a prediction tool. The first is based on the length, were extracted; these two amino acids were ‘retrodicted’ general observation that an analysis of patterns of compensation to be in contact in the three-dimensional fold of the protein. and covariation in a family of proteins undergoing divergent Next, an ‘improvement ratio’ was calculated to be the evolution under functional constraints will yield more structural percentage of observed correct retrodictions (residues whose information if done within the context of specific measures of
k values are high and whose side chains are in fact within evolutionary distance (Benner, 1989; Benner and Gerloff, 6 Å) divided by the percentage of the amino acid pairs whose 1991; Neher, 1994). Figures 4–6 suggest that a covariation side chains are in contact in the experimental structure. The ‘signal’ sought without focusing on specific PAM windows improvement ratio indicates how much more likely an analysis will generally be smaller than one where the evolutionary seeking compensatory covariation is to identify a pair of divergence of the proteins being analysed is ignored. Further, residues in contact correctly than is a random assignment of the PAM window that gives the best results depends on the
residue pairs. physicochemical properties being compensated.
Tables III and IV show that the predictions of residue pairs These observations are rationalizable. Considering volume in contact are, at the best PAM distance, only ~27% accurate, compensation, as the evolutionary distance increases, the with both the volume and charge compensation. A more number of substitutions increases, increasing the probability accurate view of the value of the compensatory covariation that the volume compensation necessary to preserve the analysis can be obtained by examining the improvement scores selected function will be achieved by substitution at three (Table IV). Averaged over all the PAM distances, the volume (or more) centres rather than at just two. As three-centre compensatory covariation is only 4% more likely to identify compensation is impossible to detect over the background residue pairs in contact than is the random selection of residue noise, the signal arising from pairwise compensatory covari-pairs. Charge compensatory covariation, averaged over all the ation will be lost at higher evolutionary distances. In contrast, PAM distances, is only 7% more likely to identify residue a loss of a charge at position i cannot be compensated for by the gain of two half charges at positions j and k. This pairs close in space than is random selection. These sorts of
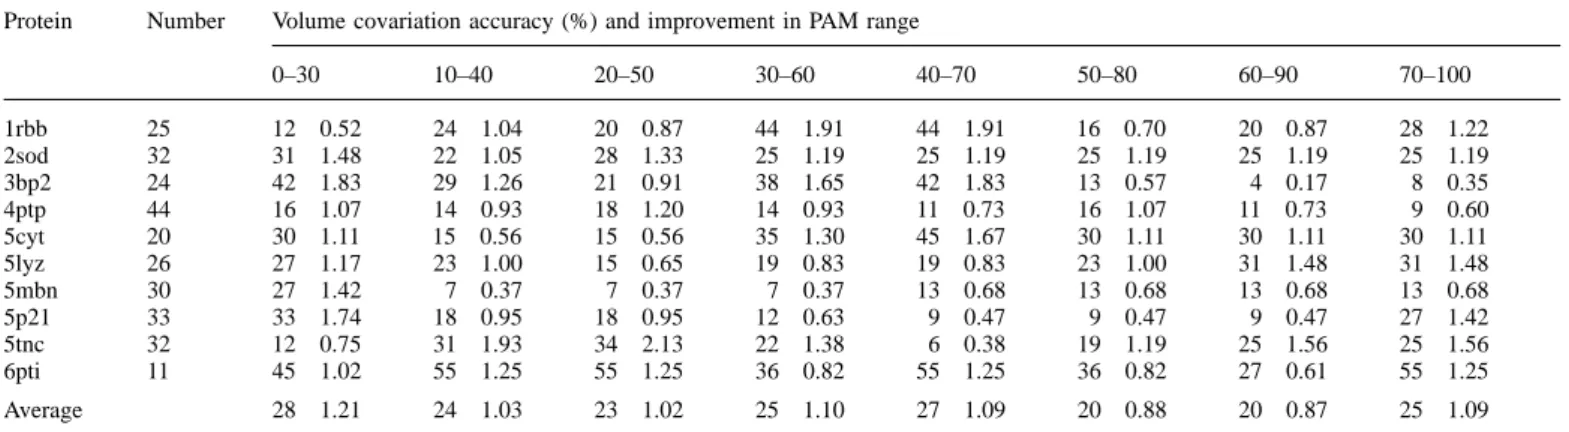
Table III. S scores for the number of predicted covariation sites in the test proteins
Protein Number Volume covariation accuracy (%) and improvement in PAM range
0–30 10–40 20–50 30–60 40–70 50–80 60–90 70–100 1rbb 25 12 0.52 24 1.04 20 0.87 44 1.91 44 1.91 16 0.70 20 0.87 28 1.22 2sod 32 31 1.48 22 1.05 28 1.33 25 1.19 25 1.19 25 1.19 25 1.19 25 1.19 3bp2 24 42 1.83 29 1.26 21 0.91 38 1.65 42 1.83 13 0.57 4 0.17 8 0.35 4ptp 44 16 1.07 14 0.93 18 1.20 14 0.93 11 0.73 16 1.07 11 0.73 9 0.60 5cyt 20 30 1.11 15 0.56 15 0.56 35 1.30 45 1.67 30 1.11 30 1.11 30 1.11 5lyz 26 27 1.17 23 1.00 15 0.65 19 0.83 19 0.83 23 1.00 31 1.48 31 1.48 5mbn 30 27 1.42 7 0.37 7 0.37 7 0.37 13 0.68 13 0.68 13 0.68 13 0.68 5p21 33 33 1.74 18 0.95 18 0.95 12 0.63 9 0.47 9 0.47 9 0.47 27 1.42 5tnc 32 12 0.75 31 1.93 34 2.13 22 1.38 6 0.38 19 1.19 25 1.56 25 1.56 6pti 11 45 1.02 55 1.25 55 1.25 36 0.82 55 1.25 36 0.82 27 0.61 55 1.25 Average 28 1.21 24 1.03 23 1.02 25 1.10 27 1.09 20 0.88 20 0.87 25 1.09
S5M[A→B][C→D]/(M[A→B][C→D]1 N[A→B][C→D]), where M is the substitution matrix for residue pairs,6 Å distant in the crystal ztructure and N is the substitution matrix for residue pairs.6 Å distant in the crystal structure. A is not equal to B and C is not equal to D, was used to indicate the preference for a specific simultaneous variation [A→B][C→D] to occur at positions near in space in the three-dimensional protein fold.
Table IV. Improvement scores resulting from a compensatory covariation analysis retrodicted for 10 test proteins
Protein Number Charge covariation accuracy (%) and improvement in PAM range
0–30 10–40 20–50 30–60 40–70 50–80 60–90 70–100 1rbb 25 16 0.70 28 1.22 20 0.87 24 1.04 24 1.04 44 1.91 20 0.87 32 1.39 2sod 32 38 1.81 34 1.62 31 1.48 34 1.62 13 0.62 19 0.91 19 0.91 19 0.91 3bp2 24 33 1.44 29 1.26 17 0.74 8 0.35 29 1.26 13 0.57 21 0.91 4 0.17 4ptp 44 7 0.47 21 1.40 16 1.07 5 0.33 11 0.73 2 0.16 7 0.47 9 0.60 5cyt 20 65 2.41 60 2.22 45 1.67 35 1.30 30 1.11 25 0.93 25 0.93 25 0.93 5lyz 26 4 0.17 8 0.35 8 0.35 50 2.17 50 2.17 42 1.83 19 0.83 19 0.83 5mbn 30 23 1.21 10 0.53 10 0.53 10 0.53 30 1.58 30 1.58 13 0.68 13 0.68 5p21 33 39 2.05 36 1.90 30 1.58 27 1.42 24 1.26 30 1.58 3 0.16 24 1.26 5tnc 32 25 1.56 25 1.56 19 1.19 22 1.38 25 1.56 19 1.19 13 0.81 19 1.19 6pti 11 18 0.41 9 0.21 45 1.02 45 1.82 36 0.82 45 1.02 36 0.82 18 0.41 Average 27 1.22 26 1.23 24 1.05 26 1.12 27 1.21 27 1.17 18 0.73 18 0.84
The improvement ratios calculated to be the percentage of observed correct retrodictions (residue pairs whose k values are high and whose side chains are in fact within 6 Å) divided by the percentage of the amino acid pairs whose side chains are in contact in the experimental structure.
may explain why the difference between the signal for the et al. (1988) reflected the tree-like nature of the divergent
evolution of the protein families being studied, not the structural compensatory charge covariation is approximately independent
of the PAM distance. Further, only residues with a side chain factors. In their own study, Taylor and Hatrick (1994) found that changes in the residue volume were compensated for by exposure of 40% or less were examined in this work. An
unsatisfied buried charge is almost certainly more destabilizing pairwise substitution better than changes in the charge and hydrophobicity. This is different from the results reported than an uncompensated change in the volume, perhaps also
explaining the stronger and more persistent signal involving here. However, Taylor and Hatrick (1994) did not explicitly incorporate an evolutionary distance into their analysis and the charge variation.
Compensatory covariation involving hydrogen bonding side did not restrict their analysis to the interior residues. Our results show that both factors have an important impact on chains can also be explained. Within the 20 standard amino
acids, it is difficult to change the hydrogen bonding potential the results.
Shindyalov et al. (1994) found a significant covariation of amino acid side chains without also changing the size and
shape of the residue. Thus, if a protein fold cannot tolerate an signal in only 15 of the 65 proteins they examined. They found stronger signals if attention was focused on the internal uncompensated change of the hydrogen bonding donor and
acceptor groups within the interior of a protein structure, such positions, defined as those that displayed a conserved pattern of mostly hydrophobic residues, similar to the strategy used changes might also require a volume compensatory change at
a third site. One might speculate that an evolutionary divergence here. However, they did not explore the impact of an evolution-ary distance on covariation or different physicochemical classes to 30–40 PAM units is necessary to enable additional
substitu-tions to alter the amino acid environment sufficiently to accept of compensation, although they did recognize that the latter might be a future direction for analysis.
such exchanges.
Comparing these results with results obtained elsewhere, Neher (1994) analysed haemoglobin using a statistical pro-cedure incorporation an evolutionary distance between the Altschuh et al. (1988) found evidence for compensatory
covariation by examining several test systems, including the proteins to identify covarying positions. He reported that the optimal range of sequence identity for predicting covarying tobacco mosaic virus. Taylor and Hatrick (1994) pointed out,
identity; this corresponds to evolutionary distances of 5–55 exercise contrasted both in method and results with predictions for the same protein family based on more traditional analyses. PAM units. In this range, the volume compensation provided
a very weak signal, while the charge compensation provided In other laboratories (Sternberg and Taylor, 1984; Fry et al., 1986; Taylor et al., 1988), analysis of the motifs and application a stronger signal. Neher’s (1994) results for the globin family
are consistent with ours obtained from a much larger sampling of the standard prediction tools misidentified the two strands as a strand and a helix and drew the incorrect conclusion that of protein families, suggesting that his conclusions might be
rather general. the core of the protein kinase domain was a parallelβ-sheet.
Thus, the results reported here provide a recipe for improving Go¨bel et al. (1994) found that a larger sequence diversity
in a family results in a higher accuracy when compensatory compensatory covariation analysis. To be most useful, the tool must (i) do separate analyses of covariation involving side covariation is used to retrodict the tertiary contacts in a protein,
at least in two examples. By broadening the family from chains with different physicochemical characteristics, (ii) con-sider the evolutionary distances separating the protein proteins 77% identical to include those as little as 30% identical,
the accuracy of the predicted contact sites in ribonuclease sequences being analysed, (iii) include weighting functions that correct for the different numbers of proteins in different was reported to increase from 0.17 to 0.60. For superoxide
dismutase, expanding the family from proteins 68% identical branches of an evolutionary tree, (iv) focus on interior positions, which can be predicted by independent methods (Benner et al., to include those with only 30% sequence identity was reported
to increase the accuracy from 0.25 to 0.56. Our analysis does 1994a), (v) exploit both compensatory and anticompensatory signals and (vi) use compensatory covariation to distinguish not reproduce these results. With ribonuclease (1rbb), we found
only a slight increase in accuracy when considering sequence between a small number of clearly defined folds. Finally, it should be recognized that the search for compensatory covari-divergences of 30–70 PAM units (for volume compensations)
and 50–80 PAM units (for charge compensations) when com- ation is premised on a model for divergent evolution that is essentially neutral in nature (Benner, 1989). To the extent that pared with an analogous analysis for more closely related
proteins (Tables III and IV). No such trend is found for adaptive changes are reflected in the variation observed within a protein family, these are likely not to be compensated. superoxide dismutase (2sod). In general, we find that the
results are best at low PAM distances, particularly for volume Therefore, we suspect that the next step needed to improve the value of covariation analysis requires improved tools for compensation. The differences between our results and those
of Go¨bel et al. (1994) may arise because those authors did distinguishing neutral and adaptive variation. not apply a weighting function to the divergence of the
sequences they compared. This almost certainly influences the Acknowledgements
outcome of the analysis. The authors would like to thank Martina Radtka for assistance in the
Even with the weighting functions, the analysis of the PAM preparation of the manuscript. The authors also wish to acknowledge the efforts of the many workers that have made their experimental results available distance and the separation of compensatory covariation into
through the structure and sequence databanks. three types based on physicochemical parameters, the signal
from a covariation analysis remains small. This raises a strategic question. How might tertiary structure be best
pre-References dicted by joining covariation analysis with other tools that
Altschuh,D., Lesk,A.M., Bloomer,A.C. and Klug,A. (1987a) Protein Engng, analyse patterns of variation and conservation within a
diver-1, 228–236.
ging protein family (Zvelebil et al., 1987; Overington et al.,
Altschuh,D., Lesk,A.M., Bloomer,A.C. and Klug,A. (1987b) J. Mol. Biol., 1992; Benner et al., 1994b; S.A.Benner, G.Chelvanayagam 193, 693–707.
and M.Turcotte, submitted)? Altschuh,D., Vernet,T., Moras,D. and Najai,K. (1988) Protein Engng, 2,
193–199. These results offer some suggestions. First, the interior and
Bairoch,A. and Boeckmann,B. (1991) Nucleic Acids Res., 19, 2247–2250. surface residues can be predicted from the patterns of variation
Baldwin,E.P., Hajiseyedjavadi,W.A. and Matthews,B.W. (1993) Science, 262, and conservation within a protein family (Benner et al., 1994a), 1715–1718.
allowing covariation analyses to focus on interior residues in Benner,S.A. (1989) Adv. Enzyme Regulat., 28, 219–236.
Benner,S.A. and Gerloff,D. (1991) Adv. Enzyme Regulat., 31, 121–181. a bona fide prediction setting. This was in fact done in the
Benner,S.A. and Gerloff,D. (1996) Proteins: Struct. Funct. Genet., in press. specific use of compensatory covariation to detect successfully
Benner,S.A., Badcoe,I., Cohen,M.A. and Gerloff,D.L. (1994a) J. Mol. Biol., the antiparallel sheet in protein kinase (Benner and Gerloff,
235, 926–958.
1991) and to analyse the fibrinogen structure (Benner and Benner,S.A., Gerloff,D.L. and Jenny,T.F. (1994b) Science, 265, 1641–1643.
Gerloff, 1996). Bernstein,F.C., Koetzle,T.F., Williams,G.J.B., Meyer,E.T.,Jr, Brice,M.D.,
Rodgers,J.R., Kennard,O., Shimanouchi,T. and Tansumi,M. (1977) J. Mol. Next, compensating changes might be used to help
distin-Biol., 112, 535–542. guish between a small number of alternative predicted folds
Blundell,T.L., Sibanda,B.L., Sternberg,M.J.E. and Thornton,J.M. (1987) in the context of a well-defined secondary structural prediction, Nature, 326, 347–352.
as suggested by Taylor and Hatrick (1994). This was in fact Bordo,D. and Argos,P. (1990) J. Mol. Biol., 211, 975–988. Bryant,S.H. and Lawrence,C.E. (1993) Proteins, 16, 92–112. done in the protein kinase prediction (Benner and Gerloff,
Chothia,C. (1975) Nature, 254, 304–308. 1991), starting from the correct identification of two
consecut-Chothia,C. and Lesk,A.M. (1982) J. Mol. Biol., 160, 309–323. ive secondary structural elements as two β-strands. These
Chothia,C. and Lesk,A. (1986) EMBO J., 5, 823–826.
strands might be antiparallel in the same sheet or might Cohen,F.E., Abarbanel,R.M., Kuntz,I.D. and Fletterick,R.J. (1986) not, instead forming parts of two distinct sheets. A single Biochemistry, 25, 266–275.
Dayhoff,M.O., Schwartz,R.M. and Orcot,B.C. (1978) In Dayhoff,M.O. (ed.), compensatory covariation involving charged residues was used
A Model of Evolutionary Change in Proteins. I. Atlas of Protein Sequence to distinguish between these alternative models. The crystal
and Structure. National Biomedical Research Foundation, Washington, DC, structure found the antiparallel β-sheet (Knighton et al., Vol. 5, Suppl. 3, pp. 345–352.
1991). Further, the two residues whose charge compensatory Fry,D.C., Kuby,S.A. and Mildvan,A.S. (1986) Proc. Natl Acad. Sci. USA, 83, 907–911.
Gerloff,D.L. and Benner,S.A. (1993) FEBS Lett., 325, 29–33.
Go¨bel,U., Sander,C., Schneider,R. and Valencia,A. (1994) Proteins: Struct. Funct. Genet., 18, 309–317.
Gonnet,G.H. (1993) DARWIN: A Tutorial Introduction (available by electronic mail at [email protected]).
Gonnet,G.H., Cohen,M.A. and Benner,S.A. (1992) Science, 256, 1443–1445. Heringa,J., Sommerfeldt,H., Higgins,D. and Argos,P. (1992) Comp. Appl.
Biosci. (CABIOS), 8, 599–600.
Hilbert,M., Bohm,G. and Jaenicke,R. (1993) Proteins, 17(2), 138–151. Hobohm,U., Scharf,M., Schneider,R. and Sander,C. (1992) Protein Sci., 1,
409–477.
Jones,D.T., Taylor,W.R. and Thornton,J.M. (1992) Nature, 358, 86–89. Kabsch,W. and Sander,C. (1983) Biopolymers, 22, 2577–2637.
Knighton,D.R., Zheng,J., Ten Eyck,L., Ashford,F.V.A., Xuong,N.H., Taylor,S.S. and Sowadski,J.M. (1991) Science, 253, 407–414.
Lesk,A.M. and Chothia,C. (1980) J. Mol. Biol., 136, 225–270. Lesk,A.M. and Chothia,C. (1982) J. Mol. Biol., 160, 325–342. Lim,W.A. and Sauer,R.T. (1989) Nature, 399, 31–36.
Lim,W.A., Farruggio,D.C. and Sauer,R.T. (1992) Biochemistry, 31, 4324–4333. Neher,E. (1994) Proc. Natl Acad. Sci. USA, 91, 98–102.
Oosawa,K. and Simon,M. (1986) Proc. Natl Acad. Sci. USA, 83, 6930–6934. Overington,J., Donnelly,D., Johnson,M.S., Sali,A. and Blundell,T. (1992)
Protein Sci., 1, 216–226.
Paulsen,M.D. and Ornstein,R.L. (1991) Proteins: Struct. Funct. Genet., 11, 184–204.
Rossman,M.G., Liljas,A., Branden,C.I. and Banaszak,L.J. (1975) The Enzymes,
11, 61.
Sander,C. and Schneider,R. (1991) Proteins: Struct. Funct. Genet., 9, 56–68. Shindyalov,I.N., Kolchanov,N.A. and Sander,C. (1994) Protein Engng, 7,
349–358.
Sternberg,M.J.E. and Taylor,W.R. (1984) FEBS Lett., 175, 387–392. Taylor,S.S., Buechler,J.A., Slice,L.W., Knighton,D.K., Durgerian,S.,
Ringheim,G.E., Neitzel,J.J., Yonemoto,W.M., Sowadski,J.M. and Dospmann,W. (1988) Cold Spring Harbor Symp. Quant. Biol., 53, 121–130. Taylor,W.R. and Hatrick,K. (1994) Protein Engng, 7, 341–348.
Zhang,K.Y.J. and Eisenberg,D. (1994) Protein Sci., 3, 687–695. Zielenkiewicz,P. and Sanger,W. (1992) Biophys. J., 63, 1483–1486. Zvelebil,M.J., Barton,G.J., Taylor,W.R. and Sternberg,M.J.E. (1987) J. Mol.
Biol., 195, 957–961.
Received June 21, 1996; revised September 18, 1996; accepted September 30, 1996